Are you in charge of looking after your company’s IT infrastructure? If so, then you are probably in the market for a new monitoring solution.
This will need to be able to function as a server hardware monitoring software solution if you are going to keep your systems up and running for any long periods of time.
What does this mean? You will need to monitor your systems’ CPU usage, memory utilization, system temperature, disk space, and everything in between.
Here is our list of the best hardware and server monitoring software:
- NinjaOne Endpoint Management – EDITOR’S CHOICE This SaaS system provides monitoring for servers, networks, and applications with constant polling of server statuses to identify approaching resource shortages. Start a 14-day free trial.
- Paessler PRTG – FREE TRIAL A bundle of network, server, and application monitors that can be tailored by deciding which services to turn on. Runs on Windows Server. Start a 30-day free trial.
- Site24x7 Server Monitoring – FREE TRIAL A cloud-based monitoring package that covers networks, servers, and applications. Has a 30-day free trial.
- ManageEngine OpManager – FREE TRIAL A network and server monitor that covers all of the hardware in a typical office system. Available for Linux and Windows Server. Start a 30-day free trial.
- ManageEngine OpManager Nexus – FREE TRIAL This enterprise server monitoring tool correlates server health with network, application, storage, and security layers for comprehensive insights into the health and performance of your server and hardware tools. Download a 30-day free trial.
- Nagios XI An infrastructure monitoring system that can be expanded by a list of available free plugins. Runs on Linux.
- Checkmk This monitoring system package watches over the performance of networks and applications as well as servers. Runs on Linux.
- SolarWinds Systems Management Bundle A package of four SolarWinds monitoring solutions that work together to create cross-modular functions. The bundle runs on Windows Server.
- HWMonitor A basic hardware monitoring system that is available in free and paid editions. Runs on Windows.
- SysGauge A simple monitor for networks and the devices connected to them that is available in free and paid versions. Runs on Windows.
- Zabbix A free system monitoring package that includes some great data visualizations. Runs on Linux, macOS, and Unix.
Why do you Need Server Hardware Monitoring?
Servers are the backbone of any modern-day enterprise, and without them there would be no business to speak of.
Your servers work hard, ensuring that your applications, network connections and files are always available 24/7.
To make sure that your server infrastructure is always available we need to look at some of these important aspects of your server installations:
- Health monitors that give real time feedback regarding issues such as CPU temperate, CPU load, and other vital information about the wellbeing of your servers.
- Notifications and alerts. When an issue is detected, how do you find out about it?
- Finding out about what is needed and where for future upgrades
- Proactive software that minimizes system outages and down time
The Best Hardware & Server Monitoring Tools
We will look at some of the best paid and free solutions for your personal requirements, allowing you to make the ultimate decision.
1. NinjaOne Endpoint Management – FREE TRIAL
NinjaOne Endpoint Management provides monitoring for servers, workstations, and mobile devices. Companion modules also offer network device monitoring.
Why do we recommend it?
We put NinjaOne Endpoint Management through its paces and tested out its praised real-time server and network monitoring capabilities.
In a recent event, NinjaOne detected an impending server resource shortage that we were unaware of, specifically related to an application’s memory consumption. This proactive alert enabled us to optimize server resources and prevent a potential application crash.
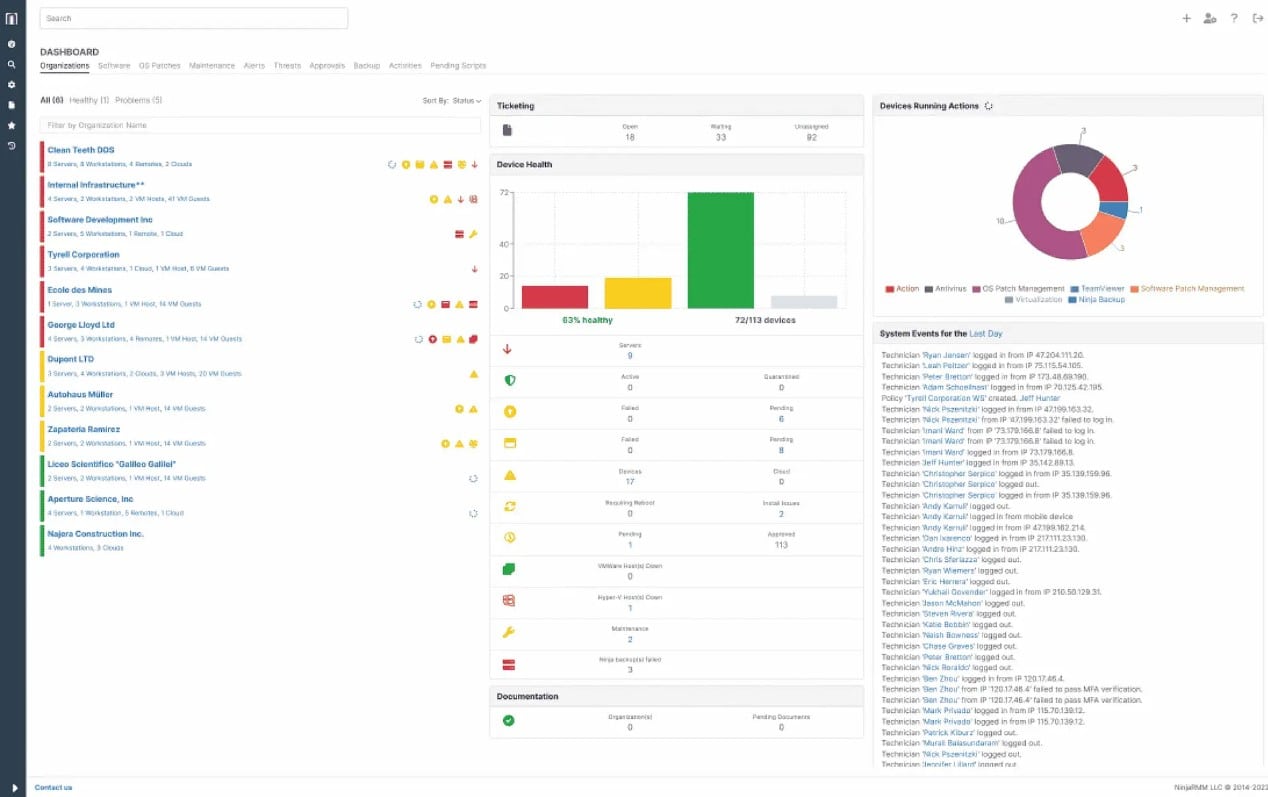
The Endpoint Management system discovers all endpoints and logs them with their attributes into a hardware inventory. It then scans each endpoint and records all installed software. The system can be used to spot unauthorized devices and also standardize the software profile of each endpoint. The system includes an option to install antivirus software on each device and that will also check that the user or an intruder, hasn’t deleted the AV.
The Server Management unit is designed for use by IT departments. There is an alternative package available for managed service providers (MSPs). The MSP system is NinjaOne RMM, which stands for “remote monitoring and management.
The ongoing server monitoring tool provides supervision of CPU, memory, and disk activity, noting the utilization of those services with respect to their full capacity. If capacity reaches exhaustion, the monitor raises an alert. This urges technicians to take action. The cloud-based console shows an overview for all servers, which can be on many different sites. So, technicians get to know immediately which server is showing problems.
Who is it recommended for?
NinjaOne Endpoint Management is recommended for IT departments and managed service providers (MSPs) looking to efficiently monitor and manage servers, workstations, and applications. It’s an ideal choice for organizations seeking constant polling of server statuses to prevent resource shortages and ensure the uninterrupted performance of critical applications and services.
Users of NinjaOne Endpoint Management should ideally have a moderate level of experience in IT management and server monitoring. However, its user interface and comprehensive capabilities also make it accessible to those with varying levels of IT expertise, making it suitable for a wide range of users.
While the tool offers user-friendly features, a foundational understanding of server resource management and network monitoring concepts is beneficial for maximizing its effectiveness.
Once you register for the free trial, you can arrange for a custom quote. NinjaOne is a SaaS package, so you sign up online rather than downloading software. You start by accessing a 14-day free trial.
EDITOR'S CHOICE
NinjaOne RMM is our top pick for hardware and server monitoring software because it is able to discover and document an entire system across the internet. This is a cloud-based SaaS service and it requires a data collector to be installed on the monitored network. This unit scans the network and generates a hardware inventory in the NinjaOne dashboard. The inventory includes all network devices, workstations, and servers. The tool will also scan each endpoint and create a software inventory, This list provides software license management and also forms the basis of an automated patch manager. The NinjaOne package also includes a Help Desk ticketing system. This will automatically route issues to technicians and provide monitoring for task goal timelines. The system will channel system alerts through the ticketing service as well as user support requests.
Download: Access a 14-day FREE Trial
Official Site: https://www.ninjaone.com/freetrialform/
OS: Cloud-based
2. Paessler PRTG – FREE TRIAL
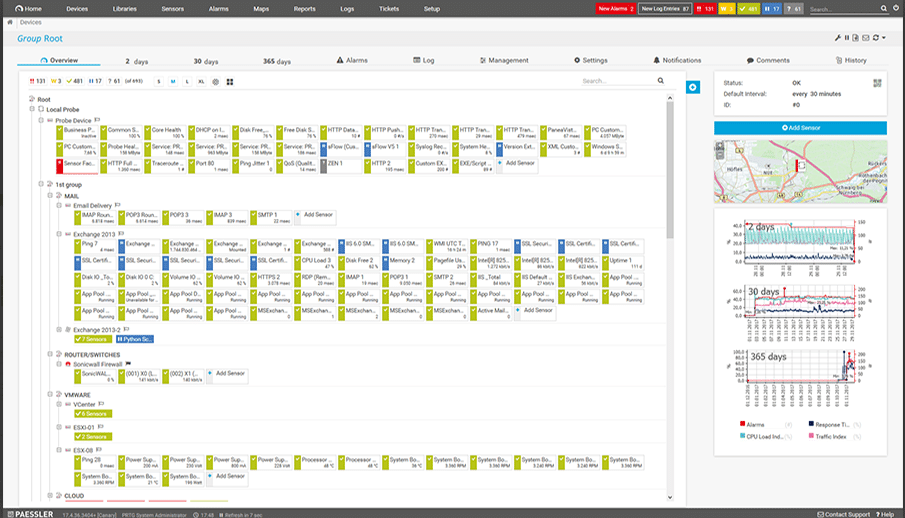
Paessler PRTG are some of the most famous premium network monitoring solutions that you can find these days. However, it can also be used for performing other monitoring tasks such as keeping an eye on CPU, RAM, Hard Disk Drives, Printers, and almost any other enterprise hardware you can think of. By default you are able to monitor hardware from vendors such as HP, Dell, Cisco and IBM.
Why do we recommend it?
Paessler PRTG proved invaluable during our assessment when it uncovered a hidden security vulnerability within our network. It detected irregular patterns of data traffic that indicated a potential cyber threat, enabling us to take immediate action to mitigate the risk and safeguard our network from a potential breach.
Like most modern monitoring solutions, PRTG offers you a single location from where you can monitor all of your targets of interest on the network. The dashboard is web based, meaning that you can access your data from almost anywhere once configured correctly.
Alerts are also configurable, so you can receive messages from sources such as email or text message whenever there are issues detected on your network. You can set the sources for these notifications, as well as the thresholds.
Installation is very easy and has auto discovery for finding the targets on your network that you want to monitor. Installation is compatible with Windows Server and notifies you via email or text message.
If you have a specific network range that needs monitoring, then you can input that information during the configuration step.
Who is it recommended for?
Paessler PRTG is designed to be user-friendly and accessible to individuals with varying levels of experience. It offers a straightforward and intuitive interface that makes it suitable for both experienced IT professionals and those with limited experience in network monitoring.
Organizations such as IT Service Providers can offer network monitoring services to clients using PRTG, ensuring the reliability and performance of their customers’ networks.
In the financial sector, PRTG helps monitor critical financial applications, ensuring secure and responsive access to trading platforms and customer accounts.
PRTG pricing starts at around $1750 for 500 sensors. Download the Free (Limited) Version to Test Drive today! For more information be sure to check out their website here.
3. Site24x7 Server Monitoring – FREE TRIAL
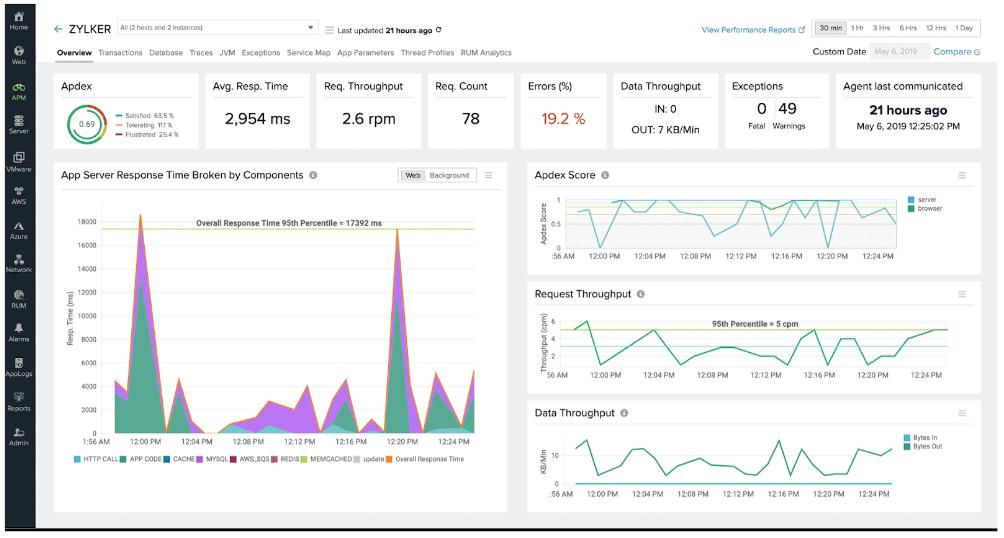
Site24x7 is a cloud-based system monitoring tool that has modules to monitor networks, servers, and applications. It is particularly focused on tracing the application dependencies that lie behind all user facing software. This drill down to the resources of the server that hosts all of the supporting services and applications. A network monitoring module in the Infrastructure package enables you to check on the performance of network devices and track traffic volumes over the network.
Why do we recommend it?
We tested out Site24x7 Server Monitoring, which is known for its effectiveness in proactively identifying and addressing website downtime issues. Within minutes, Site24x7’s monitoring alerted us to a critical server misconfiguration that was causing intermittent downtime during high-traffic periods. This allowed us to rectify the issue promptly, ensuring uninterrupted website availability and a smoother user experience.
As a cloud-based system, Site24x7 includes all of the processing and storage resources needed to run the monitoring software in with the price of the service’s subscription. However, it is necessary to install a data collection program on the monitored system. This collects statistics about the network, servers, and applications and uploads them over an encrypted connection to the Site24x7 server for processing.
The console for the monitoring system is accessed through any standard Web browser from anywhere. The screens in the dashboard can be customized by the user through a drag-and-drop facility.
Site24x7 Infrastructure places performance thresholds on all of the metrics that it measures. If the performance of any resource drops below an acceptable level, the system raises an alert. This is forwarded to technicians by SMS, email, voice call or instant messaging post.
Who is it recommended for?
Site24x7 Server Monitoring is recommended for a broad range of industries and experience levels. It is suitable for IT professionals and organizations in sectors such as e-commerce, finance, healthcare, and any business reliant on online services.
It caters to both experienced IT experts looking for a comprehensive monitoring solution and those with limited experience seeking a user-friendly tool to ensure the uninterrupted availability of their online services.
Site24x7 Infrastructure costs $9 per month when paid annually. For more information and access to a 30-day free trial of Site24x7 Infrastructure, see:
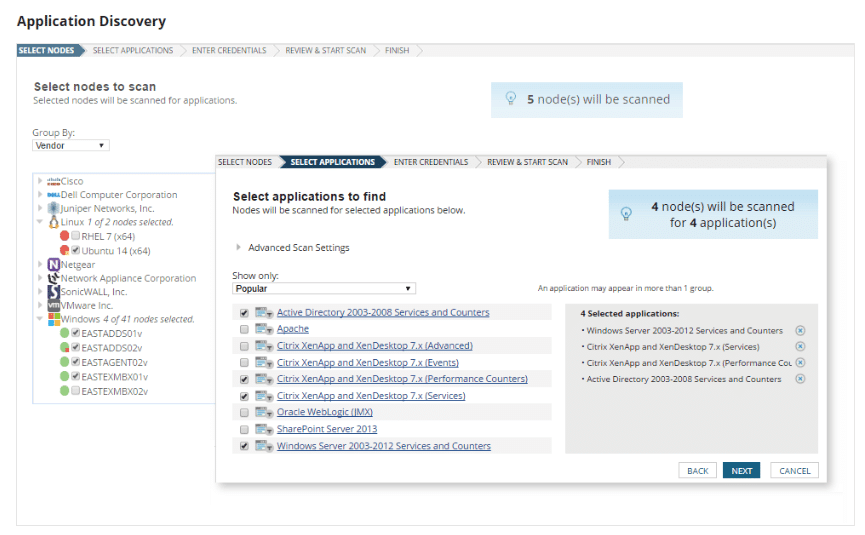
4. ManageEngine OpManager – FREE TRIAL
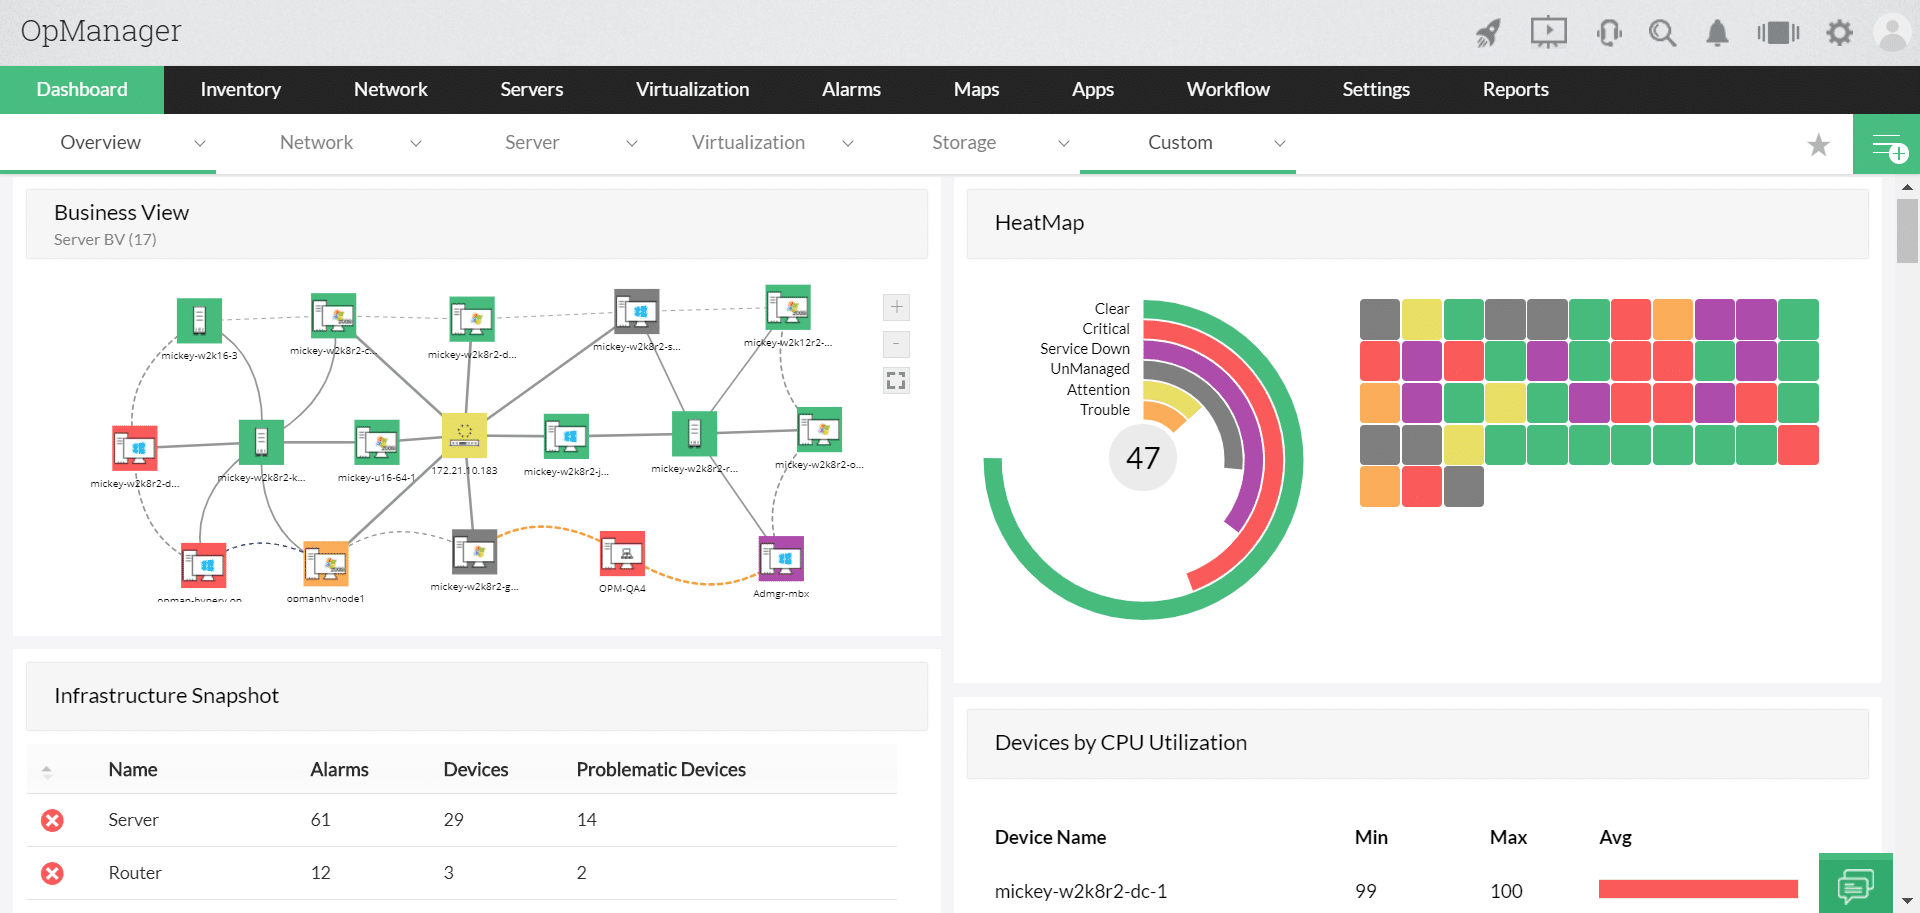
ManageEngine OpManager is a well-known monitoring platform that is trusted by many organizations all over the world. It offers support for a wide array of vendors and across multiple platforms.
Important Features
- Server monitor capabilities in real-time
- System availability, System Health, and real-time monitoring
- Proactive monitoring and Configurable Warning Limits
- Application and URL Monitoring
- Virtual Environment monitoring
- Microsoft Windows Service Monitoring
- Server Operations Monitoring
Why do we recommend it?
While we were evaluating the ManageEngine OpManager, it showed signs of server performance degradation. It identified and helped us solve a memory leak in one of our servers, which was causing intermittent slowdowns and impacting application responsiveness.
Hardware and software is managed from this platform and it allows you to see the current state of your hardware health and software licensing at a glance.
Servers are monitored with SNMP and WMI protocols which lets you see exactly what is happening with your equipment over the network. Important issues such as CPU usage, memory allocation and hard drive space are all available and are monitored with this system.
You can also monitor scripts and URLs for even greater visibility.
Who is it recommended for?
ManageEngine OpManager’s versatility and comprehensive network monitoring capabilities make it adaptable to diverse sectors where maintaining optimal network performance. It can benefit a wide range of industries, including finance, healthcare, e-commerce, manufacturing, and telecommunications.
OpManager is essential for telecom companies to monitor their network infrastructure, ensuring that voice and data services are consistently available and responsive.
For online retailers, OpManager helps monitor website performance, ensuring that e-commerce platforms remain responsive during high-traffic periods.
It can also detect and resolve issues impacting customer experience and sales.
Pricing information can be found by requesting a quote when you register for the 30-day free trial.
5. ManageEngine OpManager Nexus – FREE TRIAL

ManageEngine OpManager Nexus, formerly OpManager Plus, provides full-stack visibility by correlating server performance with application behavior, bandwidth use, storage availability, security incidents, and more. Together, these metrics help understand the root cause faster.
Why do we recommend it?
We recommend OpManager Nexus for its comprehensive monitoring of all relevant metrics, like CPU and memory usage, that can provide detailed information about the performance and utilization rates of your servers. Moreover, it can gather information about your hardware devices, like fan temperature, cooling system performance, and more. When all this information is correlated, you can better understand the state of your infrastructure and plan accordingly.
There are many features that we love in OpManager Nexus. Firstly, it monitors multiple types of servers through a unified console. This reduces tool sprawl and provides correlated insights into your server performance. Also, it monitors continuously using ICMP, SNMP, TCP, and WMI protocols to ensure wider coverage of all devices. Such detailed monitoring makes it ideal for almost any environment.
Another key aspect is the alerts. When the analyzed values are outside the established threshold limits, OpManager sends alerts across multiple channels.
Who is it recommended for?
It is recommended for large organizations with thousands of physical and virtual servers. It is also a good choice for organizations with mixed environments, comprising IT and IoT devices.
OpManager Nexus starts at $1,233 for 50 devices under the Professional edition and $19,995 for 1000 devices under the Enterprise edition. Start a 30-day free trial.
6. Nagios XI

Nagios is an excellent all-round monitoring solution that gives you visibility for Windows servers, Linux, Unix, Solaris, MAC OS, and many other operating systems.
Why do we recommend it?
We dug deep into Nagios XI’s functionality to resolve issues involving our email server performance. It detected an escalating load on the email server during peak hours, leading to delayed email delivery and potential data loss. Nagios XI’s timely alert enabled us to optimize server resources, ensuring prompt email delivery and minimizing disruptions to our communication channels.
Some of its capabilities include:
- More than just servers. Nagios is a comprehensive IT monitoring solution
- The web interface can be tailored to your exact requirements
- Monitor key servers
- User friendly with very easy learning curve
- Resource planning
- Notifications and alert functionality
It is a versatile monitoring application suite that can monitor and watch servers in an agentless, or agent configuration. The system covers all of the most common monitoring scenarios, but there are always edge cases.
Nagios has over 3500 different addons that will give you even greater flexibility for you monitoring requirements.
Who is it recommended for?
While beginners may find it challenging initially, with its extensive capabilities, it is particularly well-suited for IT experts and network administrators experienced in server and network management.
Nagios XI is recommended for IT professionals and organizations in various industries seeking robust infrastructure monitoring capabilities. It can benefit both large and small organizations, as its scalability allows it to accommodate the needs of different-sized networks.
Agencies such as the government can use Nagios XI to monitor critical systems and services, ensuring uninterrupted public services.
Nagios comes in a standard edition starting at $1,995 and an enterprise edition starting at $3,495. Licensing is based on the number of nodes you have, each device with an IP address is considered a node and requires a license. To learn more about this awesome monitoring solution check out their website here.
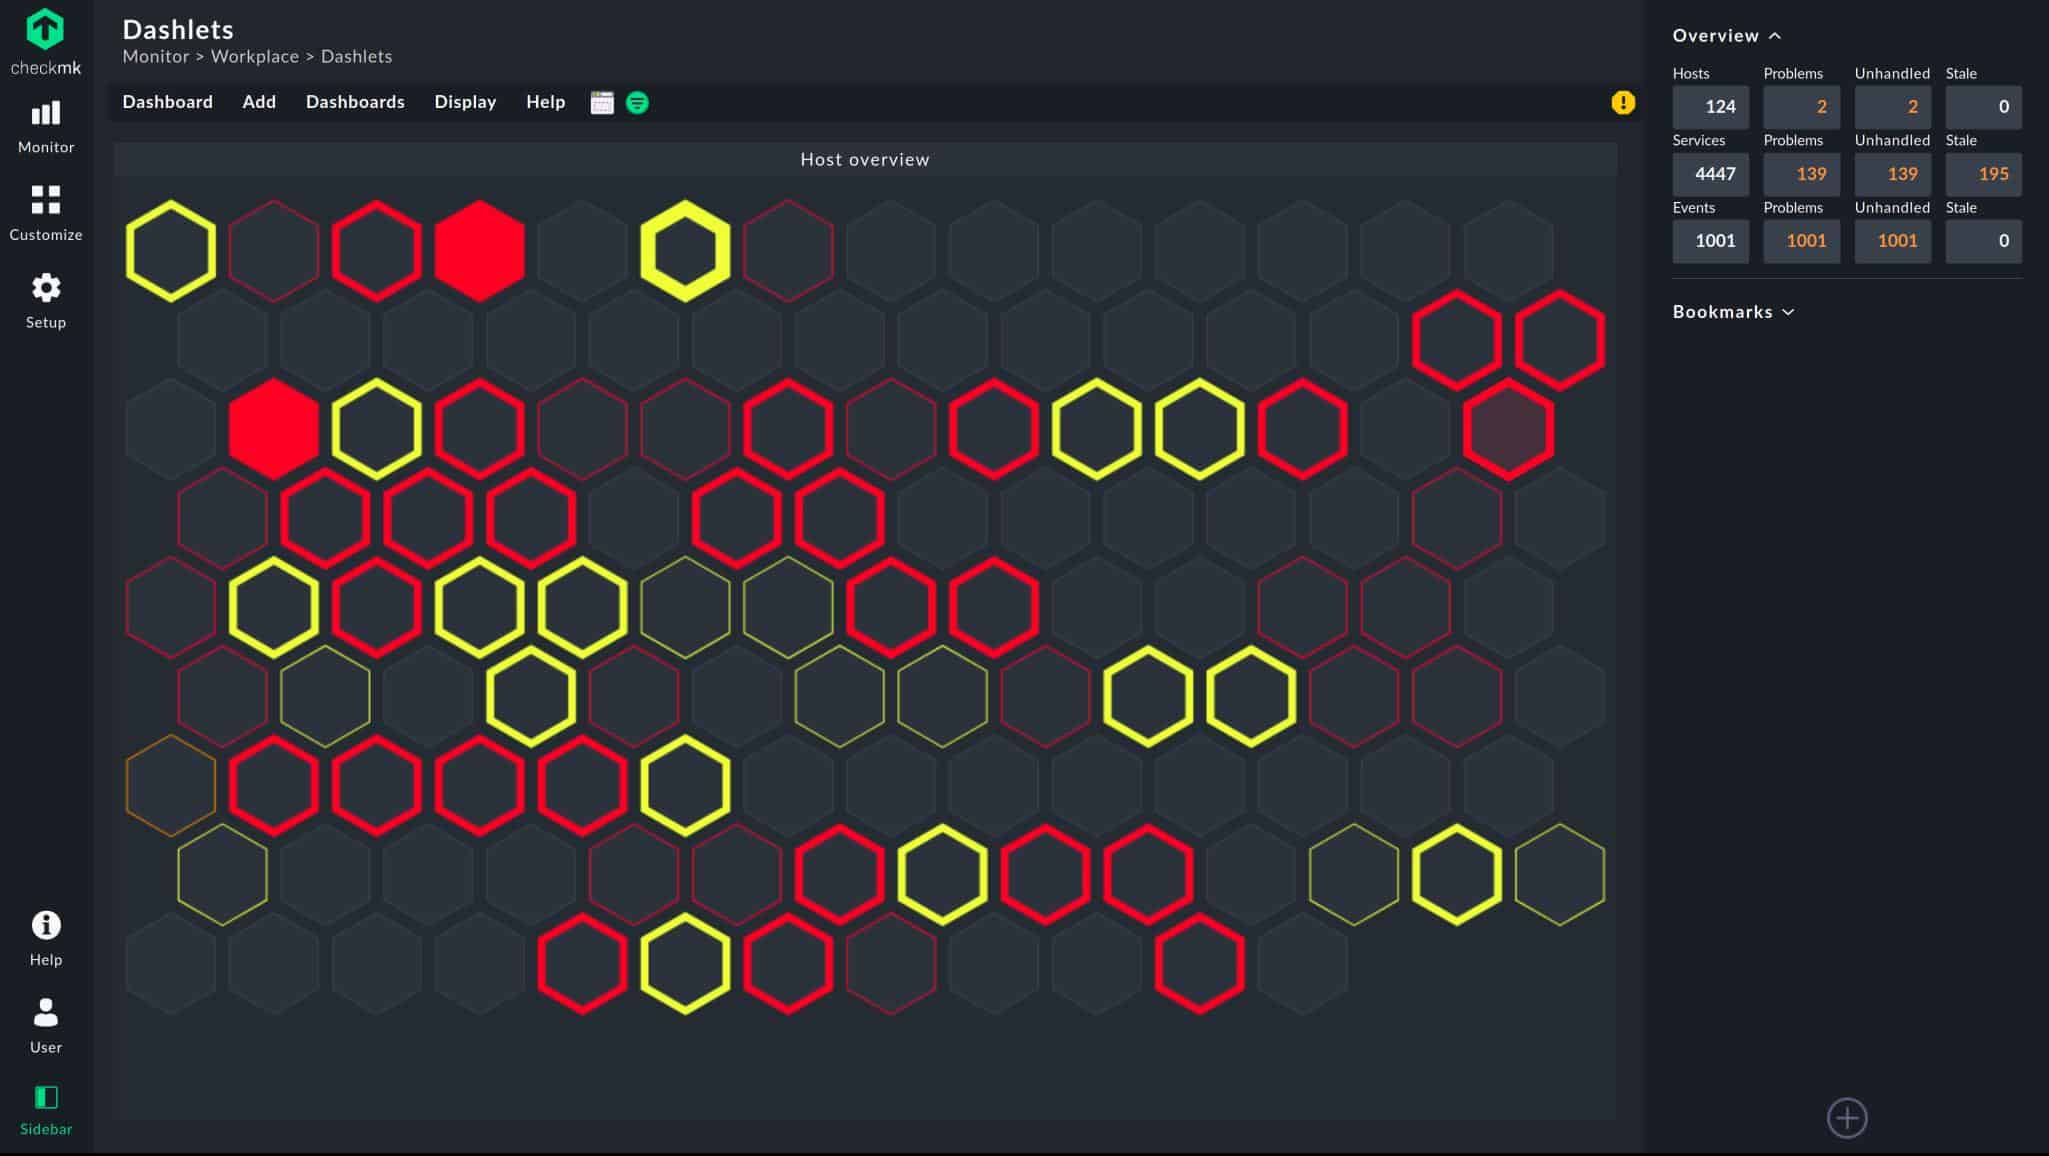
7. Checkmk
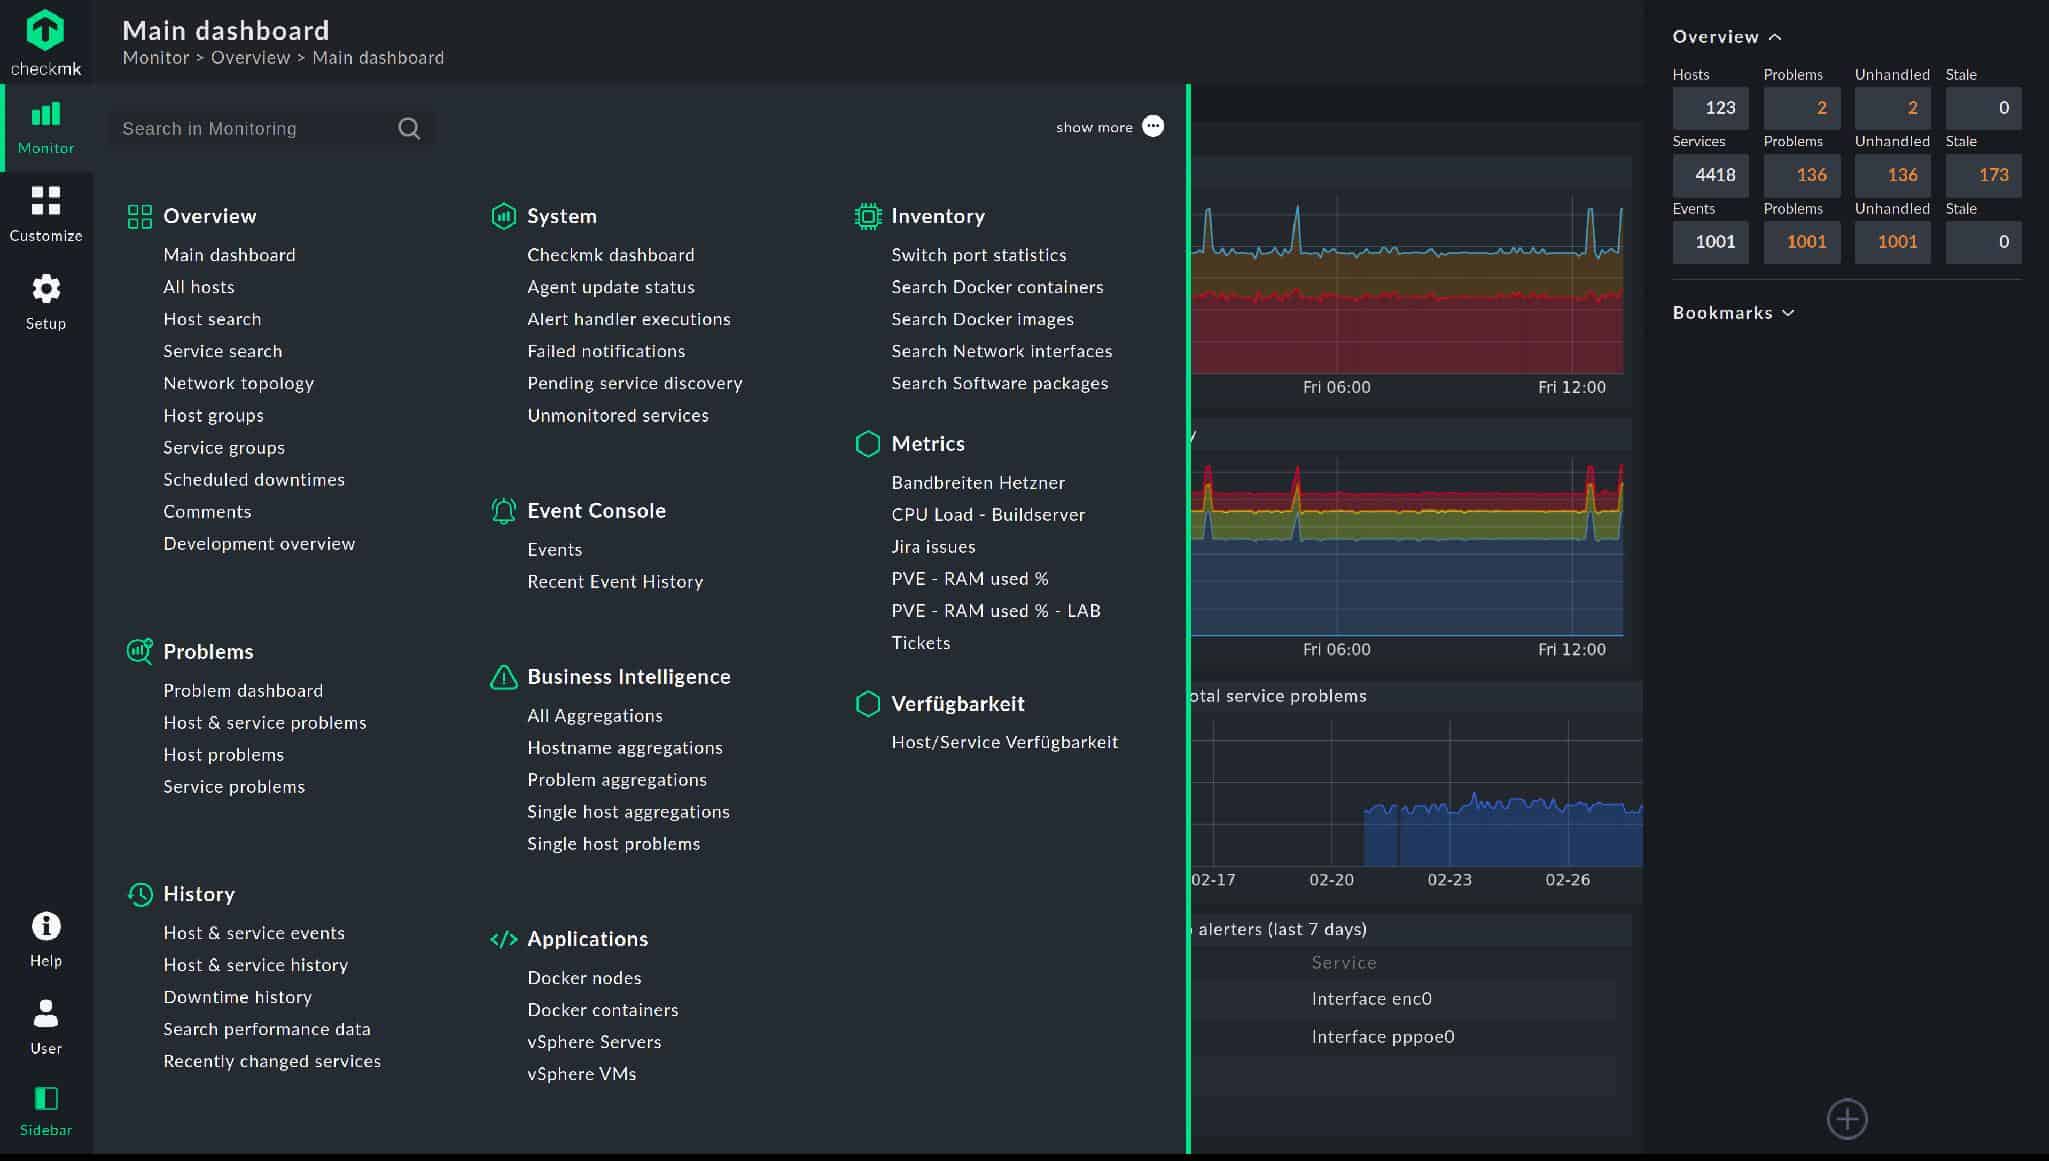
Checkmk is an infrastructure monitoring package. It monitors networks, servers, and applications. It is able to monitor servers on-premises, on remote sites, and also Cloud services. This software package installs on Linux. However, it isn’t limited to monitoring the host machine. It can monitor servers with other monitoring systems over a network. Those monitored servers can be running Windows Server, Linux, macOS, and BSD Unix.
Some of the server monitoring capabilities of Checkmk include:
- The ability to monitor all IT assets, not just servers.
- Autodiscovery that enrolls all encountered devices connected to the network, including servers.
- A software and services scanning system that automatically registers those assets for monitoring.
- Plug-ins to expand capabilities for monitoring specific applications.
- Constant live monitoring of CPU, memory, disk, and network interface capacity and utilization.
- Root cause analysis support.
- Customizable screens and performance alerts.
Why do we recommend it?
Our team devoted time to test the Checkmk and it saved us time in identifying an issue where network latency sporadically increased during peak usage hours. It pinpointed the source of the latency to a specific network switch, enabling us to promptly address the problem, reconfigure network traffic, and ensure smooth performance during high-demand periods.
There is no limit to the number of servers that this package will monitor, except for the Enterprise Free edition, which has a limit of 25 hosts. There is another free edition, called Raw, which is based on Nagios Core. That doesn’t have any limit on the number of servers that it will monitor.
Who is it recommended for?
It’s designed to cater to users with varying levels of expertise. Beginners can start with the basics and gradually learn advanced features, while experts can leverage its extensive capabilities for in-depth network monitoring.
Checkmk can benefit both large and small organizations due to its scalability and adaptability to different network sizes.
Media companies use Checkmk to monitor content delivery networks and streaming services, guaranteeing uninterrupted content access for viewers.
Healthcare providers rely on Checkmk to monitor medical systems, ensuring the continuous availability of patient records and medical devices, which is crucial for patient care.
As well as the free Raw edition and the Enterprise Free edition, Checkmk is offeres the Enterprise Standard edition for corporate systems and the Enterprise Managed Services edition for managed service providers. The system is charged in Euros for an annual license. The Enterprise Standard edition price starts at 600 Euros and the Enterprise Managed services edition price starts at 1,200 Euros. You can access a free trial download.
8. SolarWinds Systems Management Bundle
The SolarWinds Systems Management Bundle consists of four specialized tools that work together to give you a better idea of the current state of your server hardware and applications.
Why do we recommend it?
Using SolarWinds Systems Management Bundle, we detected a persistent high CPU load during peak traffic hours, which we were unaware of before using the tool. This issue was leading to slower response times and occasional website unavailability for our users, negatively impacting their experience. We recommend SolarWinds Systems Management Bundle because it not only identified this critical problem but also enabled us to optimize our server resources and significantly enhance our website’s performance and reliability.
Each tool of the Systems Management Bundle from SolarWinds contains its own set of health and status monitors for multiple vendors and manufacturers. Each tool also has hundreds of monitors for some of the most common applications such as SQL server, VMWare, Active Directory, Office 365 and many more of the apps that organizations need to get work done.
Server and Application Monitor – With this software you have the ability to both monitor your hardware and track your assets. It has the ability to monitor the CPU and memory usage of your servers, as well as other important metrics such as hard drive space, network utilization and a host of other important metrics. If you have virtual assets in your environment then you can also use these tools to monitor key stats from your VMWare and Hyper-V hosts, as well as all of the virtual machines that are associated with them. To help you get started you can select one of the over 1200 monitoring templates while you fine tune your own.
Virtualization Manager – The virtualization manager tool allows you to deep dive into the monitoring and performance of your virtual environments, as well as the capacity planning and optimization plans for it. These environments include support for VMware, Hyper-V and even Nutanix. One of the best features of this particular application is the ability to monitor virtual hard disks and receive alerts when there are breaches in your thresholds. It helps with maintaining diskspace as well.
Storage Resource Monitor – The Storage Resource Monitor is another great feature that allows you to view and access the performance and capacity of your storage devices. It gives you a centralized location from where you can view and monitor storage related issues and devices. It is compatible with most devices such as SANs, NAS types, and vendor support for HP, DELL EMC, NetApp, Pure Storage and many more.
Web Performance Monitor – Most organizations have web performance monitoring requirements. This tool tracks and tests things such as user experience as well as testing web transactions. It works on both internal and external sites. The tool is quick and will help you to quickly spot the failure on the website supporting components such as the server itself, the hardware, an even the database.
Who is it recommended for?
We recommend the SolarWinds Systems Management Bundle for IT professionals and organizations responsible for managing complex IT infrastructures, including servers, applications, and network resources.
It’s particularly well-suited for medium to large enterprises seeking a comprehensive and centralized solution to monitor, analyze, and optimize their IT environments.
Additionally, businesses looking to proactively manage server performance, prevent downtime, and ensure a seamless user experience on their websites would greatly benefit from this bundle.
All of the information that you need is available in one location, so you don’t need to use more software than this single application.
Download trial FREE for 30 Days and Start Monitoring Today!
9. CPUID HWMonitor
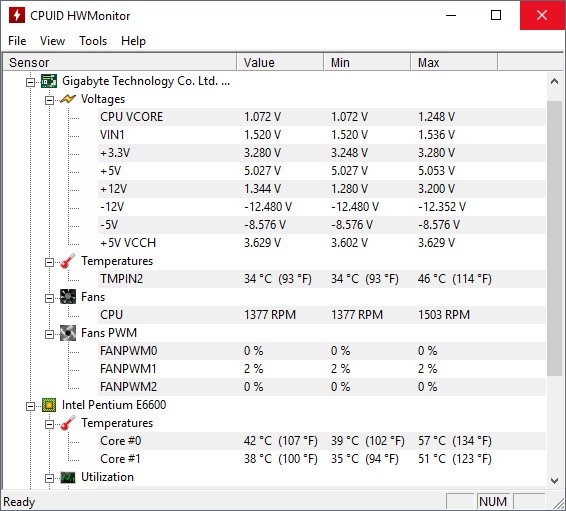
HWMonitor is intended as a single PC HW monitor that gives you quick yet detailed information about a system, all from one application form.
Why do we recommend it?
Our team conducted extensive testing and observed how HWMonitor addressed a critical overheating issue in our server room. It provided real-time temperature monitoring, allowing us to detect an overheating server, take immediate action to resolve it, and prevent any potential hardware damage and downtime.
The great thing about this app is the fact that you can interrogate most common motherboard, CPU and graphics card sensors with very little problems. HWMonitor also allows you to monitor system temperatures, system fan RPM and CPU usage.
HWMonitor is a freeware application but has limited functionality when compared to the professional version. The pro version has some remote monitoring functionality, but this is quite limited when compared to the other monitoring applications in our round up.
It also allows you to save your results too, which is quite useful. This application should be thought of as a single PC monitoring system, and not necessarily as an enterprise grade monitoring solution.
Who is it recommended for?
HWMonitor is a versatile tool that benefits anyone who wants to monitor their system’s hardware health, maintain efficiency, and prevent overheating-related issues.
HWMonitor provides real-time monitoring of critical hardware parameters, such as CPU and GPU temperatures, fan speeds, and voltages, ensuring the stability and longevity of your components.
Gamers can use HWMonitor to monitor their system’s performance during gameplay, ensuring that temperatures stay within safe ranges and maintaining a smooth gaming experience.
Overclockers can use HWMonitor to keep an eye on temperatures and voltages while pushing their hardware to its limits, helping them achieve optimal performance without overheating.
Pricing starts at around $20 for the paid for version.
10. SysGuage
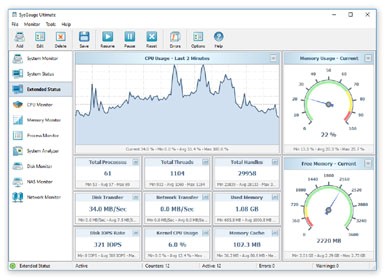
SysGauge is a hardware monitor for local, remote and networked computers. The system is easy to use and is very intuitive. It provides visibility on CPU utilization, system memory, free space, hard drive performance, as well as other important hard disk information.
Why do we recommend it?
During our hands-on evaluation, SysGauge alerted us of a storage space management issue. It provided real-time insights into disk usage, enabling us to take action by identifying and offloading unnecessary or large files, optimizing storage allocation, and then adding additional storage resources as needed.
The SysGauge interface is customizable, and allows you to monitor single tasks, or to look at multiple processes from one machine. It does not allow you to view multiple statistics from more than one server at a time. As a result, this application is best suited to individual systems or very small operations. For a quick view of your computer’s system resources this is a decent tool, but it is not great for monitoring an entire server room.
Who is it recommended for?
Even users with limited experience can quickly become proficient with SysGauge due to its user-friendly design.
Familiarity with storage terminology such as disk space, partitions, file systems, and data backups will enhance the user’s ability to interpret SysGauge’s storage-related data and alerts.
Small business owners can use it to manage their local storage efficiently, ensuring that storage bottlenecks do not disrupt business operations.
For instance, photographers, videographers, and graphic designers can monitor their creative work storage. By keeping an eye on available storage space, they can prevent the loss of valuable media files and maintain an efficient workflow. Whilst data center managers can use SysGauge to oversee storage resources, optimize allocation, and ensure data center efficiency.
SysGuage has a free version that supports up to 10 monitors, while the Professional version is $50 and has 50 monitors. The Ultimate Version costs $125 and has 100 monitors. Then finally there is a server version which is $125 and allows for up to 200 monitors. If you would like to learn more about this application then be sure to check out its website here.
11. Zabbix
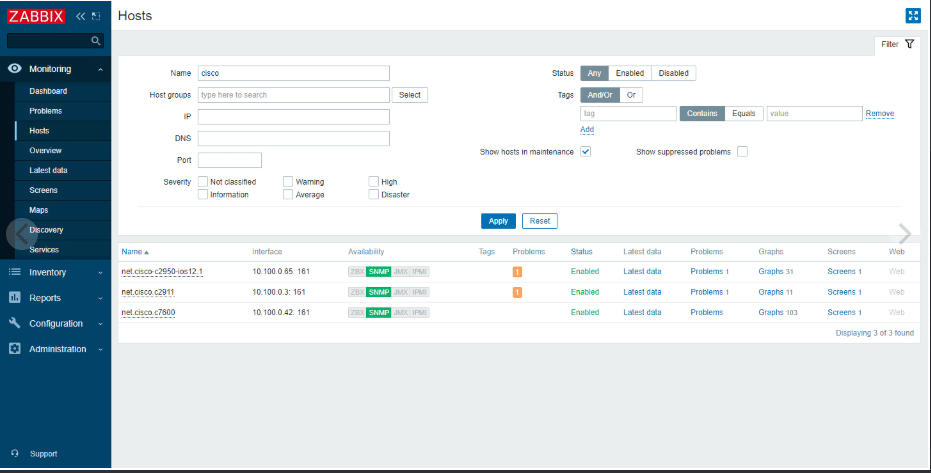
Zabbix is another IT infrastructure monitoring solution for us to look at today. It has the ability to monitor server performance and change management, such as hardware and software.
Zabbix Capabilities
- Preconfigured templates available
- Auto discovery
- Uptime reports
- Alerting
- Change management
Why do we recommend it?
We immersed ourselves in using Zabbix to deal with a network bandwidth congestion issue. It helped identify a sudden surge in network traffic during a critical video conference, causing network slowdowns.
With Zabbix’s real-time monitoring and alerting, we swiftly identified the source of the traffic, optimized network resources, and ensured uninterrupted video conferencing, enhancing our team’s productivity.
Who is it recommended for?
Zabbix is compatible with Fedora, CentOS, Oracle Linux, Ubuntu, Debian, SUSE and Raspbian. There is no Windows compatibility at present.
It is the go-to choice for IT departments, network administrators, system administrators, data centers, managed service providers, cloud service providers, telecommunications companies, educational institutions, healthcare providers, and manufacturing companies.
Novices with basic IT knowledge can perform essential monitoring tasks, while those with system administration and network management experience will find it easier to set up and fine-tune the platform for their environment. Users with scripting, database, and in-depth IT infrastructure knowledge can leverage Zabbix’s advanced capabilities for further customization and optimization.
It is a good alternative to some of the more expensive offerings that we have looked at so far. The only cost will be getting the skilled labor involved to set it up and get it working correctly.
Both free and opens-source, if you would like to try it out for yourself then be sure to visit their website here.
Hardware Monitoring in an Enterprise Environment
We have put together a list of capabilities that are useful for monitoring infrastructure and server hardware in an enterprise environment. In most enterprise operations it is utterly essential to monitor and watch how the hardware, software, databases, virtual machines, websites, and much more, are operating. You need to have critical alerts that warn you when there are outages, reports to gauge overall performance, and other visibility enabling features.
If you are looking to get your own monitoring solution set up then you should strongly consider some of the following features as being part of your next setup.
1. CPU Utilization Monitoring
![]()
Your production servers need to be watched at all times, especially during peak times for your business.
For the most part you can rely on a Windows or Linux server to perform nominally, but the sad reality is that there are times when a rogue process or application can hog too much of the CPU’s valuable processor time.
Your next monitoring solution should have the ability to warn you when your processor breaches a predefined threshold.
2. Memory Utilization
Memory usage is just as important as CPU usage.
In a monitoring application you must have the ability to look at not only the available memory on each individual server, but also the memory usage of your virtual machines. Just as important is the virtual hosts in your virtual environment.
Memory usage is critical to supplying virtual servers, so being aware of the current state of memory allocation is very important.
3. Storage and Disk Monitoring
![]()
Your company data is important to keeping operations running, and when you run out of disk space, you run into a multitude of serious issues. Not only are you unable to save and update your work, but applications and programs will soon stop working too.
A modern computer system relies heavily on hard drive space, and when you run low, or run out, then your system is likely to fail.
Your monitoring solution must be able to alert you when specific hard disks run low or run out of space.
Once you have been alerted you can take action and get to work right away by clearing old backups, log files and user files that are taking up critical and valuable space on your servers’ hard drives.
4. Monitor Bandwidth utilization

Your company relies on the availability of bandwidth to communicate with the rest of the world.
If your internet is being hijacked by rogue applications on your network, or abused by disgruntled employees, then you need to be able to find out what is using it.
Most modern bandwidth utilization applications can tell you which applications are using the internet, which ports are open and using data, which network interfaces are most active, and which IPs on your network are using the most resources.
5. Historical Performance Logs
 Historical Performance Logs help you to paint a picture and a timeline of events during an investigation.
User computers and servers both store a multitude of logs that reveal important information about the current state of the machine by investigating the log files leading up to the current issue.
Some of these applications can compile the information found in these historical log files and generate graphs and other visualization tools.
6. Alerts and Notifications
 Dashboards are great, as are real-time graphs, but there is more to life than just staring at your monitoring screens. You need to be alerted to issues as soon as they are identified by your system.
The notifications can be emails, automated voice calls to your mobile phone, and even text messages.
The messages can contain information such as severity levels, fault descriptions, error information, and anything else that you would find important.
7. Customized dashboard
Your dashboard requirements will be different to the next person’s, depending on what you need to keep an eye on.
That is why it is great to have a monitoring solution that comes with prebuilt dashboards.
You can all have access to the same information right out of the gates, but then you can customize your own so that your specific issues can be detected very easily.
8. Monitor Services and Processes
 You don’t want to monitor the current state of services and processes of every single computer and server on your network manually.
The time and effort that it would take for you to log onto each remote system would take up almost all of your time. You should have the ability to monitor all of the systems that need attention from a single source. This is a way more efficient way of monitoring your systems and ultimately leads to greater efficiencies.
9. Reporting and Inventory
When it comes time to forecast for your department’s budget, or when you need to show your manager how the resource planning and allocations are going it is important to have a proper reporting system.
You will need to create reports that are easy to read and informative without being too data-intensive.
Executive summaries are very important for the upper management structures that need to be made aware of certain IT-related issues.
10. Server Uptime and Availability
 This is a very important feature, and it is arguably one of the most important features that any monitoring software suite could have.
Staying online and keeping the business running is your core mission, so choosing a piece of software that can help you to achieve this is the right way to go.