
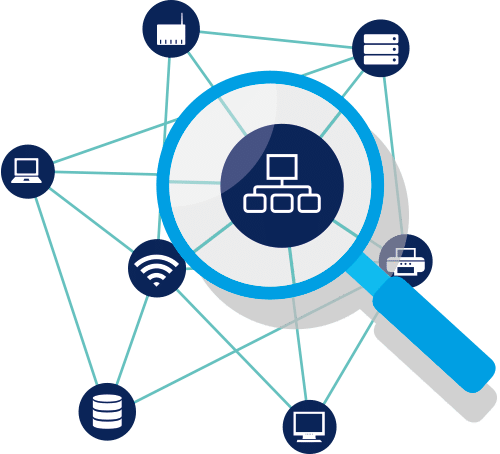
A network traffic analyzer is a critical piece of software that is designed to perform a few specific functions on your network. It acts as a packet analyzer and sniffer that works in both a troubleshooting, monitoring, and investigative tool. This makes it essential in any technical department that handles the monitoring and maintenance of networking equipment, where it is necessary to ensure uptime.
Not all tools have been created with the exact same objectives in mind, so it is necessary to really dive into the basics about what each one is purported to do. There is also the fact that there is more than one subtype of traffic analyzer. There are some applications that concentrate on individual packet inspection, others that focus on protocol analysis, and others that have a macro view of the overall traffic flow of the network. With this in mind, we will be looking at the basic functionality of each of the applications in our list of traffic analyzers.
Here is our list of the best network traffic analyzer tools:
- Progress WhatsUp Gold – EDITOR’S CHOICE A cloud-based platform that provides real-time visibility into network traffic to detect and analyze issues and improve performance. Start a 30-day free trial.
- Site24x7 Network Traffic Monitoring – FREE TRIAL A cloud-based system that includes full infrastructure and application monitoring. Access a 30-day free trial.
- ManageEngine NetFlow Analyzer – FREE TRIAL An on-premises monitoring package for networks that issues alerts if capacity exhaustion looks likely. Available for Windows Server and Linux. Download a 30-day free trial.
- ManageEngine EventLog Analyzer – FREE TRIAL Analyzes traffic and logs from different devices in your network to provide information about bandwidth usage, traffic patterns, and more. Start a 30-day free trial.
- Paessler PRTG A collection of network, server, and application monitors that includes traffic capacity sensors. Runs on Windows Server.
- Nagios Network Analyzer A network monitor for traffic that is part of a package of system monitoring tools that can be expanded by plug-ins. Runs on Linux or on Windows over VMWare.
- SolarWinds NetFlow Traffic Analyzer This tool queries network devices to retrieve traffic flow information and raises alerts if capacity is approached. Runs on Windows Server.
Some of the applications that we will be looking at will have a main function that they perform, such as monitoring and managing IT devices, while others will focus on alerting systems and troubleshooting. Many of the applications in our software round-up will fall into a little bit of all of these categories, so we need to be mindful of which features you really want to adopt into your own network environment.
The Best Network Analyzer Tools
1. Progress WhatsUp Gold – FREE TRIAL
WhatsUp Gold offers real-time visibility into network traffic patterns to help understand the status, uptime, health, and usage levels of IT resources like servers and network components. Using this information, network engineers can understand issues and improve the speed and response of their networks.
Why do we recommend it?
In our extensive testing, we found that WhatsUp Gold can analyze network performance across all networks, including hybrid clouds. It collects network traffic and bandwidth usage data from different devices using network flow protocols like jFlow, sFlow, IPFIX, and NetFlow. Next, it analyzes this data and compares the metrics against established thresholds. In case of deviations, it sends alerts to the IT team, so they can proactively fix the problems. It also tracks real-time user experience and provides the insights needed to improve application performance.
Additionally, it also analyzes historical data to provide trends and patterns over a longer time, so you can make informed decisions for capacity planning. Its reports are elaborate and make it easy for you to drill down into the sources and destinations of your traffic, the applications consuming high bandwidth levels, and usage by devices or users. With such information, you take the necessary steps to ensure that your business-critical applications have the bandwidth they need for smooth functioning.
Who is it recommended for?
WhatsUp Gold is a good choice for organizations that use hybrid cloud environments. It also works well for MSPs who have to manage, troubleshoot, and improve the performance of their clients’ networks.
Pricing: You can choose from the perpetual and subscription-based models. Perpetual licensing comes in two editions – Total Plus and Premium, while subscription models come in four editions – Business, Enterprise, Enterprise Plus, and Enterprise Scale. Start a 30-day free trial.
EDITOR'S CHOICE
WhatsUp Gold is the top choice on our list of network traffic analyzer tools because it is comprehensive and provides all the detailed insights you need to troubleshoot issues, check the health and availability of your network devices, and improve your network’s performance. It gathers data from different devices using network protocols and analyzes them to provide pertinent insights. What we found is that these insights are largely accurate and detailed, so you can easily find what you’re looking for. It also generates alerts when metrics deviate from the predefined thresholds, enabling your team to stay on top of issues. For these reasons, WhatsUp Gold is the editor’s choice.
Download: Get a 30-day FREE trial
Official Site: https://www.whatsupgold.com/
OS: Windows Server 2012 or later
2. Site24x7 Network Traffic Monitoring – FREE TRIAL
Site24x7 is a cloud platform of monitoring services and it includes a network traffic monitoring unit. This tool uses special protocols to communicate with network devices, such as switches, routers, firewalls, and wireless APs.
Why do we recommend it?
In our testing phase, Site24x7 Network Traffic Monitoring efficiently communicated with diverse network devices, offering insights into live traffic levels, packet types, and QoS data for VoIP traffic. The cloud-based dashboard, coupled with threshold-triggered alerts, provided a seamless experience in monitoring and managing our network traffic.
A number of device manufacturers have created languages that enable monitoring tools to communicate with them and query statistics. These include NetFlow from Cisco Systems, J-Flow from Juniper Networks, AppFlow from Citrix, and NetStream from Huawei. There are also a number of non-proprietary protocols that other manufacturers deploy, including sFlow, cflow, and IPFIX. Site24x7 can communicate through all of these systems, which gives it the ability to monitor multi-vendor environments.
The statistics drawn from devices with these languages enable Site24x7 to identify the capacity of each interface on each device and see the ongoing throughput levels on them. Thus, Site24x7 is able to report on live traffic levels on each stretch of the network.
The dashboard can segment traffic information by packet type, identifying the application and protocol for each. With this data segmentation, the monitor is able to report on the top 10 traffic generators, including flows in and out of the network. The service is also able to display QoS data for VoIP traffic.
The system places thresholds on each of the metrics that it gathers. These trigger alerts when crossed. You can set up the system to forward these alerts to key personnel via email, SMS, push notification, voice call, or RSS feed. The dashboard can be viewed from mobile apps for Android and iOS.
The alert thresholds are set at levels that give you time to take evasive action. You can adjust those levels manually, and it is also possible to create composite alerts based on multiple metrics.
The Site24x7 dashboard is based in the cloud, so it can be accessed from any standard Web browser. All of the processing for each screen is performed on the Site24x7 server, and the metrics are saved there, too. The cloud location of the monitor means that it is able to supervise multiple LANs in the same account.
The system needs to install an agent on your system in order to collect data. This download is managed by the dashboard during the account creation process. The movement of data between the agent and the server is protected by encryption.
The system can monitor the performance of connections across the internet to cloud resources and also between sites. The full network monitoring package also includes performance monitoring that queries device statuses with the Simple Network Management Protocol (SNMP).
Site24x7 is bundled into packages that include network monitoring as well as server and application monitoring. The bundles also include website monitoring services with both real user monitoring and synthetic monitoring tools. There are many bundles available for Site24x7 and each has a different pricing structure. All of the plans are charged for by subscription, which is levied annually by expressed as a price per month.
Who is it recommended for?
Site24x7 is suitable for businesses of all sizes, offering flexibility in monitoring multi-vendor environments. Its ease of use makes it accessible for beginners, and the ability to set alert thresholds ensures timely responses. The pricing structure caters to small businesses while providing scalability for larger enterprises.
Site24x7’s cloud-based monitoring is ideal for e-commerce businesses, ensuring optimal website performance and user experience. In the manufacturing sector, it assists in monitoring and optimizing the network infrastructure supporting production processes. For service-oriented businesses, such as consulting firms, it ensures reliable and efficient communication channels.
Pricing: All of the plans are available for a 30-day free trial. They are priced at a level that is suitable for small businesses with extra capacity available for an extra charge. The monthly subscription rate for Site24x7 starts at $9 per month.
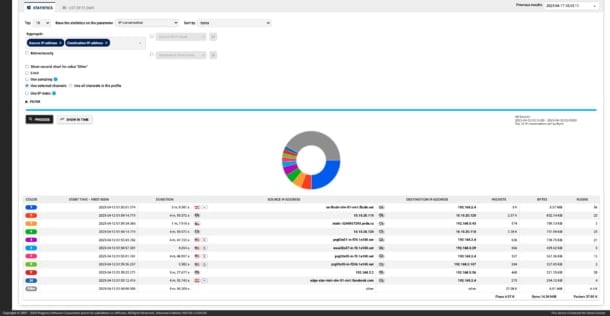
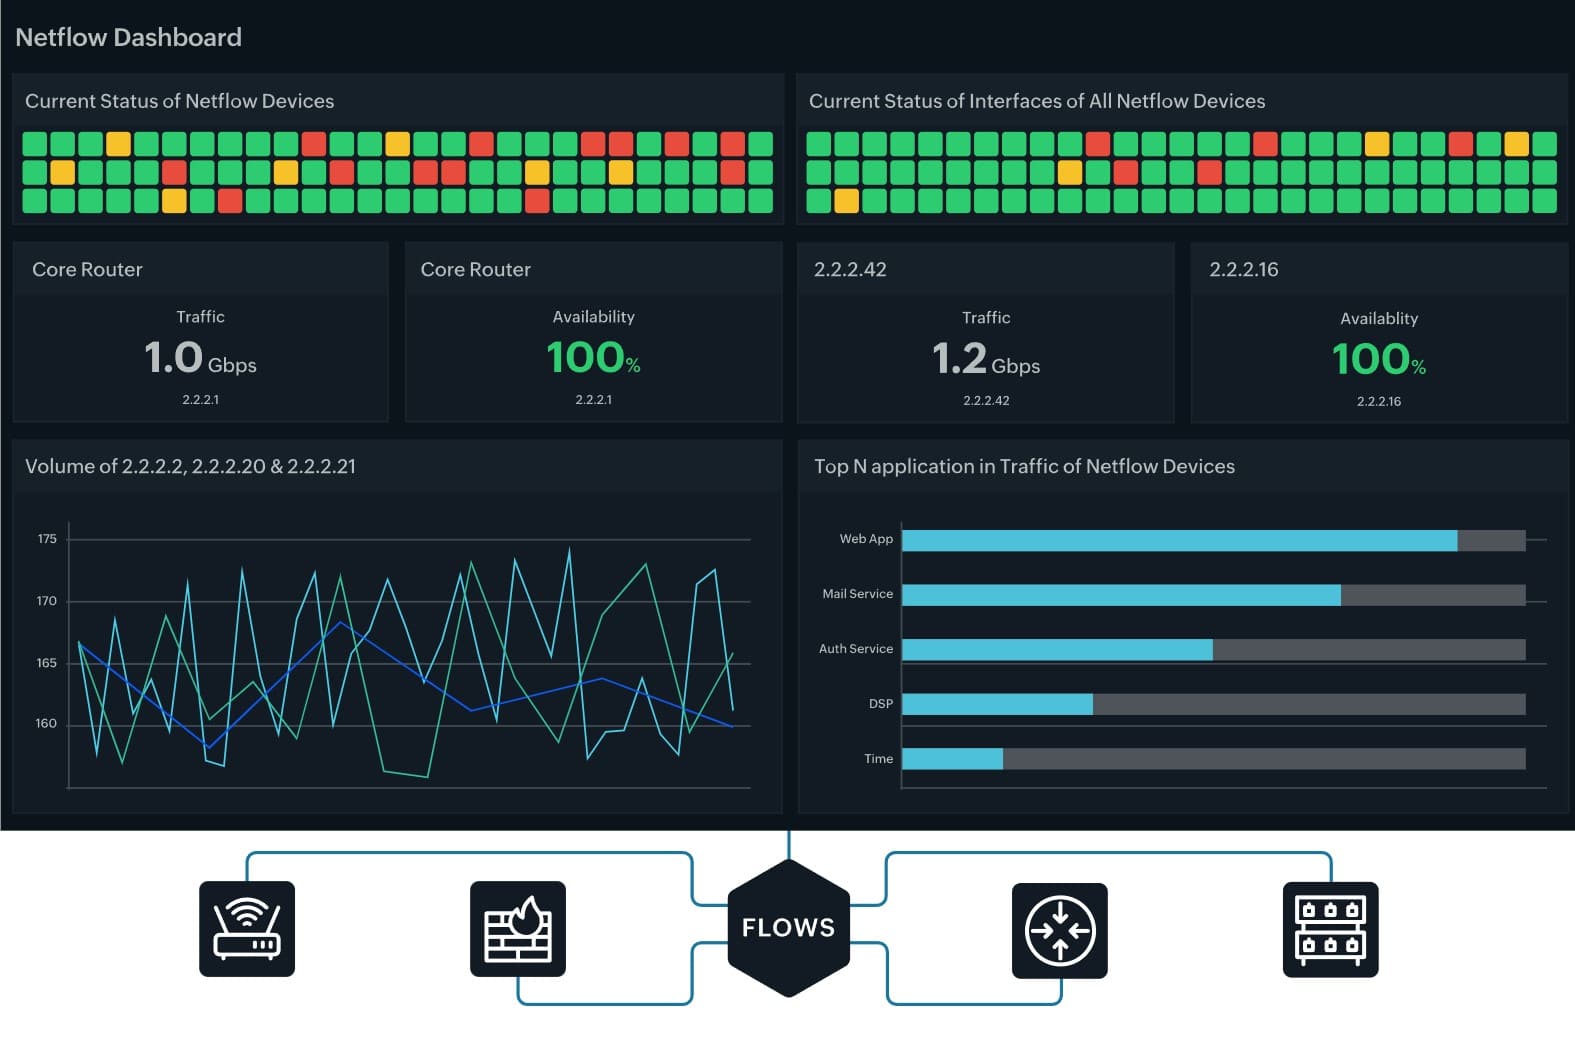
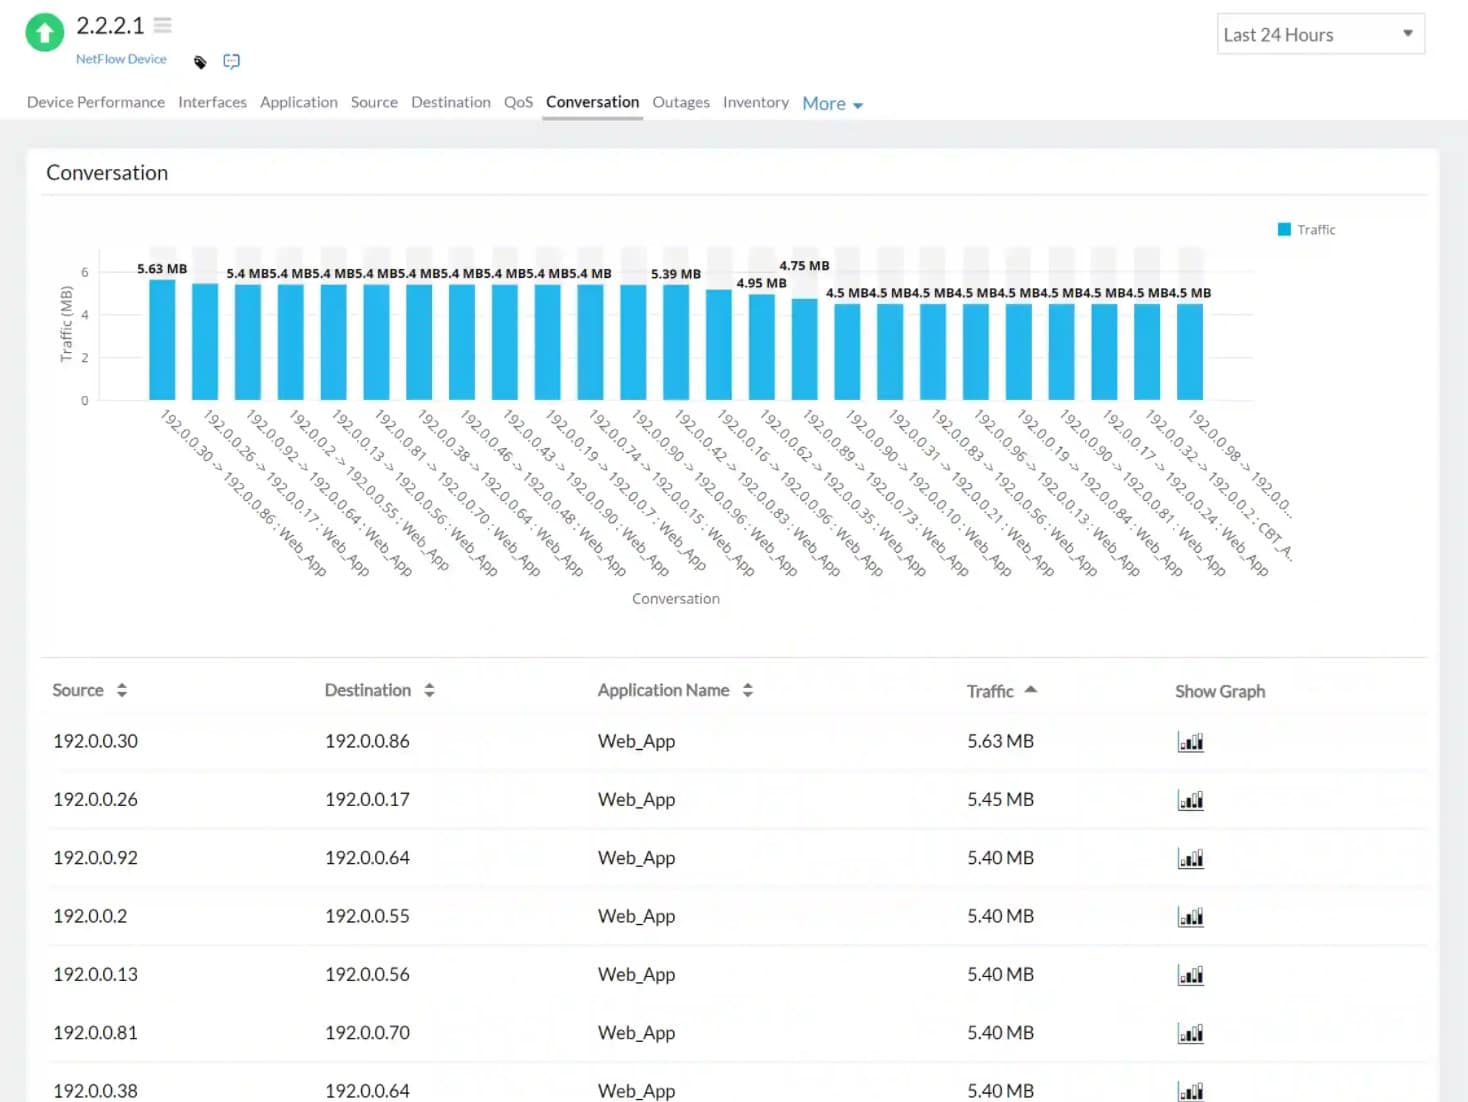
3. ManageEngine NetFlow Analyzer – FREE TRIAL
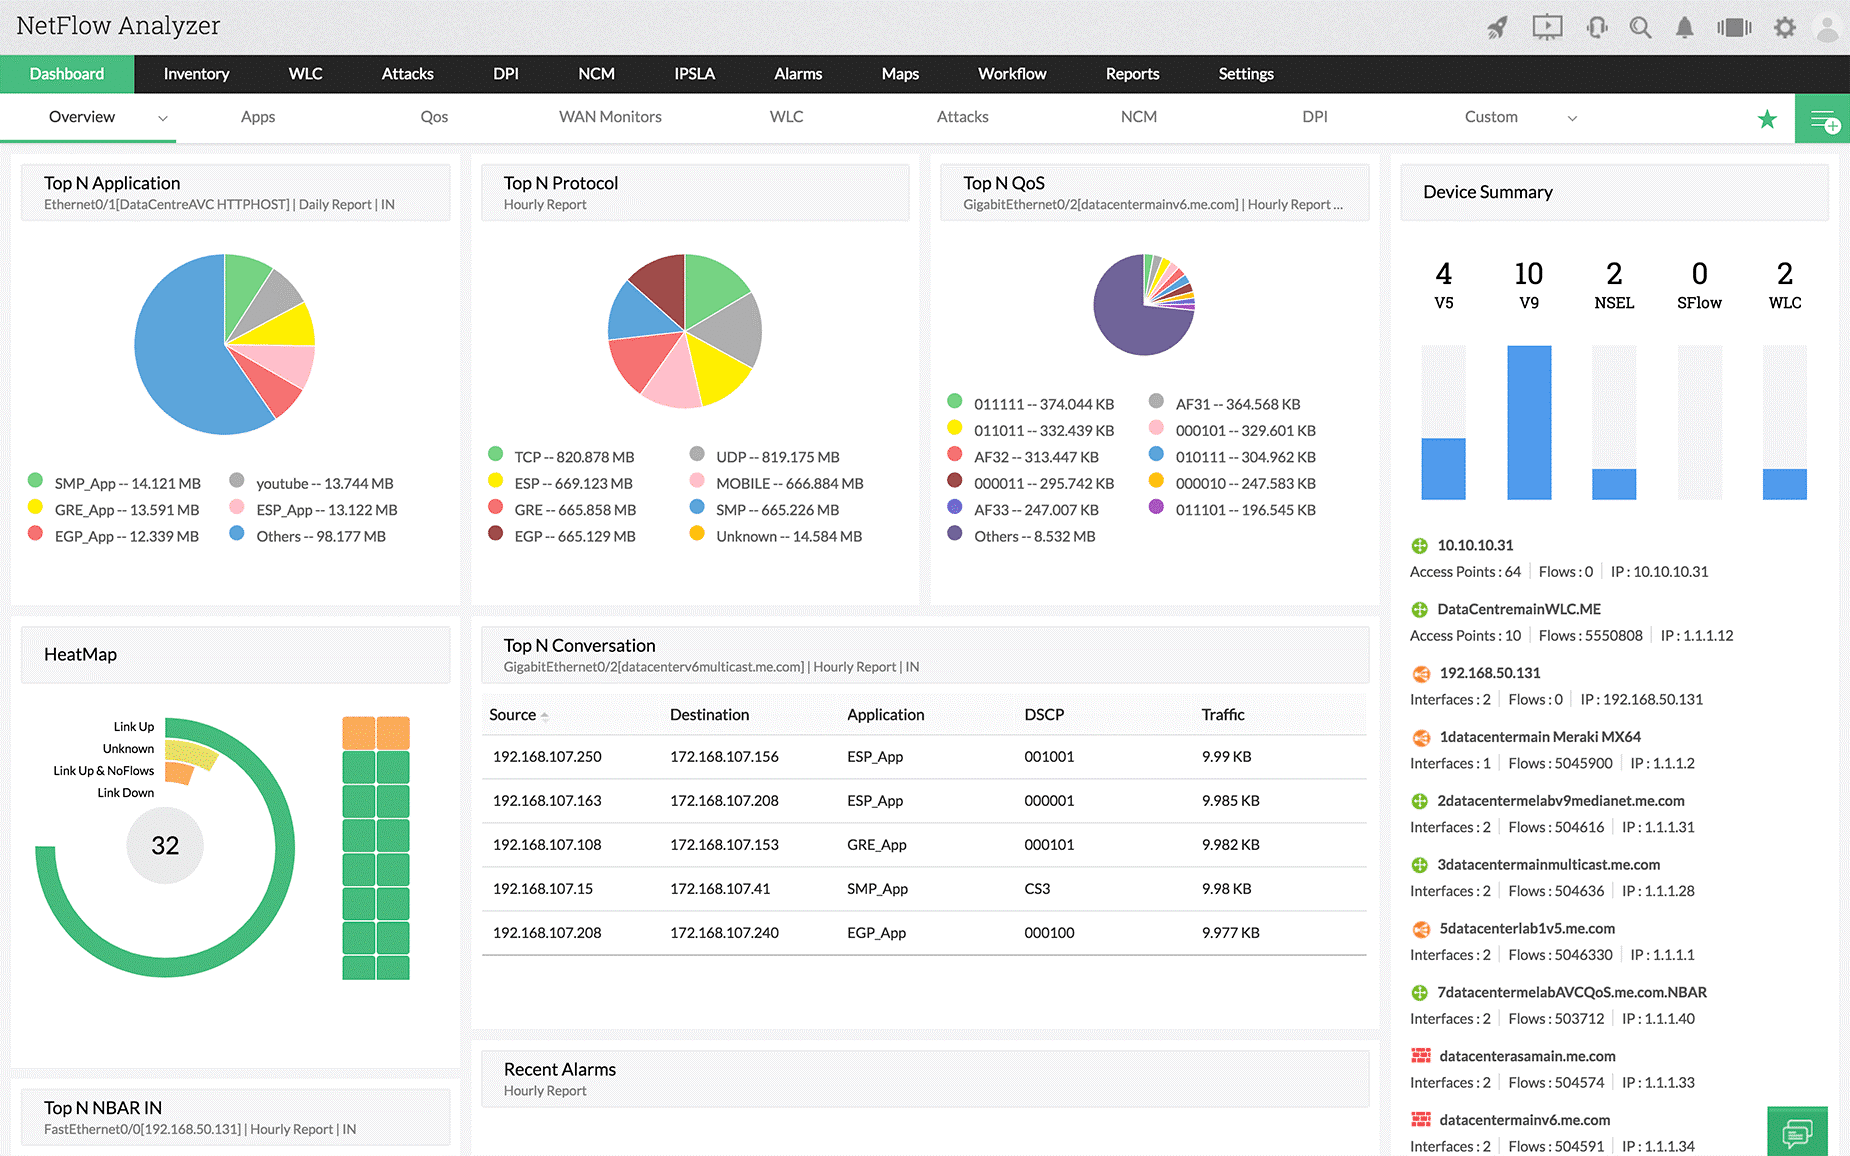
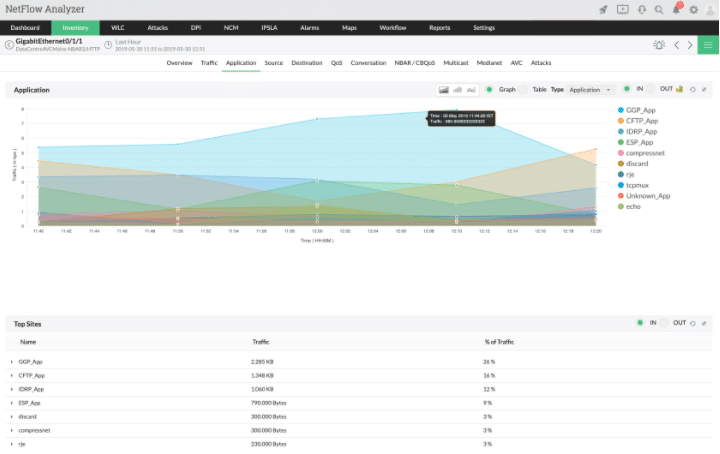
ManageEngine NetFlow Analyzer is next on our list. It is a complete traffic analysis application that uses something called flow technologies to give you a current snapshot of the current activity on your network. This information ties in with the visibility of their bandwidth performance monitoring capabilities and it makes up a critical part of your team’s monitoring infrastructure. Although many see tools like this as primarily being in place for bandwidth monitoring, they can also provide you with valuable insights about the types of traffic that are running on your network.
Why do we recommend it?
Our experience with ManageEngine NetFlow Analyzer revealed a robust traffic analysis application that goes beyond bandwidth monitoring. The flow technologies provided a real-time snapshot of our network’s activity, enabling our team to clean up unnecessary traffic sources and gain valuable insights into various types of network traffic.
NetFlow Analyzer gives your network administrator teams to clean up the traffic sources that are putting unwanted load on your networks, making this a unified solution that does more than just report back to you on packet data and protocol types. Traffic bandwidth and traffic pattern recognition is where a tool like this can really add value to your business by reducing costs and eliminating wasteful data costs. If you have more technical requirements for tracking data utilization, then you can also use this application to look at the interface level, giving you information about the host that is communicating on your network and causing issues.
You can use this tool for network forensics and security analysis for daily operations. It has the ability to find a wide range of both internal and external security issues. This is done by using something that ManageEngine calls Continuous Stream Mining Engine technology. It gives you and your team the ability to track network issues that are anomalous to your setup and need investigating. An example is traffic that is sidestepping your firewall and protective measures.
This will give you a far greater understanding of what is generating that traffic on your network so that you can either remove it if it is not supposed to be there or document it if it is intended to be running. The technology enables your teams to detect security issues such as context-sensitive anomalies and even zero-day intrusions. Command and control packets from malware that have not yet caused issues on your network are also a possibility when configured.
If you need to control the way that data enters and leaves your network, then you can also use this application to recognize and classify non-standard applications on your network. These applications have the potential to use an exorbitant amount of bandwidth and are very rarely allowed on your computer network for this very reason. Peer-to-peer file sharing and streaming services are 2 examples of this. It gives you the ability to plan for future capacity, as well as monitor current usage trends.
Who is it recommended for?
ManageEngine NetFlow Analyzer suits businesses of all sizes, offering critical insights into network traffic and performance. Whether you need basic features from the Essential version or advanced capabilities from the Enterprise version, ManageEngine provides flexibility.
It is particularly valuable for the telecommunications industry, helping manage the vast network traffic associated with voice and data communications. In the retail sector, it aids in optimizing online and in-store transactional systems, ensuring a seamless customer experience. For IT service providers, it offers insights into client network performance, allowing proactive issue resolution.
Pricing: Pricing on the Essential version of ManageEngine NetFlow Analyzer starts at $595 while the Enterprise version starts at $1295
4. ManageEngine EventLog Analyzer – FREE TRIAL
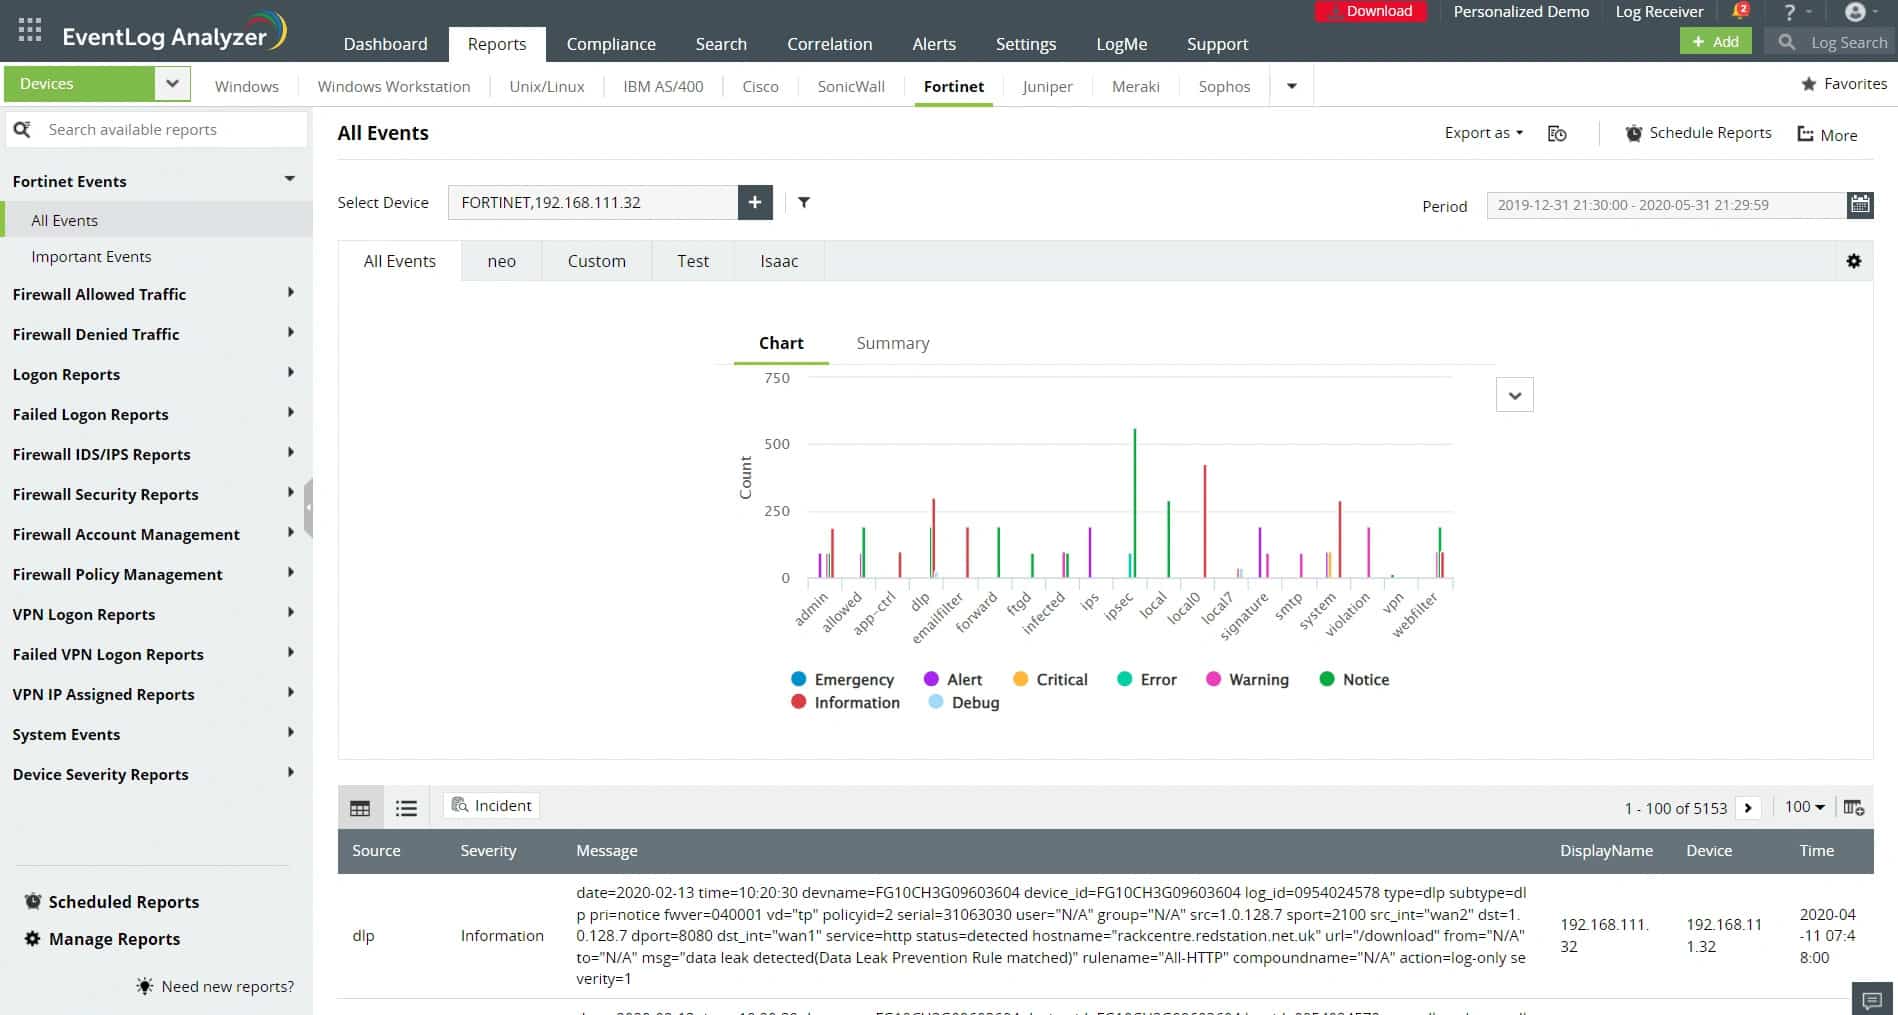
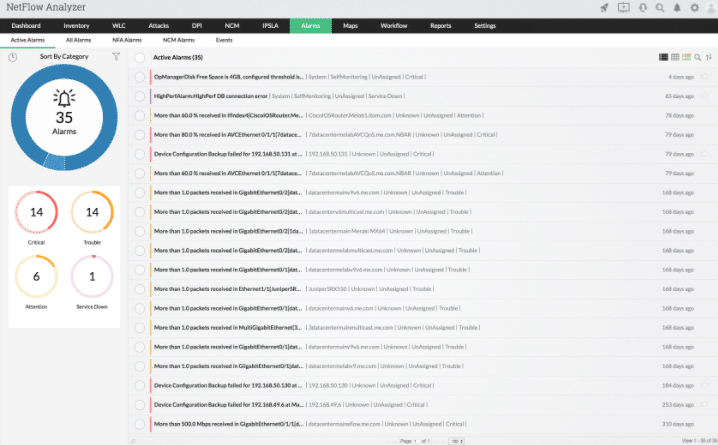
ManageEngine EventLog Analyzer is a log analysis and security tool that gathers, standardizes, stores, and analyzes logs from different sources in your network. It combines data from this log analysis with external threat intelligence feeds to provide detailed information about potential vulnerabilities and anomalous traffic patterns that could indicate a cyberattack.
Why do we recommend it?
We recommend ManageEngine EventLog Analyzer for its intelligent capabilities that provide a holistic picture of traffic patterns in your network. Besides correlating data from sources within your network, it also uses data from global threat exchange platforms like AlienVault OTX to help identify emerging threats.
A notable aspect of this tool is its log search engine, which allows you to search through log data using multiple filters. This option comes in handy to reconstruct crime scenes and perform forensic analysis. You can even combine the results of multiple queries to identify complex patterns.
Another feature that we love is its detailed reports. It comes with predefined options to create reports on denied switch and router connections, configuration changes, traffic by protocol, traffic errors, VPN logon trends, IDS/IPS log analysis, firewall auditing, and more. All these different data points can help you better analyze and understand traffic trends.
EventLog Analyzer’s correlation rules are another plus. It comes with 30+ rules and a custom rule builder to detect threat patterns. Its integration with the MITRE ATT&CK framework is helpful as well.
Who is it recommended for?
It is a good choice for organizations that face complex attacks, especially those that operate in regulated industries like healthcare and finance. It is also a good choice for organizations that have stringent security and compliance requirements. Network engineers and security teams can benefit from its convenient features and intuitive user interface.
Download a 30-day free trial.
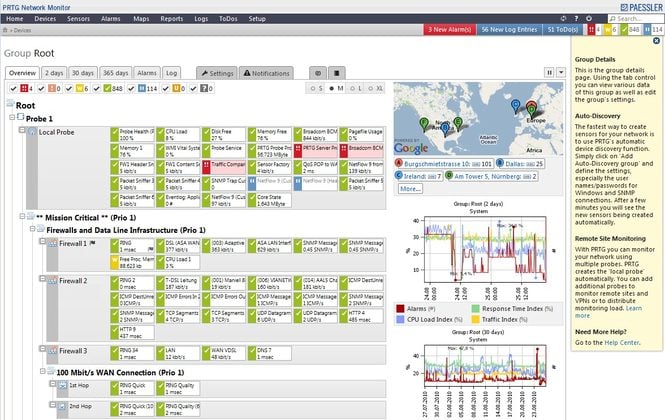
5. Paessler PRTG as a Network Analyzer
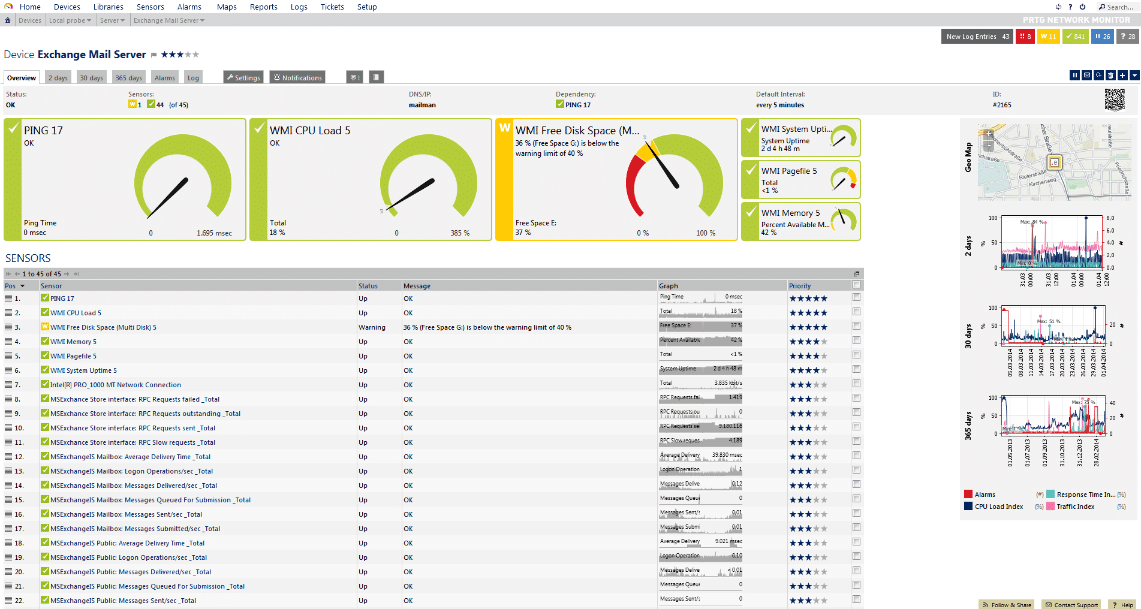
PRTG is well known as an overall network monitoring solution with some great functionality, and it can also be used as a network analyzer, according to the company’s own website. PRTG lets you analyze all of the different components of your network. This helps you to accelerate all of your troubleshooting exercises and lets you get to the root cause of an issue before it becomes an even bigger problem. It helps you to eliminate slowdown areas that cause bottlenecks on your network, which improves the overall efficiency of your network throughput and data transfer speeds. It includes an SNMP monitoring capability, as well as Flow, Packet Sniffing, and even WMI. All of these components help you to plan out the resource allocations for your network, which makes it even more efficient.
Why do we recommend it?
In our evaluation of PRTG, renowned for its comprehensive network monitoring capabilities, we extensively tested its functionalities as a network analyzer. The ability to drill down into network data, visualize it in human-readable formats, and identify top talkers provided valuable insights for our network administrators.
Network analyzers are crucial if you are responsible for the operational side of your network. Network analyzers are able to record and dig into the information that is being transmitted over your network. PRTG is able to look at different aspects of these data flows, such as parameters and packet content, and it can present this information as tables and diagrams. Having visual confirmation of how your network is performing will give you a powerful tool for understanding how your information is traveling across the network infrastructure within your business.
PRTG gives you the ability to drill down into the information of the network by sorting them according to traffic by connection, the protocol used, and by IP Address allocation, which all allow you to identify the top talkers on the network and determine who is using the most data. This is important in managing costs and streamlining efficiency on your network. All of these capabilities are part of your complete networking solution.
Network Analysis by using PRTG gives network administrators 4 specific advantages in particular. The first thing that it does is break down network traffic. This allows you to immediately identify the applications that are hogging all the bandwidth on your network. It monitors all of the devices on your network and tells you which computers and servers are overloading your network. All of this is presented in an easy to read overview that will immediately tell you what is going on within the confines of your network.
The second thing that makes this software standout is the way that it collects your data and allows you to visualize it in human readable formats like tables and diagrams. The data is sorted and gives you a top list of heavy network users. This data is trended over months and gives you a way to find patterns and track the history of a specific server or computer and identify abnormalities.
It also gives you compelling data to take to your financial administrators when budget periods require you to show reasons why you need to upgrade your infrastructure. A severely bottlenecked segment of your network can help you to demonstrate this.
Next, it helps you avoid bottlenecks by identifying the issue in the first place. A bottle neck in your network can severely impact your business applications and customers, so you want to know about any performance degradation before it starts to cause havoc on your network. Avoiding the issue is far better than trying to recover from it or mitigate it after it has already begun.
Lastly it gives you intelligent network updates about the current state of your network. This means that there is continuous feedback about the capacity of your network, which is a huge benefit. It means that you are far less likely to be caught by surprise when there are any sudden spikes in demand for resources on the network, as you can plan redundancy and additional capacity when you understand what resources you currently have on the network.
Who is it recommended for?
PRTG serves as a great solution for businesses seeking a complete network monitoring and analysis tool. Its ability to accelerate troubleshooting, eliminate bottlenecks, and provide intelligent network updates makes it suitable for enterprises of varying sizes. With over 500 sensors, it allows customization based on the specific needs of the network.
PRTG’s SNMP monitoring and packet sniffing capabilities are valuable for the energy sector, ensuring the reliable performance of critical infrastructure. In the technology industry, it assists in managing complex network architectures for software development and testing. For government agencies, it provides insights into network security and compliance.
To try out PRTG Network Monitor for yourself, try out the free download 30-day trial from here.
Pricing: PRTG licensing prices vary with the number of device sensors you need. It starts at $1,750 for 500 sensors with 1 server installation, and you can customize the amount that you need based on the number of devices across your enterprise that you need. Full pricing can be found here.
6. Nagios Network Analyzer
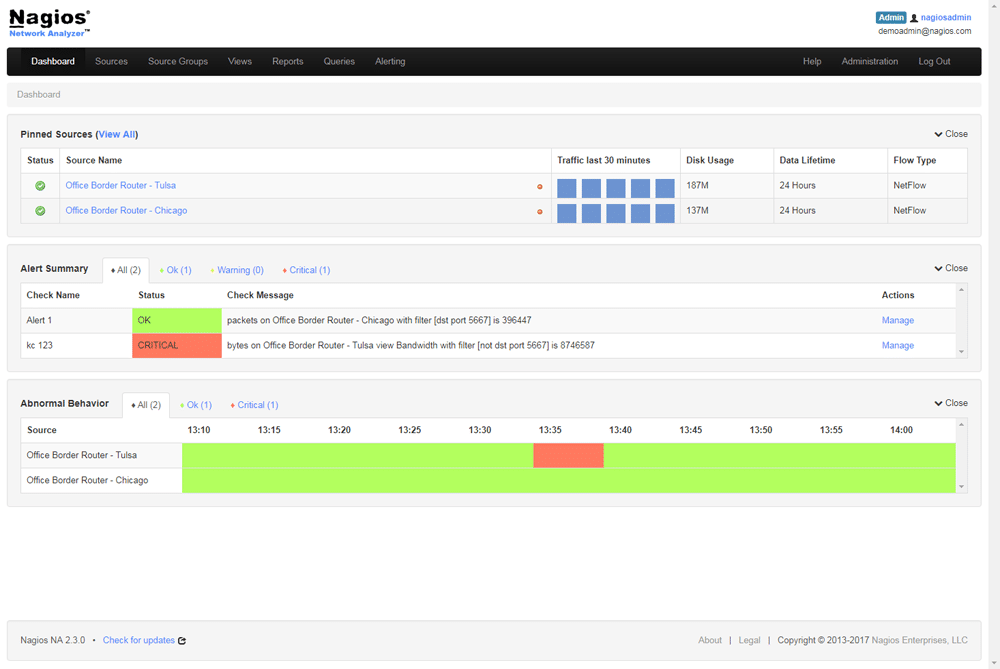
Nagios is a monitoring solution that was first created back in 1999. Since then, it has gone on to become a globally recognized monitoring solution that is favored by enterprise businesses that value visibility and constant metrics. Nagios is able to monitor your entire IT infrastructure and allows you to monitor business systems, system-critical applications, and services.
This, in turn, allows your support staff to keep the wheels of your business turning as intended, while relieving them of actively monitoring graphs while they conduct the day-to-day operations of supporting your network. When issues are detected, your staff can start fixing issues before they become serious enough to cause outages and downtime.
Why do we recommend it?
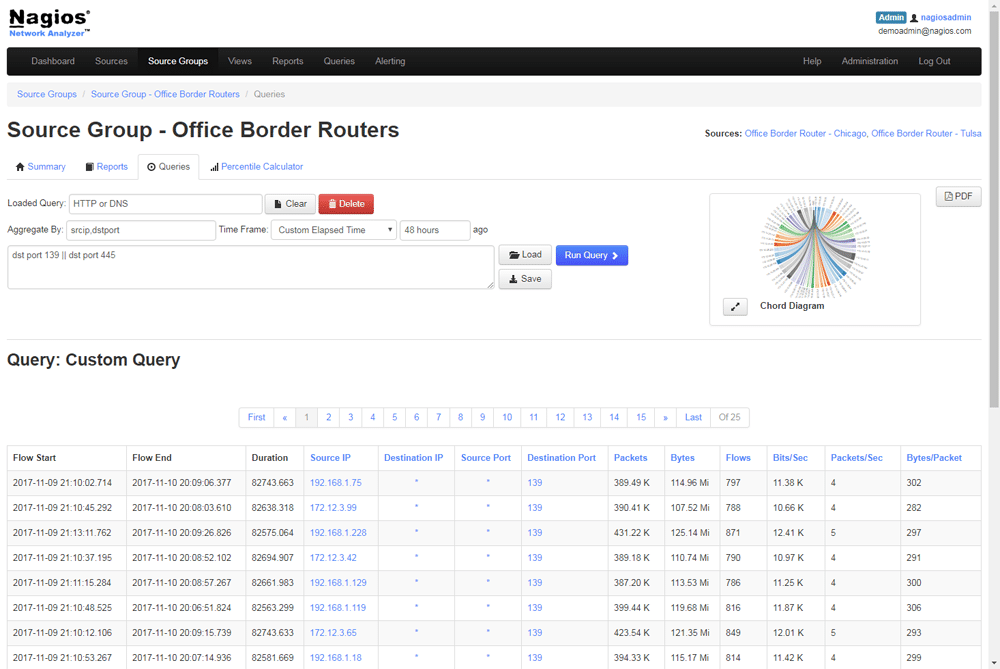
When we examined its capabilities, Nagios Network Analyzer stood out for its comprehensive dashboard environment and high-level network traffic details. The ability to analyze network traffic sources, identify potential security threats, and offer in-depth network analysis made it a valuable tool. The intuitive design and ease of use without unnecessary bloat contributed to a smooth monitoring experience.
Nagios has grown over the years and now features thousands of different projects that have been incorporated into it. These are plugins that have been written to specifically accomplish a particular task, such as Network analysis.
Nagios is a complete package and allows your staff to configure it as a monitoring solution to keep a close eye on critical IT infrastructure components like servers, desktops, IT components in your networking infrastructure, such as routers, managed switches, and more. You can fine tune it to monitor system metrics, specific network protocols, applications that are essential to your business, services, servers, and network infrastructure.
Once an issue is detected, you can configure Nagios to send you alerts depending on how severe the potential is for outages and downtime. The alerts themselves can be sent via email, SMS, or even a customized script that performs a set of functions. Once alerts are generated, your IT staff can acknowledge the alerts and then action them, based on the severity and the procedures that are in place within your organization.
If an alert needs to go to another team or to a specialist, then alerts can be escalated so that the right people get the alerts at the right time. If the person on standby does not answer the alert within a specified time frame, then the alert can be escalated and reassigned to someone else so that the issue does not go without being addressed.
Next, we will look at the Nagios Network Analyzer features.
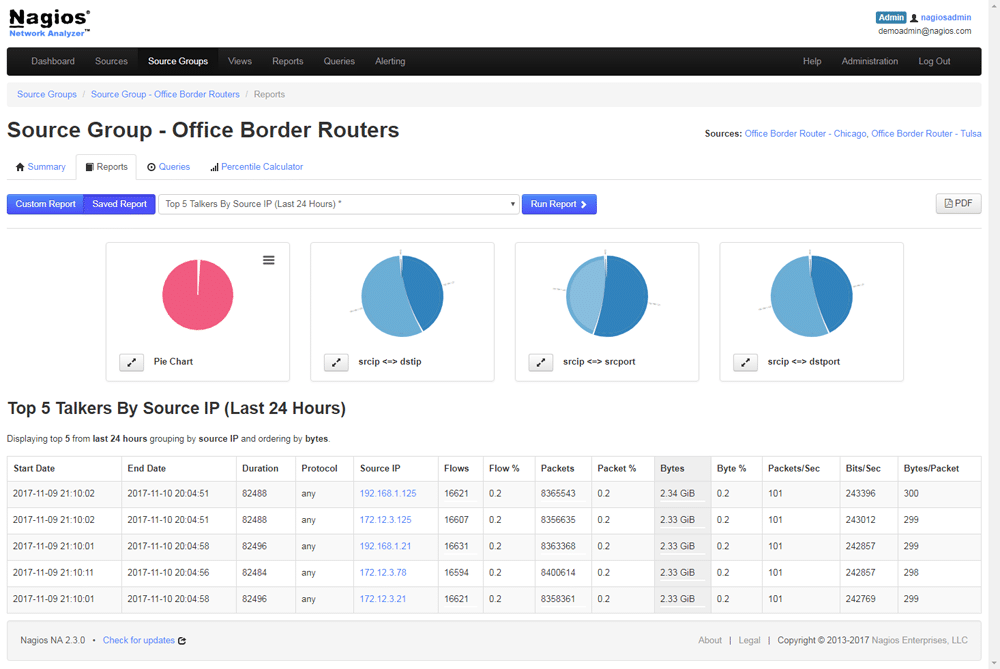
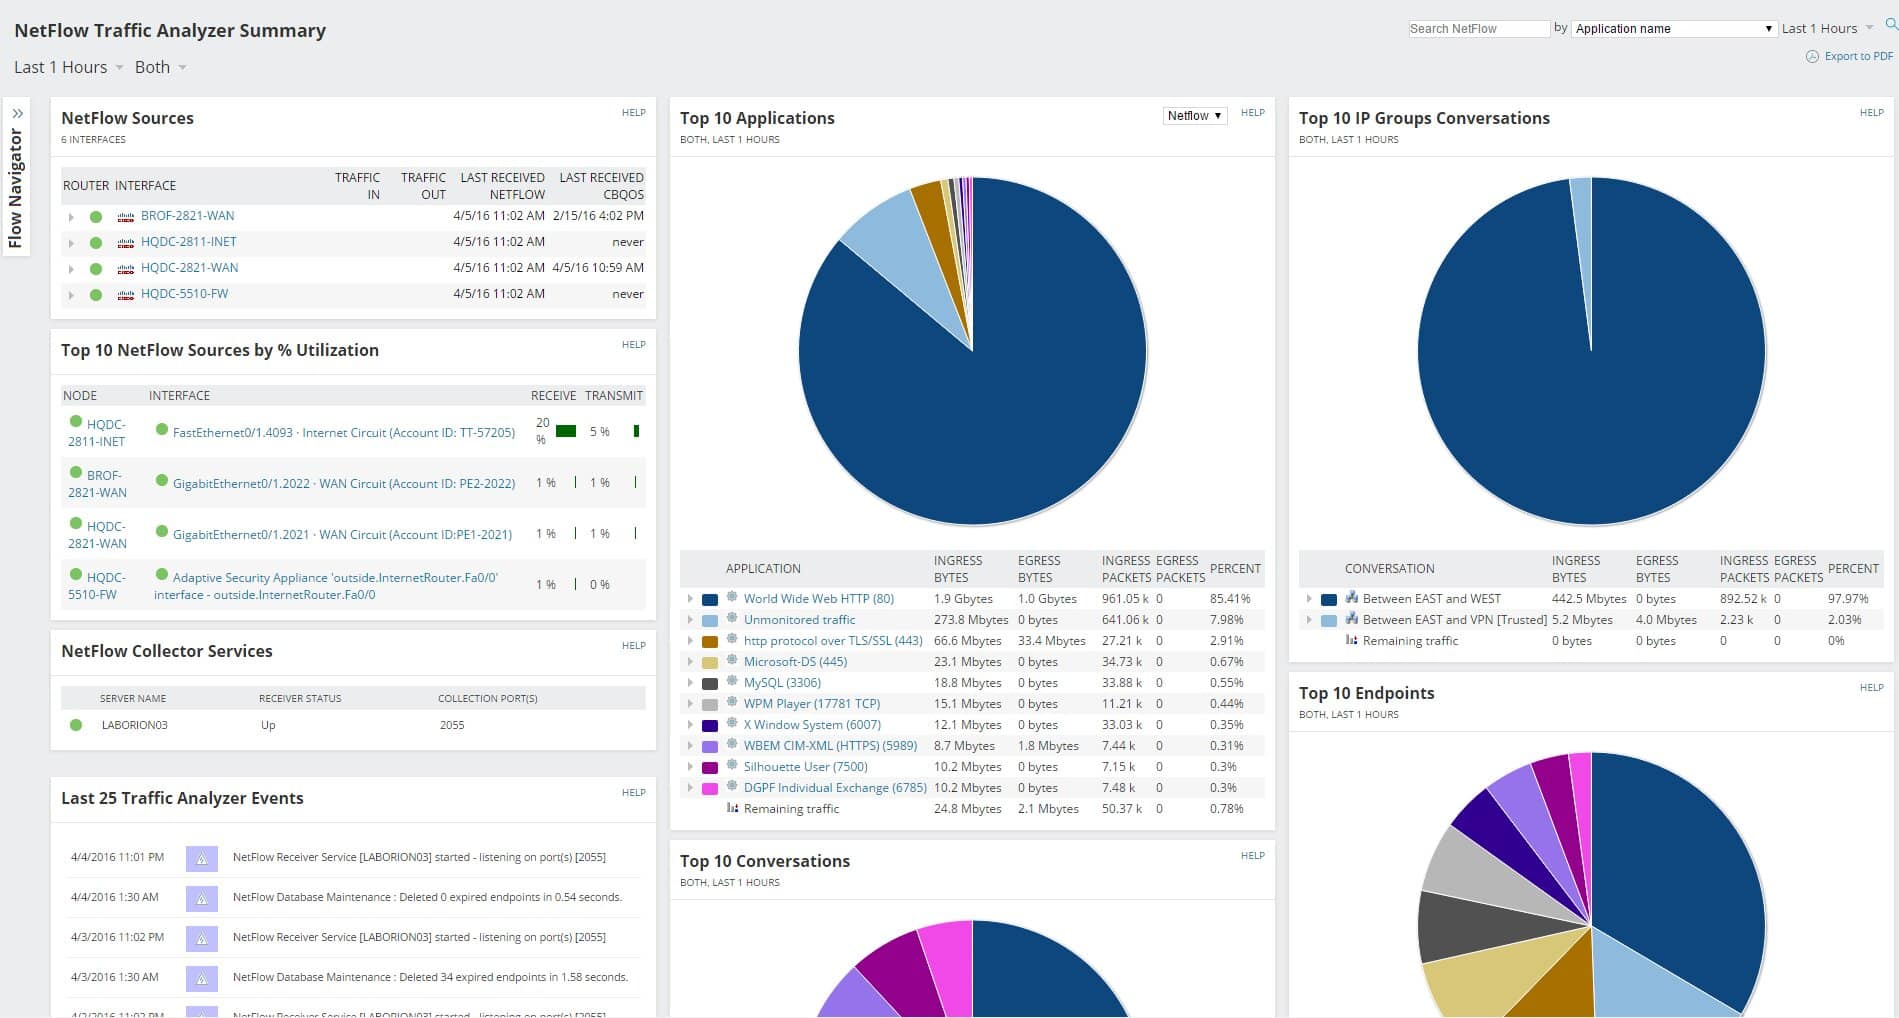
The Nagios Network Analyzer gives you a comprehensive dashboard environment that provides you with high level details about the sources of network traffic. It offers you extensive network analysis so that you can have a more in-depth look at all of the network traffic sources that will break down things such as potential security threats, unauthorized use of the network, and many other network analysis tasks.
Your network administrators will have the ability to quickly and easily gather intelligence about the current state of your network and they will have all of the high-level details that they will need at their fingertips so that proper action can be taken. The design itself is intuitive and very easy to use without any of the bloat that is common in some applications. Instead, you are given an easy to use network analyzer that provides great performance and fast loading times.
The end result is that your teams will have access to Network Analyzer data that they need whenever they need it. No need to setup a filter to capture data during a security even as the application is continuously monitoring and capturing data on the fly.
Who is it recommended for?
Nagios, a globally recognized monitoring solution, caters to enterprise businesses prioritizing visibility and constant metrics. Its ability to monitor the entire IT infrastructure, analyze network traffic, and escalate alerts for timely responses positions it as a preferred choice for businesses valuing proactive network management.
Nagios Network Analyzer is crucial for industries like healthcare, providing detailed network traffic analysis for medical imaging and patient data transfer. For manufacturing, it ensures efficient communication between IoT devices and production systems.
You can download the Nagios Network Analyzer from here if you would like to try it out.
Pricing: Pricing starts at $1,995 for a single license
7. SolarWinds NetFlow Traffic Analyzer
SolarWinds offers a whole host of features in the network analyzer world of tools. It can operate as a packet analyzer, NetFlow monitor, and bandwidth utilization tool. It allows you to build up a repertoire of reports that you can use to identify trends and issues, as well as a real-time alert facility that will notify you when problems are first detected, letting you deal with the issue before it turns critical and causes loss of network connectivity and downtime. If in the event there is a highly unusual event that takes place on your network then you can configure alerts to trigger so that you can monitor the unusual activity in real-time, instead of finding out about it only after it occurs.
Why do we recommend it?
During our testing, SolarWinds NetFlow Traffic Analyzer proved to be an invaluable tool for network management. Its packet analyzing, NetFlow monitoring, and bandwidth utilization features allowed us to identify trends, address potential bottlenecks, and receive real-time alerts, ensuring proactive issue resolution. The ability to track internet usage, customize IP address groups, and analyze various network components made it a comprehensive solution for optimizing our network’s performance.
Just as important as finding out about an issue is finding out where it is originating, and where its destination on your network is. This is not easy on a network that spans many segments and nodes with hundreds and thousands of computers, laptops, IoT devices, wireless devices, and smartphones connected to it.
With all of these devices having the potential to connect to the internet, you have to be able to track and monitor the internet usage of each one. By using the traffic analysis tools that come with this application you can identify the top talkers on your network and begin the process of limiting their data usage by blocking them or throttling their usage down.
Network Traffic analyzer is able to give you a comprehensive analysis of all network components and automatically correlate the collected data so that you can gain a better insight into the activity. It is able to collect NetFlow v5 and v9, Huawei NetStream, Juniper J-Flow, sFlow, IPFIX, Advanced app recognition with NBAR2. It also has the ability to analyze network traffic by using custom and overlapping IP address groups. This technology allows you to create your own IP address groups, which can then be looked at and will show you the network traffic and sort it in the way that suits you the best.
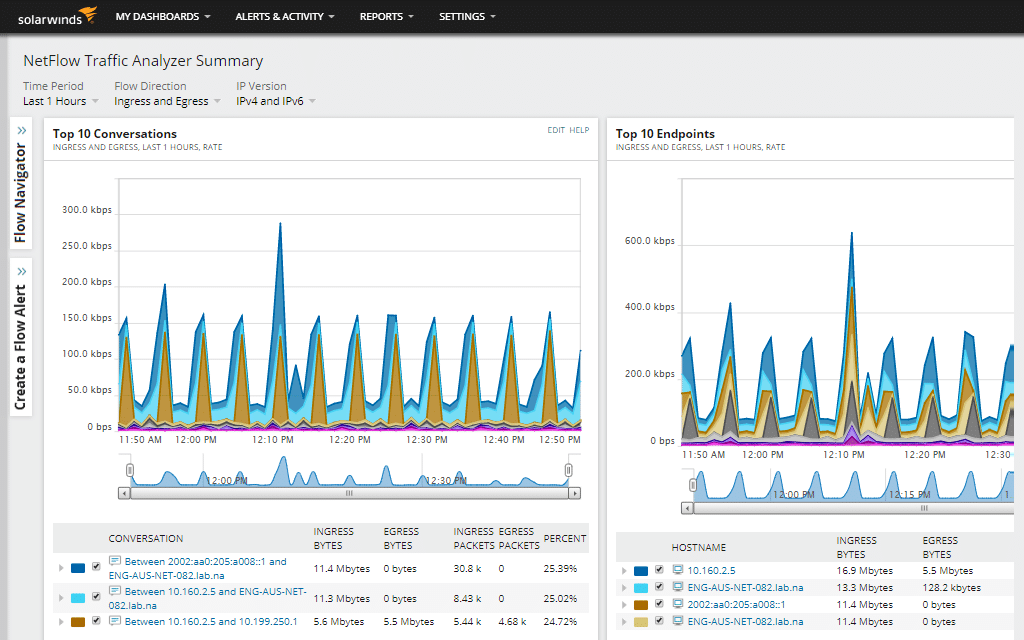
Solarwinds NTA was designed to create a user-friendly interface that is easy to get information from by using a web interface. It displays the application, out traffic, in traffic, and percentage used all in a simple graph that is easy to read. The graph is also color-coded so you can easily visualize which applications used the most data.
NTA also has a ‘network insights’ view that lets you see which elements you need to tweak in order to improve your network flow. SolarWinds has PerfStack which features a cross-stack network traffic data correlation that gives you fast graphical confirmation and insights. If you would like to try it out for yourself then you can find a link to the 30-day free trial. You will need to sign up and supply some of your details before you can proceed to the download page.
Who is it recommended for?
The user-friendly interface caters to beginners, offering a straightforward experience without requiring advanced technical knowledge. It’s adaptable for companies of varying sizes, providing critical insights for effective network management.
For larger institutions like finance, it aids in monitoring and securing financial transactions, ensuring seamless operations. In healthcare, it helps manage the vast network of medical devices, ensuring data integrity and compliance. In education, the tool assists in optimizing network performance for online learning platforms, enhancing the overall educational experience.
Pricing: Pricing for this product starts at $1,036. If you would like a more personalized quote, then you can request one from here.
Conclusion
We have gone through 5 of the best commercially available Network Analyzers that are currently available. Each of the companies that create this software have their own take on the needs that a network professional in an enterprise production environment might need. Some incorporate monitoring and alerting structures and systems into the analytics of packet analyzing, while others concentrate solely on the capture and collection of network traffic data for you to create highly graphical and easy to use graphs to convey to management and technical staff what components on your network are using network resources.
What the main take away from these run downs of products should be for you is the fact that visibility is paramount whenever dealing with network traffic analyzers. In order to truly know what is going on within your network you need to be able to pinpoint the source of data transmissions, and also measure them accurately.
We hope that you have found this information useful and that it has given you lots of information about your next network analyzer solution for your network. There are many different factors that are worth considering before you jump in and implement a solution for your network, and we hope that you have seen what a few of your options are.