Today we’ll be looking at some of the Best NetFlow Analyzers and Collectors to analyzing traffic and bandwidth, but before we get into those, lets learn a little more about the technology behind these tools.
In today’s world of intelligent switches and routers, most of them use a protocol developed by Cisco called NetFlow. This allows you to add software or appliance-based probes to export NetFlow data.
NetFlow records and reports all IP conversations passing through nodes and interfaces; it does this through an abstraction process called a flow.
Here is our list of the best NetFlow Analyzers & Collectors:
- Auvik – EDITOR’S CHOICE This SaaS package implements network discovery, device status tracking, network configuration management, and traffic analysis from its cloud platform. Get a 14-day free trial.
- SolarWinds NetFlow Traffic Analyzer – FREE TRIAL This on-premises package is able to monitor bandwidth utilization per link on any LAN. Runs on Windows Server. Get a 30-day free trial.
- Site24x7 Network Traffic Monitoring – FREE TRIAL A cloud-based monitoring system that tracks network traffic volumes through the use of an onsite agent. Access a 30-day free trial.
- ManageEngine NetFlow Analyzer – FREE TRIAL A software package that identifies the main traffic generators and examines the network capacity per link and overall. Available for Windows Server and Linux. Get a 30-day free trial.
- Paessler PRTG Network Monitor – FREE TRIAL This is a bundle of network, server, and application monitors that includes sensors for the major traffic querying protocols. Runs on Windows Server. Download a 30-day free trial.
- Nagios XI and Core A complete system monitoring service that is available in free and paid versions. Runs on Linux, macOS, and Unix.
- Kentik Detect This is a cloud platform that offers live monitoring, security protection, and performance analytics.
- WhatsUp Gold A network performance monitor that can be extended by add-ons – the Bandwidth Monitoring package is one of those. Runs on Windows Server.
A flow is a sequence of packets that make up a conversation between a source and a destination. NetFlow Inspects and groups packets into flows by their respective fields of information such as source, destination, protocols, address, ports, and etc.
Information on inspected flows is bundled up from the packets and cached locally (based in the flow cache). From there, it’s periodically exported to the collector based on active and inactive timeouts. This makes Netflow only handle IP’s, mainly focusing on the OSI layers 3 and 4.
Through the use of NetFlow analyzers, we can collect and monitor internet & bandwidth usage from those layers showing us what’s going on as a whole. In this article, we will explain all the jargon in this field and help you choose the best analyzers for you. Here are the seven best analyzers we have found that are platformed around NetFlow. So, you will be able to choose the most suitable and appropriate one for your needs.
The Best NetFlow Analyzers & Collectors
1. Auvik – FREE TRIAL
Auvik is a cloud platform that monitors networks by downloading a local agent. That agent scans the network to discover all of the devices that connect it together and connect to it. This data is uploaded to the Auvik server, where it gets transformed into a hardware inventory. The package creates a network map from the data in the inventory.
The discovery routine repeats and will pick up on any changes to the network. This triggers an update of the hardware inventory and map. The network discovery routine also provides security scanning because it spots rogue devices connected to the network.
The Auvik platform implements device status monitoring through the Simple Network Management Protocol (SNMP). This service is made possible by SNMP device agents – every network device is shipped with one. The Auvik agent acts as the SNMP manager and broadcasts a status report request over the network. All device agents respond with a report.
SNMP device agents will send out warnings without waiting for a request if they discover component problems. These warnings get shown in the Auvik dashboard as alerts.
The package also performs network traffic analysis by extracting throughput volumes from switches and routers. These statistics are displayed in the Auvik dashboard.
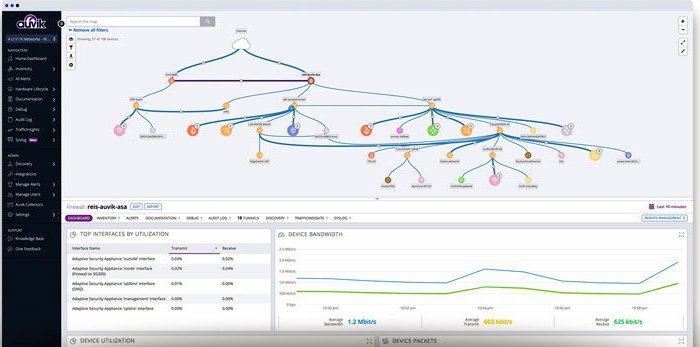
The traffic reports can be filtered, sorted, and summarized. This lets the network manager see which endpoints are generating the most traffic. It is also possible to get a report by protocol. The dashboard includes a world map that shows all the countries with which endpoints on the monitored network are communicating. Countries with more activity are shaded darker.
The network traffic monitor communicates with NetFlow, IPFIX, sFlow, and J-Floew. This range of protocols enables the package to operate in a multi-vendor network.
The Auvik platform also provides a network configuration manager. This stores a backup of the configuration of each switch and router. The device scan repeats every 60 minutes and is compared to the stored image. If the settings have changed, the Auvik system takes a new image of the device’s configuration and then stores that.
Device configuration images are not overwritten but are stored as a series of versions. Network managers can compare versions to identify what changes have been made. These might be security-weakening alterations, in which case, the network manager can reapply an older configuration image to restore the official settings.
Auvik is able to monitor multiple sites in one account. It will also check on the connections between locations and cloud services. This means that it is able to provide a WAN monitoring service.
Auvik doesn’t publish a price list. However, its subscription rate is a flat fee and it isn’t calculated on the number of endpoints, sites, or users. You can monitor as many devices as you like with one account. This is a cloud-based service, so there is no download. Instead, get started by signing up for a 14-day free trial.
EDITOR'S CHOICE
Auvik is our top pick for a NetFlow analyzer and collector because it is able to operate in a multi-vendor environment by communicating in a list of flow protocols, not just NetFlow. The other protocols that the package can use are IPFIX, sFlow, and J-Flow. The cloud platform of Auvik also provides SNMP-based device status monitoring and network configuration management. The system sets itself up with an autodiscovery routine, which repeats continuously, spotting changes to the network. The discovery service sets up a hardware inventory and creates a network map.
Download: Start a 14-day FREE Trial
Official Site: https://www.auvik.com/features/#trial
OS: Cloud-based
2. SolarWinds NetFlow Traffic Analyzer – FREE TRIAL
With SolarWinds NetFlow Traffic Analyzer, they like to say on their webpage as a slogan that “NetFlow analysis and bandwidth monitoring shouldn’t be hard.” This becomes pretty apparent once we start to look into this application.
This application comes with, yet again another excellent user interface, A vast array of features that cover a lot more than just the bandwidth monitoring. It has customizable network traffic reports: a performance analysis dashboard, and loads more features.
Per SolarWinds slogan for NetFlow Traffic Analyzer, their webpage has got to be one of the most interactive, insightful, and just flat out helpful with things like an interactive demo of NTA (NetFlow Traffic Analyzer). They give great break downs to a lot of the behind working of their application.
Allowing for quite an impressive overview and look into this application before you even invest the time of trying the demo version or might even be able to go straight to the paid version if what you see meets enough of the requirements you are looking for in a NetFlow Network traffic analyzer and bandwidth monitor.
Now let’s dive a bit deeper into what, how, and how well NTA goes about doing all this.
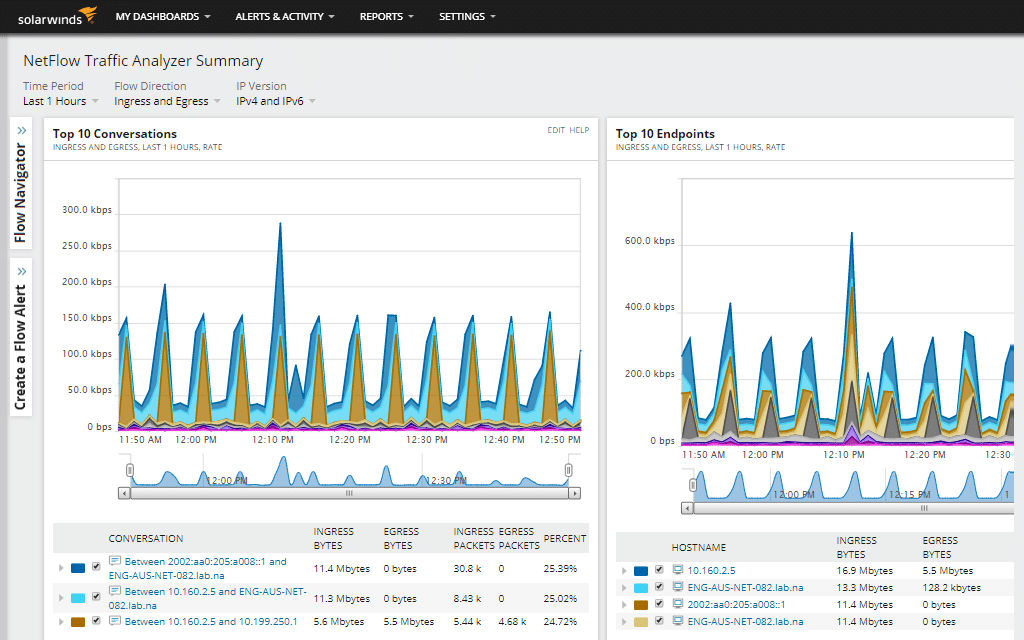
At the heart of NTA’s (NetFlow Analyzer) Internet monitoring and bandwidth usage capabilities lies a view on both IPv4 and IPv6 (Internet Protocol version 4 & 6) flow records. Monitoring for Cisco NetFlow, Juniper J-Flow, sFlow, Huawei NetStream, and IPFIX flow data to identify the applications, protocols, and users hogging the bandwidth.
With NTA (NetFlow Analyzer), there is an integrated performance analysis dashboard called PerfStack, which is a cross-stack dashboard used to accelerate the identification of root cause by drag and drop of network metrics onto a common timeline to correlate with an immediate visual cross-reference.
NTA’s WLC (Wireless LAN Controller) is just as crucial in today’s world because so many devices are wireless, making the need to keep an eye on the wireless network just as vital. With WLC traffic analysis, you can easily keep tabs on what and who is using your wireless network and how much bandwidth they are using.
The good old saying “Time is money” this will be where NTA assists you through the use of customizable network traffic reports; deliver in-depth reports by creating and scheduling network traffic and bandwidth analysis. In just a few clicks so you can review historical data to see peak bandwidth usages to adjust policies to allow for better management.
This one is a must-have for any network administrator and engineer of medium to large scale networks needing internet and bandwidth monitoring.
They have a free trial on their site but only have two price listings on their website for the full version to view at face value, which is both starting values the subscription starting at approximately $1013 and the Perpetual Starting at approximately $1903 with both choices changing with the different bundles. You can start with a 30-day free trial.
3. Site24x7 Network Traffic Monitoring – FREE TRIAL
Site24x7 is a cloud platform of system monitoring services that include network monitoring tools. The network monitoring package offers SNMP monitoring to gather device health data and also network traffic monitoring.
The network traffic monitoring system communicates with switches, routers, firewalls, and wireless APs. The service uses the querying mechanisms contained in the NetFlow, sFlow, cFlow, NetStream, AppFlow, and IPFIX protocols.
Network traffic data is extracted by an agent program that Site24x7 installs on the monitored network and then uploaded to the Site24x7 server for analysis. The traffic analysis service is able to segment traffic data to identify the applications, addresses, and protocols that generate the most traffic volume.
Each metric that the system gathers has a threshold placed on it. This is a capacity measure that, if exceeded, will trip an alert. The system knows the full capacity of every interface on every device and so the thresholds provide a safety margin, giving you time to make adjustments to the network to head off disaster.
You don’t have to sit and watch the monitoring dashboard all the time because alerts can be forwarded to key personnel by email, SMS, push notification, voice call, or RSS feed. The dashboard is resident in the cloud so it can be accessed from anywhere through any standard Web browser.
The network traffic monitoring service is able to analyze traffic over time and spot anomalies in usage. This lets you see the peaks and troughs in demand and the times of day that place the most demand on the network. This information enables you to identify which segments of the network are underprovisioned. You can use this service to replan the physical network or implement queuing and other traffic-shaping measures.
Traffic prioritization is aided by the use of Differentiated Service Code Point (DSCP) templates. This is particularly useful for improving the performance of interactive protocols such as video streaming and VoIP.
As the platform is based in the cloud, it is not limited to monitoring a single LAN. It can also track the performance of connections to cloud services and the links over the internet between sites. You can enroll multiple sites in one account, enabling you to centralize the monitoring of your entire organization’s networks.
Site24x7 is a subscription service and it is packaged in plans. There are many editions offered on the platform and all of them include network traffic monitoring services. Other utilities in each plan include server and application monitoring. There are also website monitoring systems available that deploy both real user monitoring and synthetic monitoring techniques.
The Site24x7 price starts at $9 per month. All plans are priced by the month but charged for annually. Site24x7 offers any edition for a 30-day free trial.
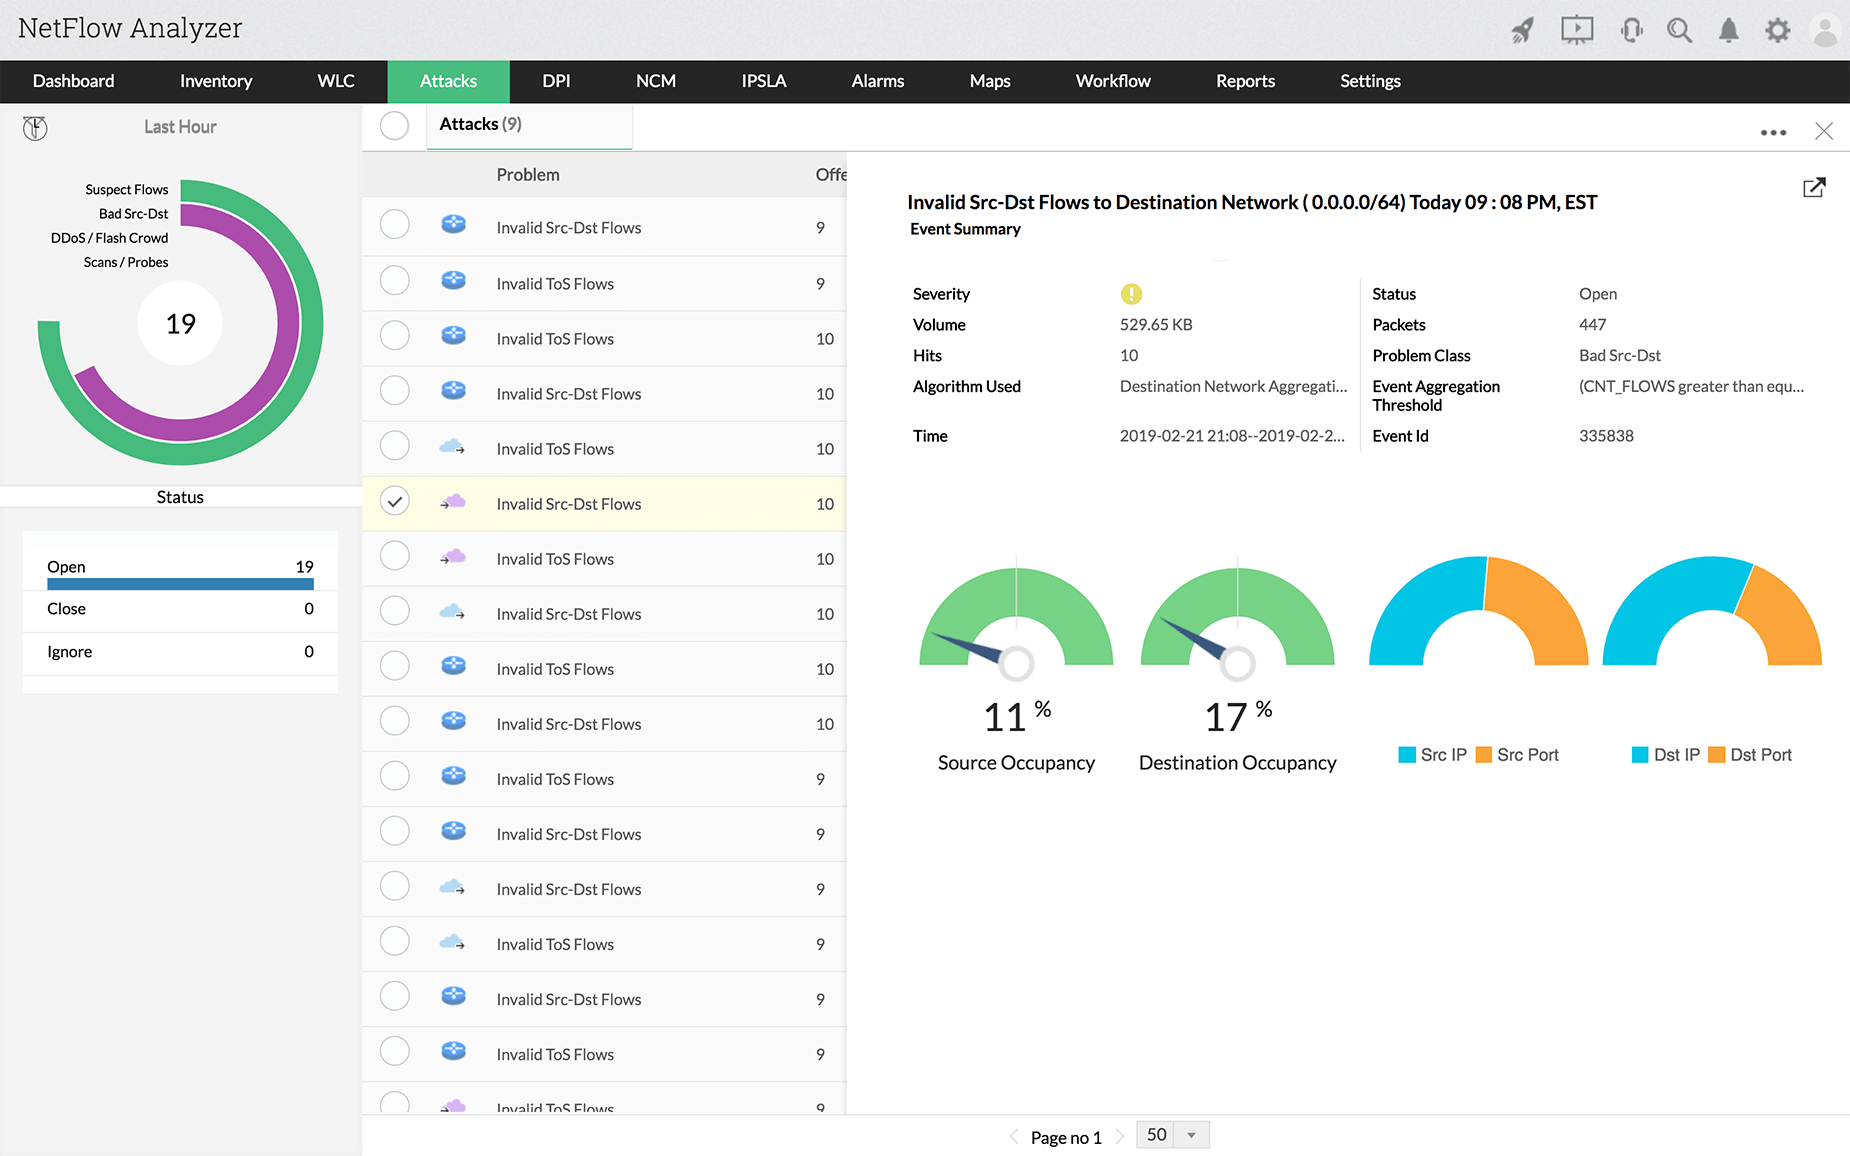
4. ManageEngine NetFlow Analyzer – FREE TRIAL
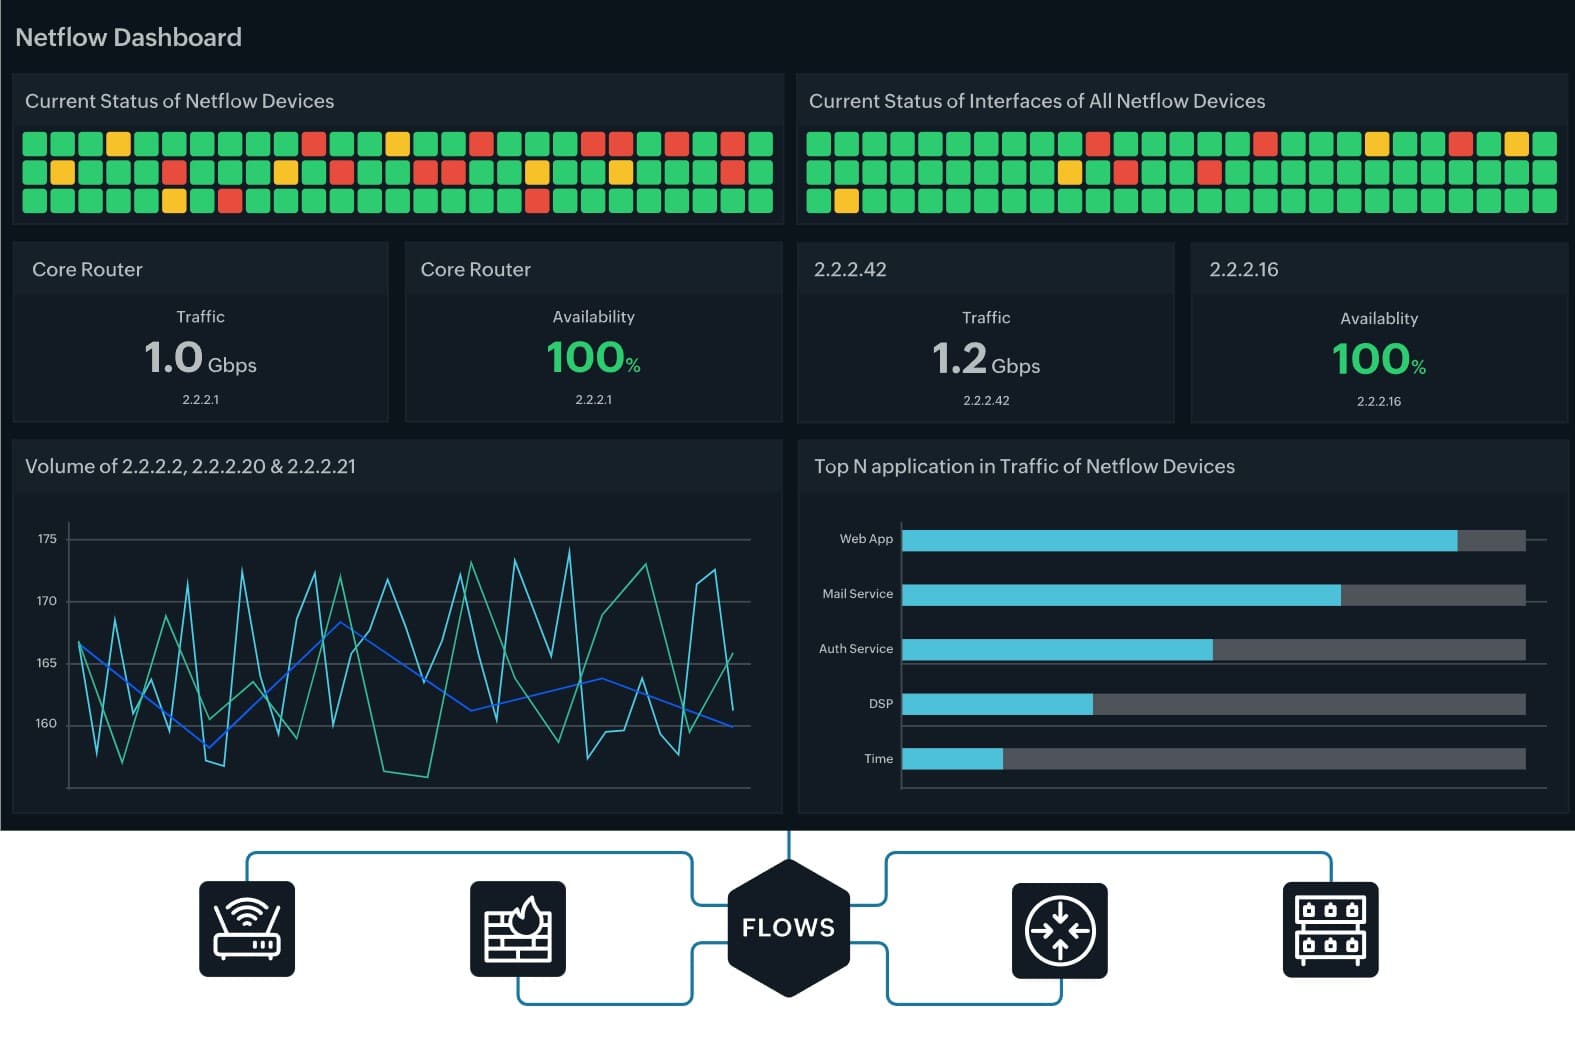
ManageEngine has made their NetFlow Analyzer focus around network bandwidth monitoring. They have fed in a span of other features that made this application have multiple uses other than just being a NetFlow monitor and collector. In doing so, they helped to optimize thousands of networks worldwide through their unified solution NetFlow Analyzer.
ManageEngine NetFlow Analyzer supports a range of the leading flow protocols in the market, such as NetFlow, sFlow, IPFIX, Netstream, J-Flow, NBAR, CBWoS, AVC, SP SLA, and AppFlow (which are variants of NetFlow). This gives you a comprehensive view of what is happening within the network traffic and bandwidth. Making NetFlow bandwidth monitoring easy with their one application does it all approach.
This NetFlow Analyzer is a visually appealing interface that gives you a nice snapshot layout of your needs. This layout allows you to see high-priority statistics at a glance like a network performance, bandwidth consumption, and bottlenecks. This all aid towards a fast-paced response time to anything that might be causing a problem on the network, allowing you to get it all back on track fast without having to go digging too deep for answers.
Let’s look at ManageEngine’s NetFlow Analyzer in-depth and see what it does and how it does it.
The ManageEngine’s NetFlow traffic analyzer gives the user the ability to recognize and classify non-standard applications that hog your network bandwidth.
The NetFlow traffic analyzer then uses ACL (Access Control List) or class-based policy features to reconfigure policies with traffic shaping techniques in order to get control over bandwidth-hungry applications and users.
With NetFlow Analyzer, you can set a large number of alerts that will pop up to inform you the moment there is something out of the customized parameters. These alerts can be set up to monitor top conversations, top applications, top QoS, top protocols, top applications, and many more.
NetFlow Analyzer gives you real-time insight into your network’s bandwidth with on the minute granularity reports.
When needed, there is a hover-over feature that lets you see a bit more detail of an element. If you then click on the element, it will give you a complete drill-down for when you need to go past the basic statistics offered by the pie charts on the home page. This drill-down feature lets you see the full report and view on the entirety of the network.
NetFlow Analyzer uses Cisco NBAR technology to dive down to layer 7 and give good visibility on what is happening. That way, it can recognize applications using dynamic ports numbers or hide behind popular ports.
This application is better suited for a large-scale network as it gives the administrator a better scope of the problem and allows for fast and accurate administration of the network.
There is a 30-day free trial from their website, but it is limited to monitoring only two interfaces. At the request of a quote.
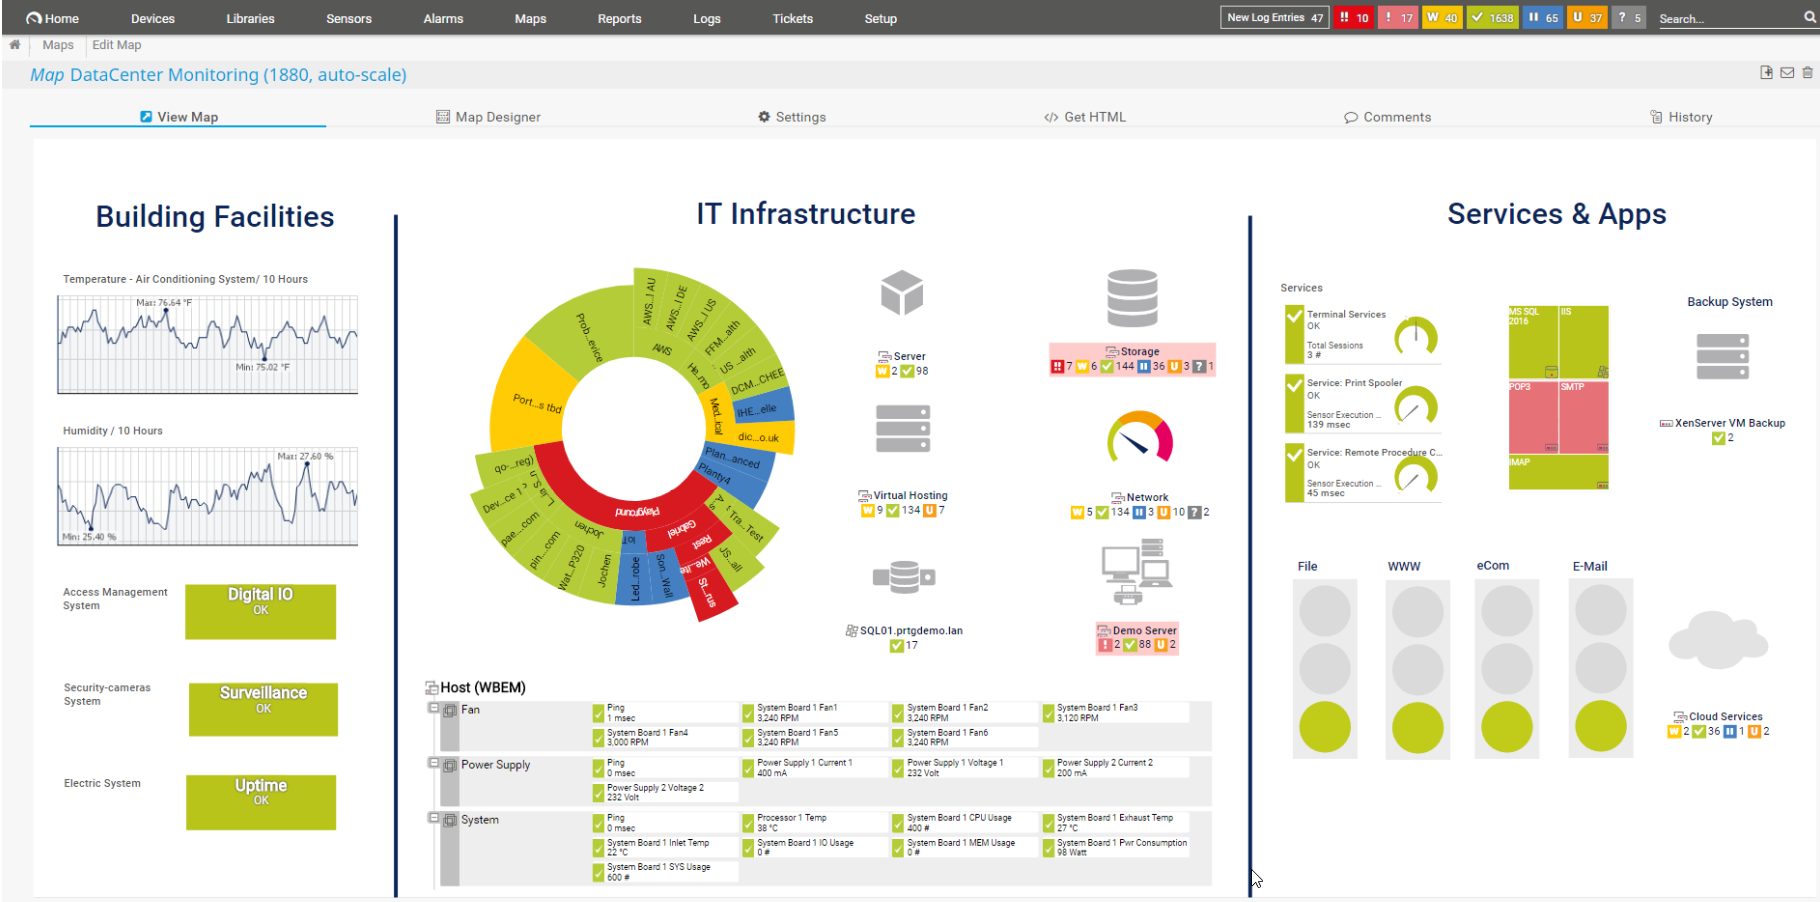
5. Paessler PRTG Network Monitor – FREE TRIAL
Paesslers PRTG has been a top dog and a base reference for others in the world of network monitoring and bandwidth collecting for quite some time now, and there are a host of reasons as to why this is.
PRTG monitors way more than just bandwidth and network traffic. It also helps keep an eye on Databases, Applications, Cloud services, Servers, All LAN (Local Area Network) based nodes, Devices using SNMP (Simple Network Management Protocol), and many more from there, Making Paessler’s PRTG a potent all-round IT network Tool.
With the fact that you can create your dashboards with more than 300 different map objects on the user interfaces, PRTG is all about visualizing your network bandwidth and internet usages with real-time maps and live status information giving you quite a bit of customization and versatility in your user interface layout.
PRTG is an application that is all about keeping you in the know from its fantastic user interface, their free apps for Android, and iOS, allowing for push notifications. This application has an excellent alarm base that allows you to set a large number of different alarms to alert you the moment there is something out of the norm. It even allows you to create notifications using the PRTG API.
Now let’s have a closer look at what goes into an application that can do so much for a network, and that is so widely backed, and that has earned its title so well.
The integration technologies that are behind the sense in PRTG are things like WMI (Windows Management Instrumentation) and windows performance counters, NetFlow for traffic analysis or packet sniffing, SSH for Linux/Unix and macOS systems, HTTP requests, Ping, SQL(Structured Query Language) and many more.
PRTG has incorporated a feature enabling fast lookup of devices from the mobile application by using QR Tags to be printed and then stuck on the devices.
PRTG’s bandwidth monitoring works on the best-known and most widely used monitoring protocols to offer you data in real-time utilizing SNMP, packet sniffing, and NetFlow, keeping a close eye on the bandwidth usage is a breeze.
SNMP is a widely used protocol that keeps an eye on the overall network traffic while keeping an eye on individual ports. It also offers a straightforward setup.
CPU usage can be kept to a bare minimum through the use of Flow-Technologies in the form of NetFlow, IPFIX, jFlow, and sFlow, as they offer an extensive filtering possibility while keeping CPU usage down to a minimum because they are low strain protocols. It will just be dependent on what you need to use for which device you need to use on.
This application will most definitely be on the list of tools a network administrator would use as PRTG is a very standalone complete network tool.
PRTG’s starts with a 30-day free trial. After that, the pricing starts at the PRTG500 License at $1750 to the PRTG XL1 License at $15,500. The Enterprise License is requested on quote due to it being customized to tailor the client’s needs.
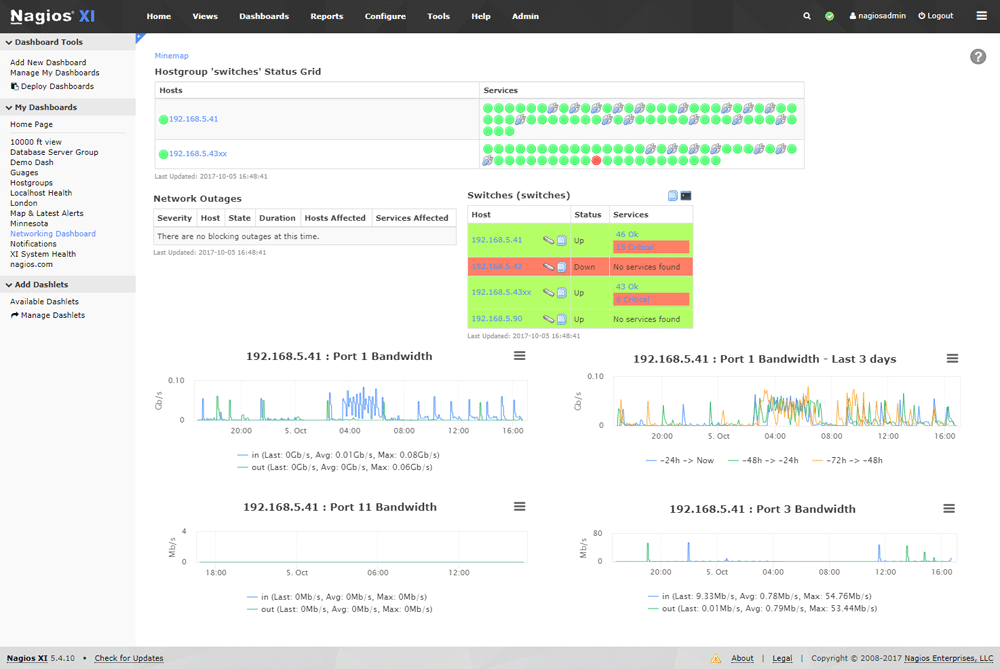
6. Nagios XI and Core
Nagios have an exciting approach to their monitoring software. They have two versions of network monitoring applications one free open source version Nagios Core and then a commercial paid for variant Nagios XI with extra features and automated assistance for configuring it.
These applications have been known for being powerful, scalable, reliable, and customizable. However, the downside is that Nagios XI has a reputation for being complex to configure.
Nagios, unlike the rest on our list, have chosen to keep their user interface quite simplistic yet, still very informative and proactive in giving you the data you need whilst still having a map of the network.
The open-source version comes with a bit of a learning curve, but there is an active community to help you with any explanations and questions you might have.
Both versions monitor servers, services, and applications for bandwidth usage along with network analysis and troubleshooting traffic problems. They both have the alerting systems for reporting by email and SMS.
With Nagios, it is a real hands-on application with the lack of Auto-discovery of devices. You wind up having to learn to set up and maintain complex configurations. Even though that would seem to be a downside, there is still a silver lining here as it makes the application a lot more flexible and customizable in order to extend the tool to what you need it to be for your network.
With Nagios Core being open source makes for lots of room and expansion with community-developed add-ons, including ones to help with auto-discovery and configuring it.
With Nagios XI, there is also a host of add-ons that are commercially supported. Nagios XI comes with automated support for discovering devices and hosts along with an automated configuration tool for the application itself.
Nagios XI has been built as a Red Hat Linux or CentOS based application, so for the windows based machines, you will need to run it on a VM appliance with Hyper-V or VMware. However, they have thought of this aspect and included all the auto-discovery and configuration wizards need for this to still work and be able to add new devices, hosts, or applications.
Once the hurdles of installing and setting up Nagios XI are done, the operations screen will give you all high-level information and the state of the network up-front and center with the options to drill down as needed. These applications will need a network administrator or engineer that is preferably adverse in open source products to work with Nagios XI or Core quickly and efficiently.
Nagios Core is entirely Free. Nagios XI comes with a 30-day trial and has two editions a standard that comes at $1,995 and Enterprise that comes at $3,495 with the add on that there is an annual renewal fee for Enterprise maintenance & support.
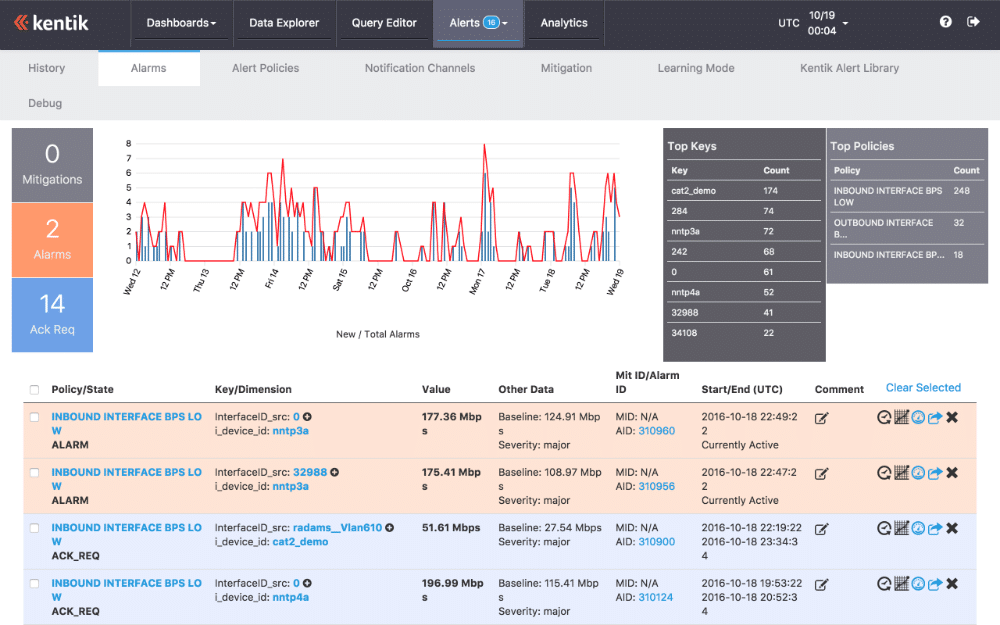
7. Kentik Detect
Kentik has some bold statements on their home page. They seem to have built their cloud-based application around being able to out-scale big data architecture along with being able to succeed where other similar applications fail and solve your network challenges.
Along with their contrast approach of being a pure SaaS (Software-as-a-Service) system. Kentik aims to capture multiple types of data, to provide a unified view of your data, and then provide interfaces to access the data and integrate it with their systems.
Kentik Detect is made up of two parts, one being the time-series database (Kentik Data Engine), and then there is their UI (Kentik Portal). The protocols that Kentik Detect uses include NetFlow, IPFIX, sFLOW, SNMP, and BGP. So, they still base their applications around the same protocols as the rest of the network monitors.
With Kentik Detect’s cloud-based approach, in the long run, it could give them a chance to have a good foothold in the future. The feature of continued scalability to always try and stay ahead of the market in today’s fast-growing network world of bandwidth collectors and monitors.
Now let us investigate Kentik Directs features and what and how they plan to fulfill their statements.
Using a Data Explorer permits for ad-hoc exploration of the collected data from the network and internet bandwidth. Making it super quick to drill down and filter through very high numbers of records, getting a view layout in tables and graphs.
With Kentik Detect, pick up internet routing issued, and the impact they have on performance thought their use of the NetFlow protocols at the same time optimize capacity and performance of the network. They are then protecting the company and its services from misuse and attacks on the network.
Through the categorization of the collected data, get a deep, rich look into the network and internets traffic by source and endpoint address, geo service type, ASN, and many more.
Kentik has added a feature that more proactively mitigates malicious attacks once they are accurately identified by automatically invoking a preset defensive action towards the attack.
Kentik Detect is using real-time synthetic monitoring approaches for internet, cloud, and hybrid networks with their trademarked Auto Test helping to see where your traffic is going.
This one will need a knowledgeable network administrator to understand and make use of the vast array of feature Kentik have incorporated in Detect, and this is far more suited to a company that is wanting to use cloud-based networks and storage of data for that is what this one is centered around.
There is a free trial that can be downloaded from Kentik’s website, but only have pricing on request of quote.
8. WhatsUp Gold
IPSwitch, now known as Progress, has built an application that has become a well-known feature-rich bag of tricks for monitoring networks and internet bandwidth yet has kept it simple enough to be labeled straightforward.
IPSwitch is packed with features that allow it to monitor and collect traffic data on Servers, virtual servers, cloud services, and applications with more.
It happens to be a windows-based application, with a simple setup coupled with an auto-detect for devices making the overall set up a breeze. The UI has multiple views with an interactive map of the network and the ability to drill down in order to investigate abnormalities and problems.
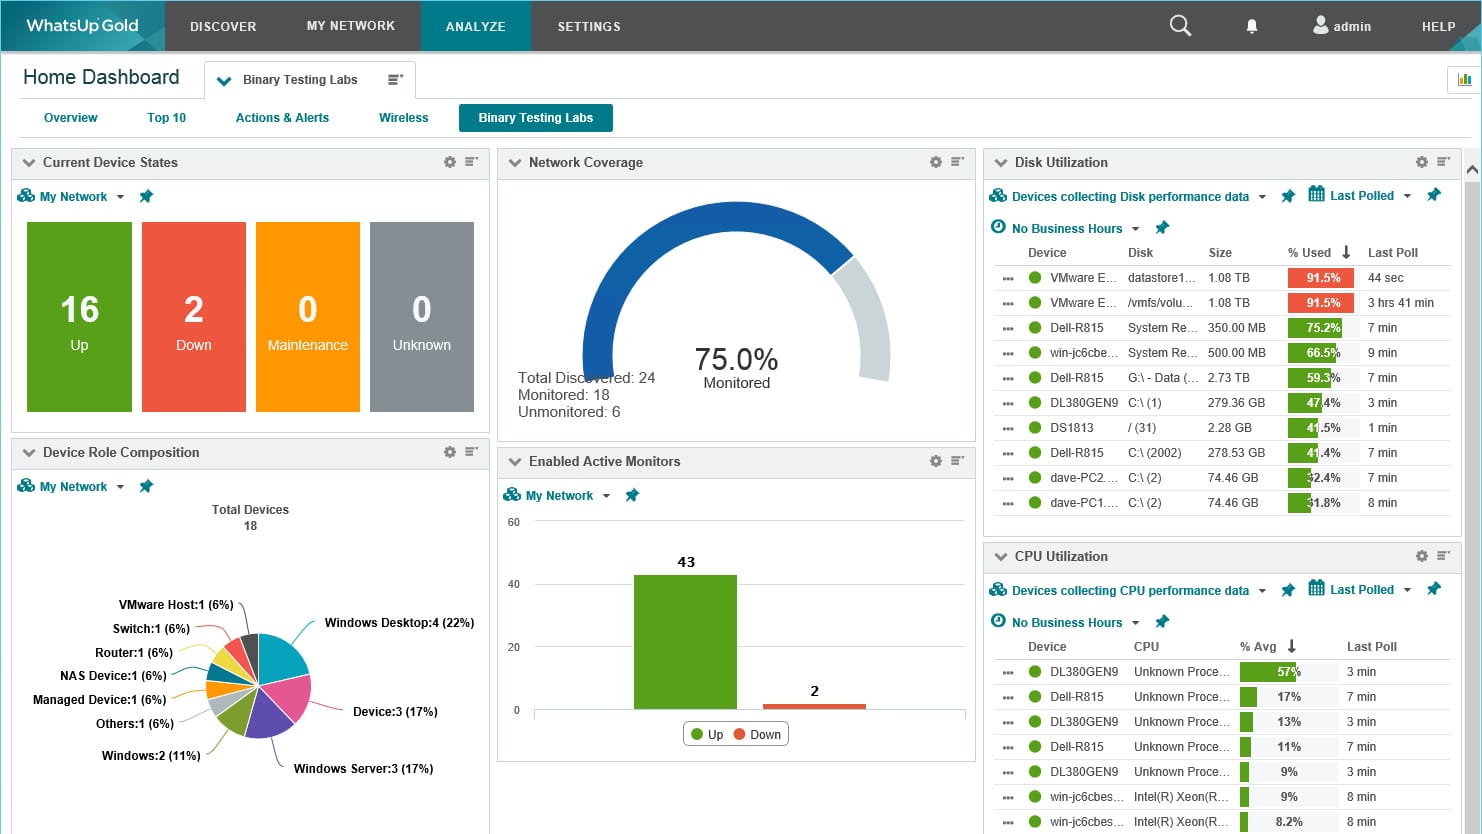
WhatsUp Gold’s list view in the interface shows all the discover hosts and devices then summarizes all their characteristics and status. The interactive map side of the interface is for visualizing the network nodes and components along with tier statuses while being able to drill down to inspect the performance values of the individual nodes.
WhatsUp Gold allows you to keep tabs on your network on the go with their powerful application. This application gives you easy access to see what devices are up and running, down for maintenance, or permanently down.
Whatsup Gold provides you with the ability to drill down on device details and solve issues from anywhere. The WhatsUp Gold app is both for iOS and smart Android devices.
Now let’s look into the details of WhatsUp Gold and see what makes this application so useful.
WhatsUp Gold has a powerful layer 2 and 3 discovery resulting in a detailed interactive map of the entire network infostructure and allowing you to monitor and map everything from the edge to the cloud, including all the physical nodes and virtual machines, applications, traffic flows, and configurations across Windows, LAMP(Linux, Apache, MySQL, PHP) and Java environments.
WhatsUp Gold has a new REST API offing a powerful suite of calls the lets you easily integrate network monitoring data with other systems along with letting you automate a wide range of network monitoring tasks as adding or removing devices.
With WhatsUp Gold performance and ease of task is high on the list of priorities the making the interface with intuitive workflows and easy customization helping you to reduce your MTTRs, Streamlining workflow on network monitoring by letting you initiate management tools directly from the interactive map.
WhatsUp Gold gives you detailed and actionable information on the network traffic and bandwidth consumption, helping to establish and enforce bandwidth usage policies, control ISP costs, and much more. All these features help to highlight the overall utilization of LAN, WAN, and the internet.
With WhatsUp Gold, you can track unauthorized bandwidth hogs like streaming or gaming. Detect and report on even traffic to and from the dark web (Tor). Being such a powerful application as this is, it would be an amazing tool for a network engineer or administrator and be an amazing asset to any company.
There is a free trial from their website, but as for pricing, there is a no-obligation quote.
Conclusion
To sum it up, we find that all of these applications do their job very well when it comes to being NetFlow Analyzers and collectors of internet and bandwidth usage and even complete network tools, thus why they are on the list.
However, there some that stand out with certain extra features, some that are quite a bit more advanced when it comes to set up and detection of devices, some that have been around a lot longer than others, and some with new to the market features, but in the end, it will always boil down to what your needs are as a company and what your administrator or engineer is comfortable using.
So, with that fact in mind, it will always level out the playing field between applications. The one nice thing is all seven of these applications have trial periods downloadable directly from their websites, and this allows you to use them before paying, so see which one will work best for your needs and comfort.
We hope this guide has helped you see a bit more into what these applications are, how they do what they do. Give them a try and see what will work best for your needs.