
In this article, we’ll review the Best Network Monitoring & Management Software & tools to help you Avoid and Minimize Downtime of Mission Critical Systems!
Here is our list of the top ten network monitoring tools:
- Auvik – EDITOR’S CHOICE This network monitoring and management package is delivered from the cloud and can support networks anywhere in the world through a single console. Available in versions for IT departments and managed service providers. Access a 14-day free trial.
- Paessler PRTG Network Monitor – FREE TRIAL A collection of infrastructure monitors that are called “sensors.” You tailor the package by deciding on which sensors to turn on. Runs on Windows Server. Download a 30-day free trial.
- Progress WhatsUp Gold – FREE TRIAL This on-premises monitoring platform is built around network device monitoring, with higher editions adding traffic analysis. Runs on Windows Server. Get a 30-day free trial.
- AdRem NetCrunch – FREE TRIAL An agentless monitoring tool that provides insights into different devices, processes, services, logs, events, and more, to enable you to make informed decisions. Start a 30-day free trial.
- ManageEngine OpManager – FREE TRIAL Excels in comprehensive Wi-Fi monitoring and adaptive alerts for seamless network management. Start a 30-day free trial.
- Site24x7 All-in-one Network Monitoring – FREE TRIAL A complete system monitoring platform that includes both network device monitoring and traffic analysis features. This is a cloud-based service. Access a 30-day free trial.
- ManageEngine Applications Manager – FREE TRIAL A performance monitor that tests website availability and response times plus other connection issues such as virtualizations and containers. Installs on Windows Server and Linux. Download a 30-day free trial.
- ManageEngine EventLog Analyzer – FREE TRIAL A comprehensive network security tool that automatically collects log data from multiple devices and analyzes them for issues. Start a 30-day free trial.
- SolarWinds Network Performance Monitor An SNMP-based network monitor that processes alerts raised by network devices when problems arise and includes an automatic network inventory and mapping function. Installs on Windows Server.
- Obkio A simple, yet extensive networking tool that collects and analyzes data from multiple sources to present them in a format that’s easy for everyone to understand.
- Nagios XI A paid infrastructure monitoring system that is based on the free Nagios Core; extend it with free plugins. Installs on Linux.
- Zabbix An impressive, free infrastructure monitoring tool that includes alerts for device problems. Installs on Linux, macOS, and Unix.
These products range from Free (open-source NMS) to Paid Commercial solutions that are On-Premise or Cloud-based.

Network Monitoring Software in a Nutshell
According to The Telegraph, on May 27th, 2018, British Airways, one of the largest airlines in the UK, experienced a network outage that caused their entire fleet to remain on the ground.
It was estimated that the outage left more than 75,000 passengers stranded and a cost €100 million due to compensation payments.
The failure that created such a significant loss was due to a human error at a power surge of the data center that left all IT infrastructure out.
Such is the impact of a mismanaged and unsupervised network. Although no Infrastructure or Network Monitoring software can prevent human error, it can at least provide quick alerting and proactive solutions, to avoid downtime.
Why its so Important for your Business
The network monitoring software is designed to keep the network under a systematic review by collecting metrics, logs, and other data from different elements.
It takes this data and compares it with an expected baseline (or threshold). If certain network metrics are below the baseline, the software can react with an alert, notification, or pre-defined action.
Some solutions might even provide self-healing and self-driving mechanisms using data analysis and responding proactively to the problem.
Using this approach, network monitoring tools can measure response time, reliability, availability, traffic, and even security.
They will let you know when there is a decrease in performance, an immediate fault that needs to be attended, or even when there has been a breach in the network security.
Basic Functionalities of a Network Monitoring tools should be to:
- Scan and detect networked devices with or without agents.
- Create a performance metrics baseline or threshold.
- Continuously monitor the performance of the entire network.
- Send alerts in case the network goes down or if a metric drops below.
- Recommend proactive solutions for known issues.
- Create visualizations and reports of the performance data.
Other advanced functionalities might include, infrastructure management, Application Performance Monitoring (APM), automation, visualizations, unified dashboards, and more.
Key Features to Look For
- Look for Monitoring and Management Since networks connect systems together, monitoring a network deals with much more than routers and switches. For example, the full stack of an application involves hardware, network, systems, services, storage, databases, and even real-user experience. Most of the time, the software that does Network Monitoring also provides some kind of Infrastructure Management and sometimes even Application Performance Monitoring (APM).
- Look for On-Premises Deployment Applications like network monitoring need to stay local. Yes, there are tons of benefits when it comes to the SaaS-based model, whether its low initial investments, no-hardware deployments, and even the access to robust analytics services on the cloud. But let’s not forget that SaaS or cloud-based systems are deployed far away from your on-premises and thus require you to have a 100% reliable and available Internet connection. A brief moment without Internet or limited connectivity will prevent all collected data from being uploaded to the server, and worst, it leaves the network admin without a management and monitoring interface. Other concerns of full SaaS-based solutions are big data transfers and data security.
- Look for Robust Dashboards that provide full visibility Network monitoring solutions with robust and unified dashboards will show you the network performance and its systems in real-time, through graphs, visualizations, inventories, maps, reports, and more. Some of these tools can even automatically discover all network elements, including its detailed information, and add it to the inventory.
- Look for Alerting and Reporting Capabilities What’s a monitoring solution for, if you are not getting the news? A simple Uptime/Downtime indicator with instant alerts/notifications can work wonders. But you can also look for advanced alerting systems that send instant messages via email, SMS, mobile apps notifications, or even sounds that keep you aware. Reporting is also a key functionality in monitoring solutions. A report would include all historical events, health, metrics, and in some cases, compliance-tailored information.
- Look for high-grade Compatibility Avoiding data silos and product lock-ins are the keys to flexibility. A product is valuable when it can work together with other systems. Look for flexible network monitoring tools that are compatible with third-party tools, that support multiple OS platforms, and that can monitor different vendors. In some cases, these tools come with monitoring templates crafted to specific vendors that can save you time in the configuration.
The Best Network Monitoring Software:
Below is a list of the top 20 network monitoring tools where you’ll find a Quick description of each tool along with some screenshots, where to download and some pricing!
These tools range from commercial, free, and open source. Some are appropriate for small-to-medium-businesses SMBs, while others can scale to enterprise networks.
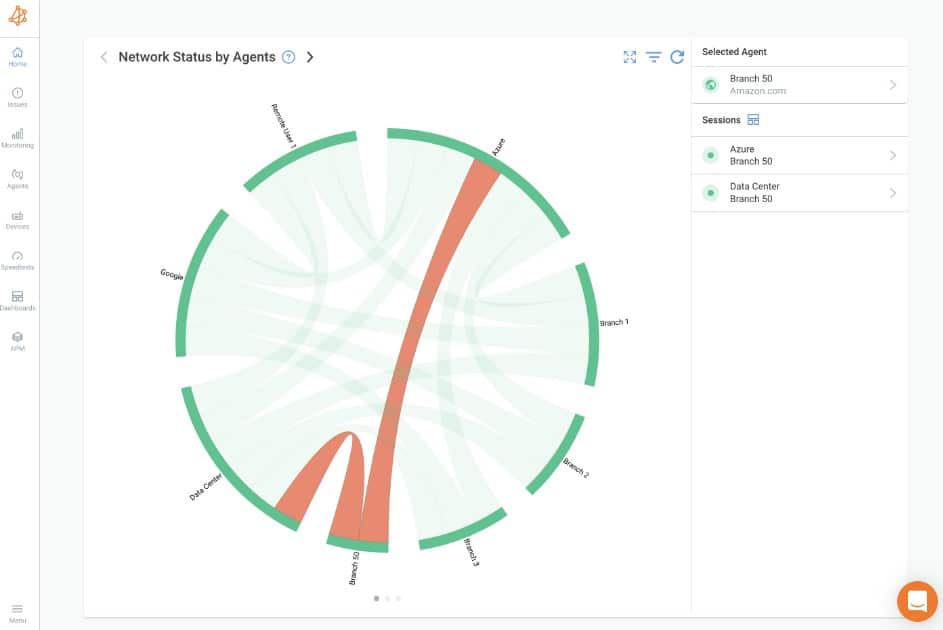
1. Auvik – FREE TRIAL
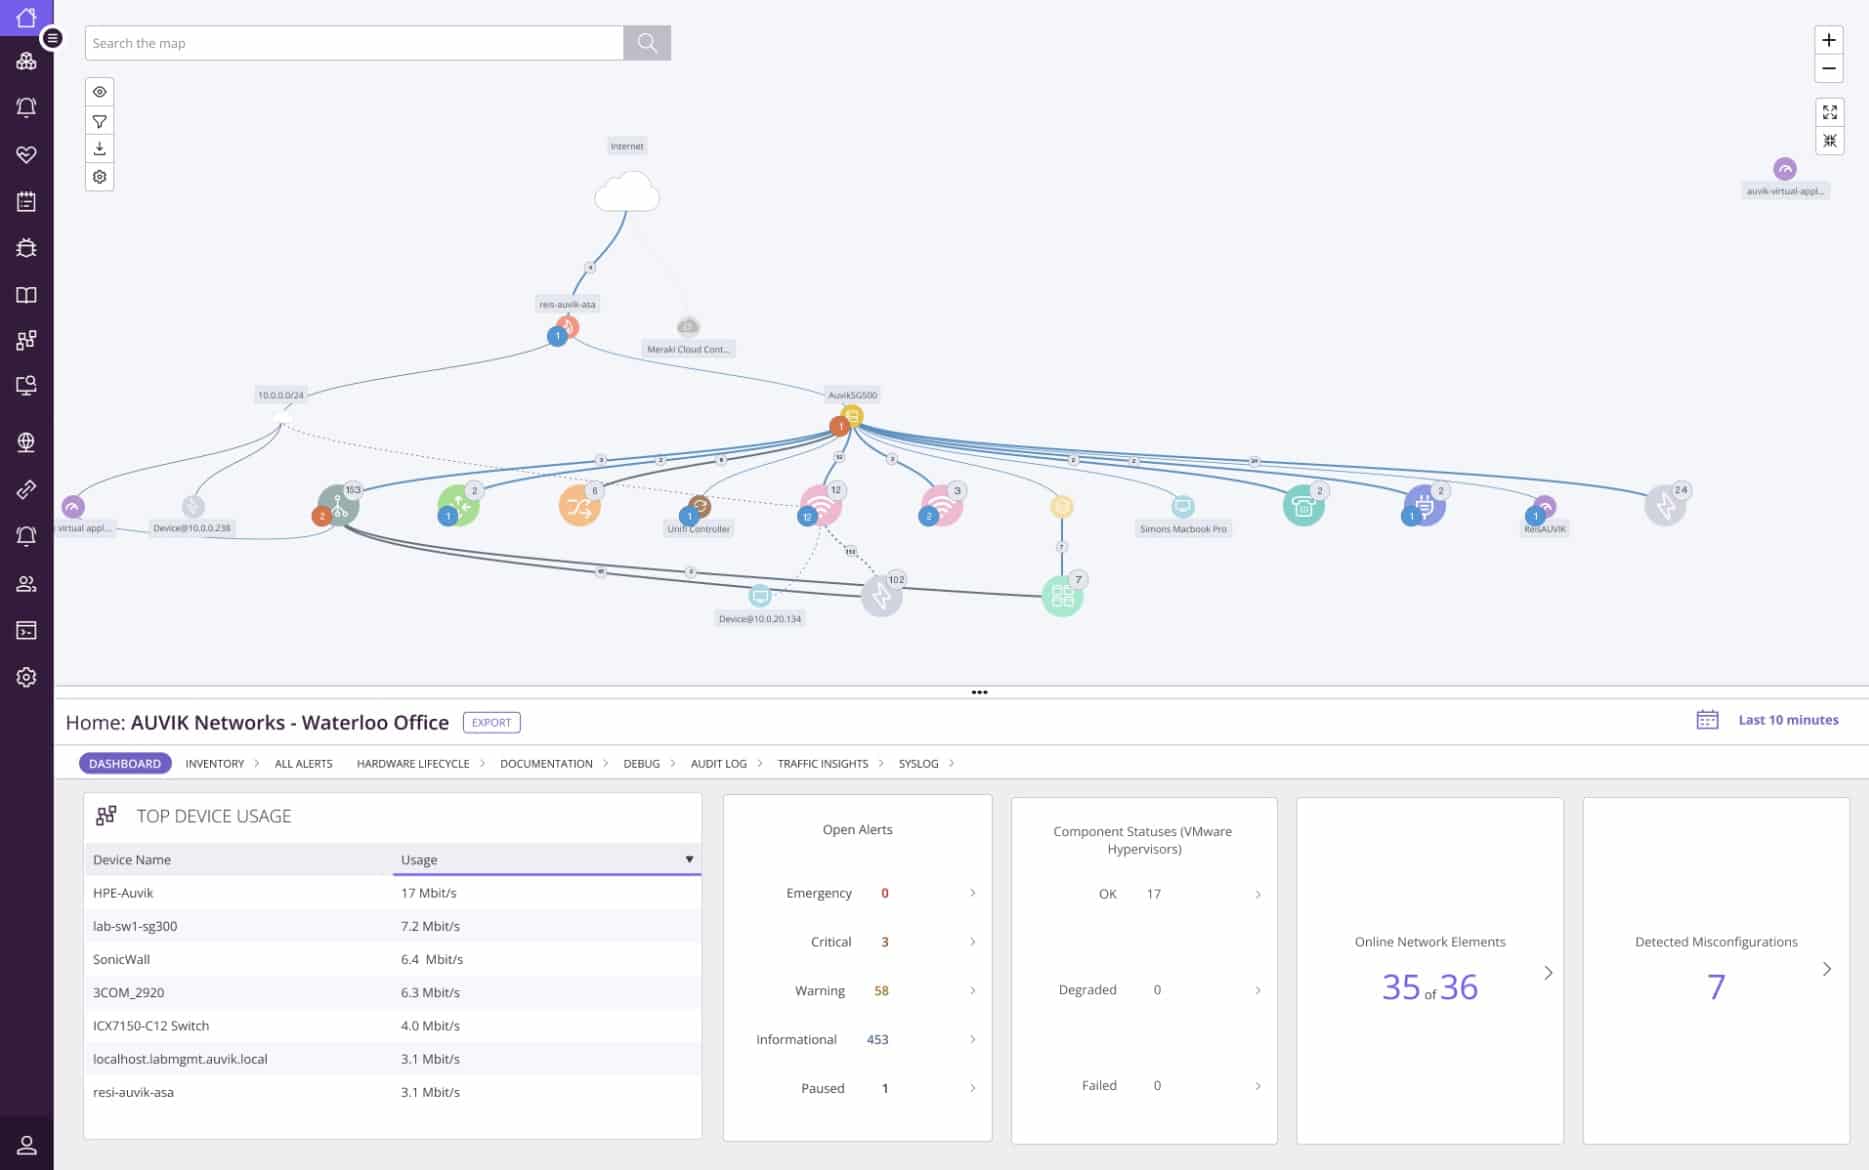
Auvik is a network monitoring and management package that provides network discovery, device status tracking, traffic analysis, and network configuration management. These four stands of the Auvik platform provide a high degree of automation, which increases the efficiency of technicians working for IT departments or managed service providers.
Key Features:
- Network discovery, inventory creation, and topology mapping
- Device status monitoring with the Simple Network Management Protocol
- Network traffic analysis with the NetFlow, IPFIX, J-Flow, and sFlow protocols
- Network configuration management that archives device settings
- Traffic generators analysis
- Support for network capacity planning
- Alerts for traffic anomalies or device failure
- Versions for managed service providers and IT departments
The Auvik cloud platform installs an agent on the network that is to be managed. This scans the network and uploads all of its discoveries. The Auvik server assembles an inventory and a network topology map in the account console. The discovery service repeats and keeps the inventory and map up to date.
The device status monitoring service is based on the Simple Network Management Protocol. This broadcasts a request for reports. All network devices are shipped with SNMP agents installed on them and they listen for a request. The Auvik unit periodically repeats its request and uploads responses to provide live monitoring feedback in the Auvik dashboard. Device agents are allowed to send out a warning if a fault develops on its device. This is interpreted into an alert in the Auvik dashboard.

Network traffic analysis is implemented with four flow protocols: NetFlow, IPFIX, J-Flow, and sFlow. Each device producer selects a specific protocol to track traffic statistics and these four are implemented on the vast majority of network devices in the world. The Auvik system can communicate with devices through all of these protocols simultaneously, enabling it to monitor multi-vendor networks. This unit of the package identifies traffic bottlenecks and device overloading, which can cause packet loss, jitter, and out-of-sequence packets.
The final unit in the package is its network configuration manager. This takes an image of the settings of each network device and stores it in a library. The tool then periodically compares current settings with the stored image for that device. If a change is detected, the tool reapplies the image to wipe out the unauthorized changes. This process will also automatically resolve damage or loss to network settings.
Auvik doesn’t publish a price, so you have to contact the business to request a quote. This is a cloud-based service so you sign up online and use the package through a Web browser. Get access to a 14-day free trial.
EDITOR'S CHOICE
Auvik is our top pick for network monitoring software because this package is based in the cloud and can monitor multiple sites through a single console. The package sets itself up through an autodiscovery process and provides thorough system documentation. It implements device status tracking with SNMP and network traffic analysis with the NetFlow, IPFIX, J-Flow, and sFlow protocols. The system identifies the causes of poor network quality and reveals solutions to improve performance without buying extra hardware. The network configuration management unit of the Auvik platform ensures system security, blocking intruder attempts to move around the network undetected.
Download: Access a FREE Trial
Official Site: https://www.auvik.com/features/#trial
2. Paessler PRTG Network Monitor – FREE TRIAL

PRTG Network Monitor by Paessler is a robust network monitoring and infrastructure management tool. Its flexible license and monitoring sensors make it an excellent choice for all types of network sizes. With PRTG, you can monitor any component within a network, from systems, hardware, apps, traffic, databases, wireless, storage, virtual, hardware, cloud services, security, IoT, and more.
Features:
- Distributed monitoring.
- Web interfaces for desktop, and mobile iOS and Android.
- Flexible alerting with email, pushes, and audio files.
- Cluster failover monitoring solution.
- In-depth scheduled or on-demand reporting.
- QR codes for quick monitoring from a mobile app.
Why do we recommend it?
Paessler PRTG Network Monitor impressed us with its extensive set of infrastructure monitors known as “sensors.” During our testing, the flexibility to customize these sensors allowed us to fine-tune the monitoring to our specific needs. The software, compatible with Windows Server, offered a seamless and user-friendly experience. The automatic network inventory and mapping features were particularly beneficial in swiftly identifying and resolving network issues.
Well-known for its hierarchical device views that outline performance data and alerts details at every level of the network, with this software, you can also create customized network maps along with its components and integrate them into your central dashboard.
The PRTG software runs on an x64 PC/server hardware, and it is supported by Windows Server 2019, Windows 10, or Windows Server 2012 R2.
Who is it recommended for?
Paessler PRTG Network Monitor is highly recommended for businesses and IT professionals seeking a versatile and customizable monitoring solution. The ability to tailor sensors to specific requirements makes it ideal for environments with diverse monitoring needs. Its compatibility with Windows Server also positions it well for organizations with a Windows-centric infrastructure.
The PRTG license depends on the number of monitoring sensors. It is 100% free for up to 100 sensors. For the commercial licenses PRTG500 ($1600), PRTG1000 ($2850), PRTG2500 ($5950), PRTG5000 ($10500), PRTGXL1 ($14500), and PRTG XL5 ($60000). Access a 30-day free trial download.
3. Progress WhatsUp Gold – FREE TRIAL
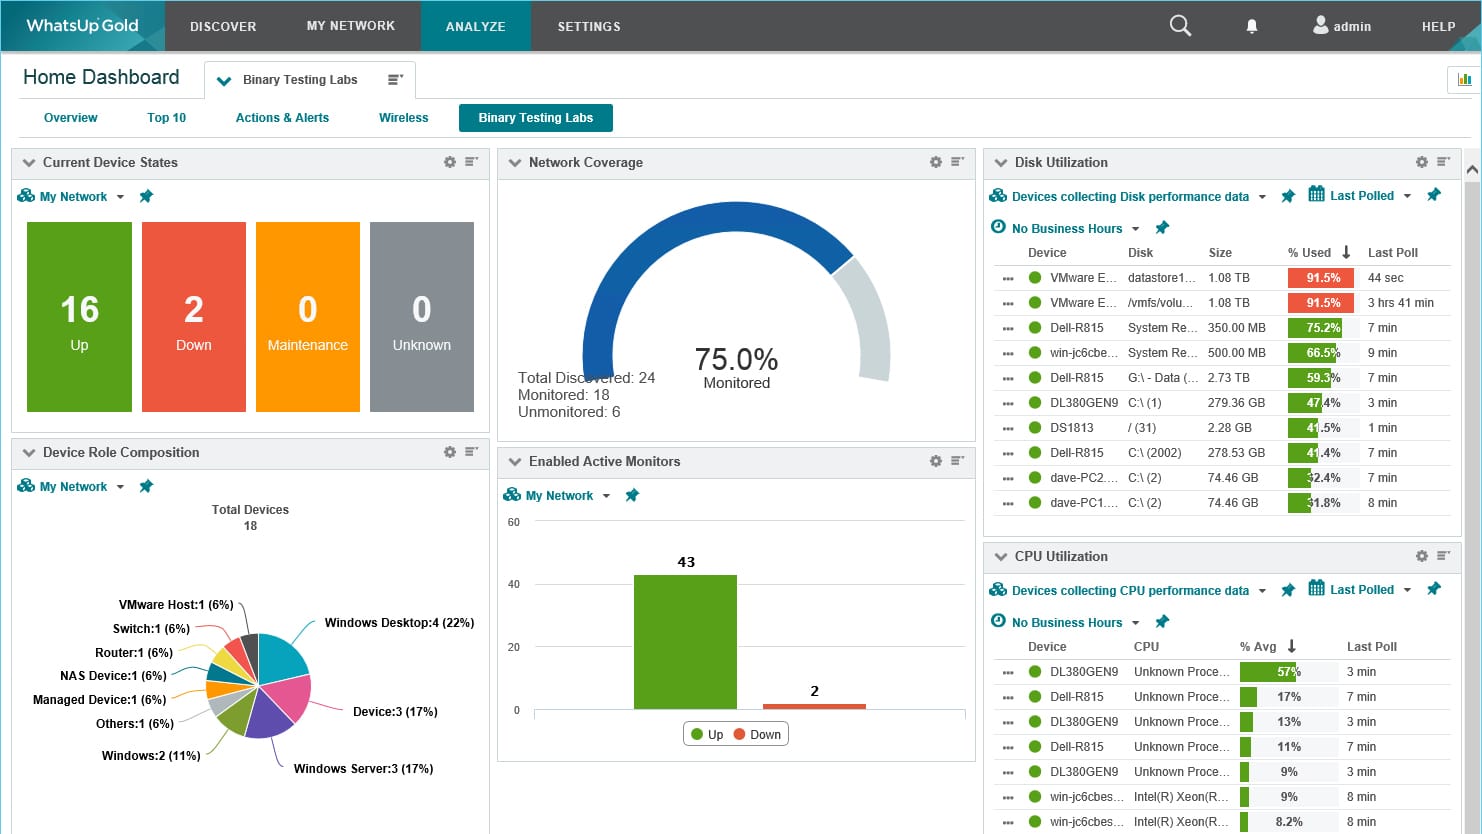
Progress WhatsUp Gold is a broad monitoring suite whose core function is network device monitoring. The starting package configures itself by running a discovery process that identifies connected devices, records them, and builds a network map. That discovery cycle continues in the background, refreshing the console automatically whenever changes are detected.
Key Features:
- Automatic network discovery
- Builds a hardware inventory
- Entry package with larger editions available
- Optional network traffic analysis
- Continuous monitoring
- Uses Simple Network Management Protocol
Why do we recommend it?
During our extensive testing of WhatsUp Gold, we found it to be an excellent IT infrastructure management solution. One key problem it solved for us was efficiently monitoring the performance of applications and web servers. This capability allowed us to analyze bandwidth consumption, identify and address network performance issues, and ensure the optimal functioning of our IT infrastructure.
Organizations that move up to the higher editions also get the Network Traffic Analysis component and its data collector, Flowmon. That module can work across mixed-vendor environments because it supports the different flow standards used by networking hardware from different manufacturers, including NetFlow, IPFIX, J-Flow, sFlow, and NetStream.
Who is it recommended for?
WhatsUp Gold is highly recommended for IT professionals and network administrators who need a comprehensive solution for managing IT infrastructure. It is suitable for organizations of various sizes, including small businesses, medium-sized enterprises, and larger corporations. WhatsUp Gold offers a range of editions, making it adaptable for different business needs. Whether you’re monitoring on-premises infrastructure or extending your monitoring to public clouds like AWS and Azure, WhatsUp Gold provides the tools to effectively manage and monitor your entire IT environment.
The broader Progress package also extends into monitoring for servers, storage, databases, virtual environments, internet links, and cloud services. Businesses that only want network monitoring can stay with the base Business edition. WhatsUp Gold runs on Windows Server, and the platform is available on a 30-day free trial.
4. AdRem NetCrunch – FREE TRIAL
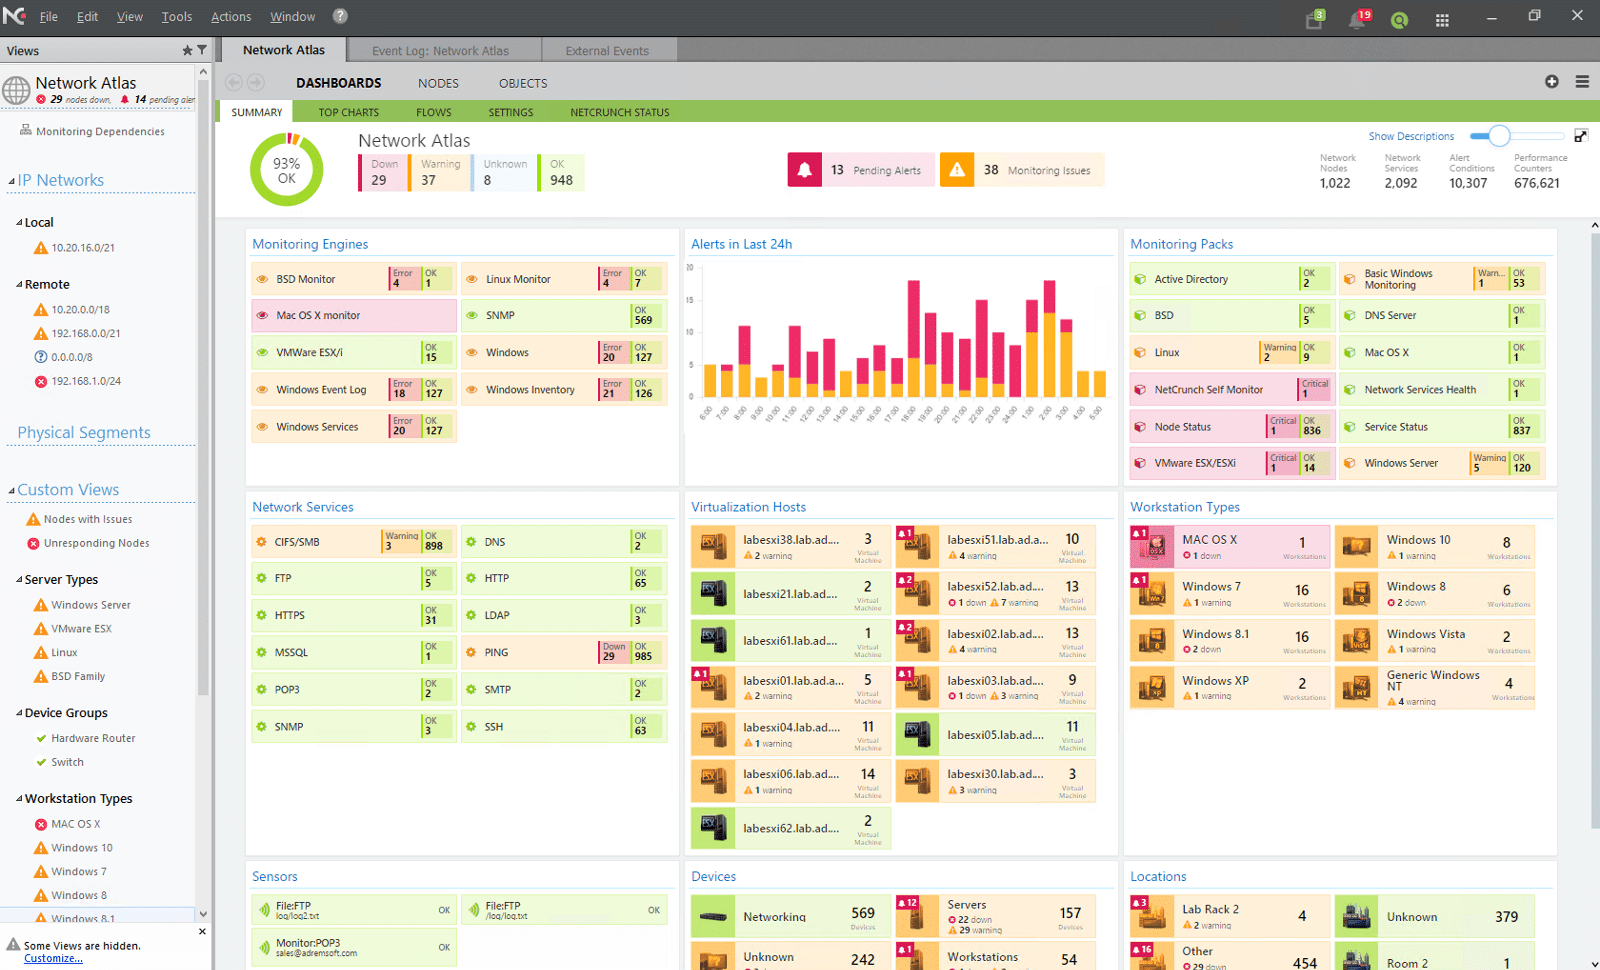
AdRem NetCrunch is a modular and agentless platform for monitoring the hardware and software components in your network. It handles every aspect of your network, providing a holistic picture of the health and performance of your network. Its visual presentations and dashboards make it easy to drill down as well.
Key Features:
- Offers visibility into configurations, services, logs, events, and more.
- Comes with 680+ targets for monitoring components out of the box.
- Automatically discovers and maps devices on your network.
- Integrates with other applications through REST APIs.
- Generates relevant alerts.
- Supports the execution of remote actions and scripts.
Why do we recommend it?
We recommend NetCrunch because it is comprehensive. It comes with 680+ templates for monitoring straight out of the box. Additionally, you can create new templates or customize existing ones for monitoring anything, from factory equipment to routers and switches. Also, it automatically discovers devices and installs monitoring packs on them to collect data. This data is further analyzed to provide the insights you need about your network.
The analyzed data is presented across a wide range of dashboards, presentations, visual graphs, and reports for easy understanding and efficient decision-making.
Who is it recommended for?
It is recommended for organizations with mixed environments and those that want to monitor all components and services in their network. It can also come in handy for network engineers who need complete visibility into their environments.
With such features, NetCrunch can be a handy addition to any organization. Watch a demo to get a better idea of its capabilities. Start with a 30-day free trial.
5. ManageEngine OpManager – FREE TRIAL
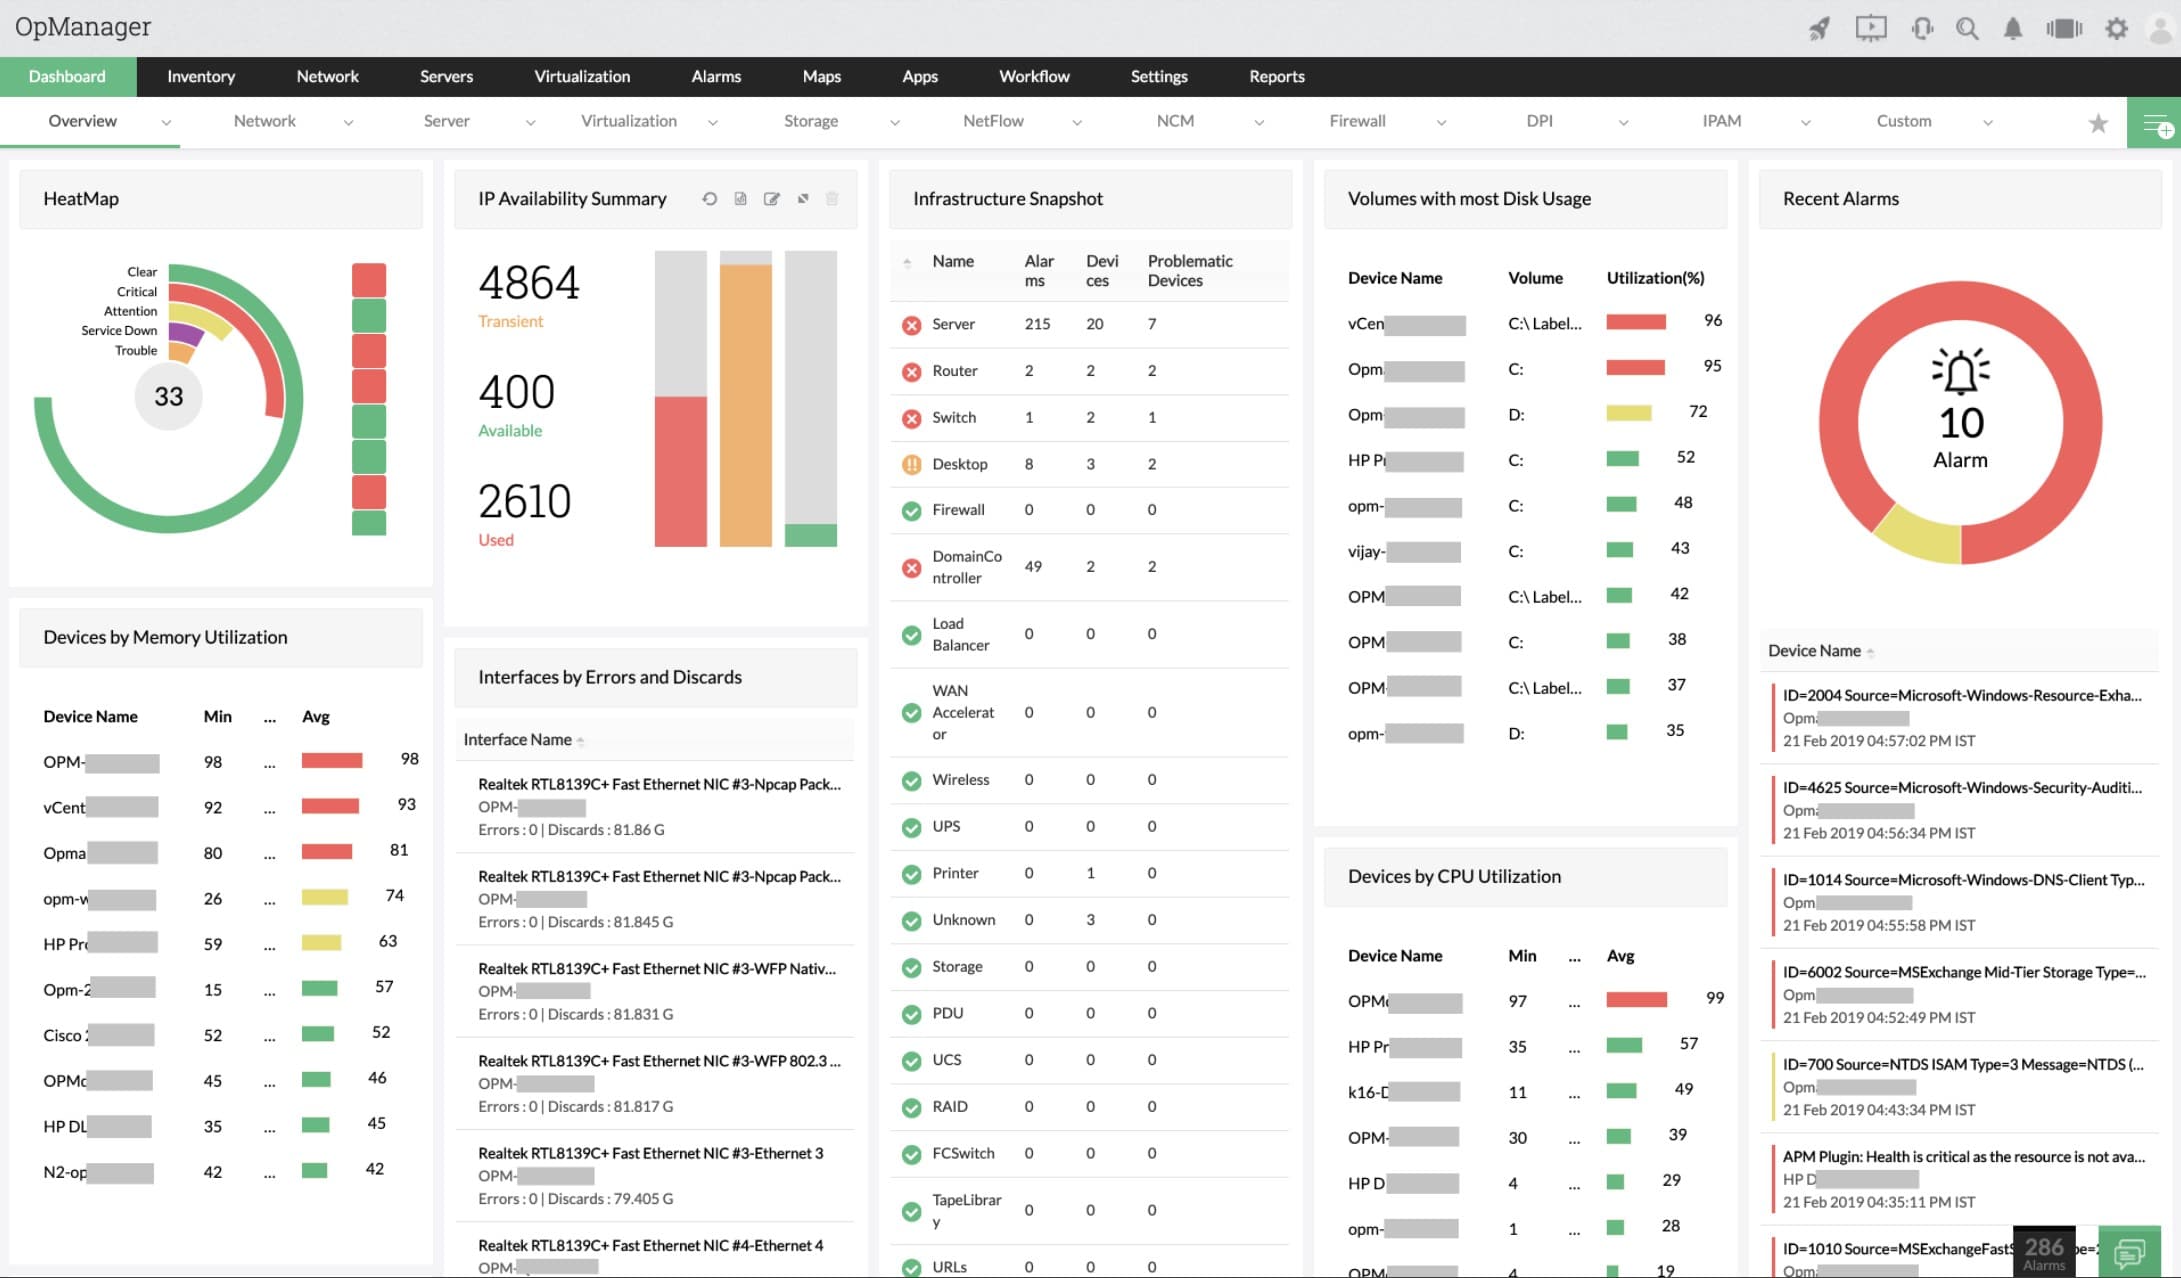
ManageEngine OpManager is a comprehensive network monitoring tool that provides in-depth visibility into the health, availability, and performance of any IP-based device in real-time. It enables IT administrators to monitor network services and visualize system performance, offering detailed insights into various network components. With capabilities to monitor both physical and virtual servers, including Hyper-V, VMware, Citrix, Xen, and Nutanix HCI servers, OpManager ensures optimal server performance around the clock.
Key Features:
- Wi-Fi Signal Monitoring: Provides consistent Wi-Fi performance by tracking signal-to-noise ratio and signal strength.
- Network Utilization Tracking: Monitors the load on Wi-Fi components, including the number of connected clients and usage patterns.
- Traffic Analysis: Analyzes Wi-Fi network traffic metrics such as bytes transmitted and received, and transmission rates.
- Resource Utilization Monitoring: Assesses CPU and memory usage to ensure optimal network resource management.
- Adaptive Threshold Alerts: Offers threshold-based alerts for emerging network issues, enabling prompt troubleshooting.
Why do we recommend it?
ManageEngine Applications Manager proved valuable in our testing, offering performance monitoring with a focus on website availability, response times, and connection issues such as virtualizations and containers. The software’s installation on both Windows Server and Linux provided flexibility.
Additionally, it offers extensive monitoring of wireless networks, WAN links, and Cisco ACI infrastructures, providing a complete view of network health. The tool’s advanced network visualization features, such as Layer2 Maps and 3D floor views, enhance network management and troubleshooting. By integrating multiple network management functions into a single interface, OpManager simplifies the process of diagnosing and resolving network issues efficiently.
Who is it recommended for?
ManageEngine Applications Manager is recommended for enterprises and businesses with a focus on website performance. IT professionals responsible for monitoring virtualizations and containers will find its features valuable. The availability on both Windows Server and Linux caters to diverse infrastructure preferences.
Start by downloading a 30-day free trial.
6. Site24x7 All-in-one Network Monitoring – FREE TRIAL

The Site24x7 All-in-one plan includes network server, and application monitors. The network monitoring part of this package starts its service by discovering all of the devices connected to a network. This compiles a network inventory, which is derived from SNMP device status requests. As the SNMP status poll is a repetitive process, the network inventory gets updated automatically whenever there are changes in the infrastructure of the network. The service also draws up a network topology map from the inventory data.
Key Features:
- No set up costs or maintenance tasks
- Automatic network device discovery
- Automatically updated network topology map
- Constant monitoring with SNMP
- Alerts for performance problems
- Traffic volume monitoring
- Capacity planning support
- Log file management
Why do we recommend it?
Site24x7’s All-in-one Network Monitoring impressed us as a comprehensive system monitoring platform. Our testing revealed its effectiveness in monitoring network devices and analyzing traffic. As a cloud-based service, it provided flexibility and accessibility.
The SNMP device monitoring service also processes Trap messages from device agents into system alerts. These can be forwarded as notifications to technicians by SMS, email, voice call, or instant messaging post. The network monitor also raises alerts if any of the system resources get overstretched or if performance drops below an acceptable level.
The All-in-one plan’s network monitor is also able to perform bandwidth analysis. It shows live traffic volumes on each link on the network and alerts when they approach full capacity.
This is a cloud-based service and the console for it is accessed through any standard Web browser. The service will install an agent on one of your servers to collect data from your network.
Who is it recommended for?
Site24x7 All-in-one Network Monitoring is recommended for businesses and enterprises looking for a cloud-based solution. Its all-in-one approach, combining network device monitoring and traffic analysis, is beneficial for IT professionals managing diverse IT environments. The cloud-based nature ensures accessibility and scalability.
The All-in-one plan is available in four editions:
- Pro $35 per month
- Classic $89 per month
- Elite $225 per month
- Enterprise $449 per month
Download a 30-day free trial of the Pro edition.
7. ManageEngine Applications Manager – FREE TRIAL

ManageEngine Applications Manager is primarily concerned with applications but many of its functions also focus on network and internet connection performance. Services covered by the Applications Manager include virtualization performance created by VMWare, Hyper-V, Citrix, Oracle VM, Red Hat virtualizations, and Dynamic Provisioning. The system also monitors containers developed through Docker, Kubernetes, and Openshift.
Key Features:
- Connection performance tests
- Virtualization monitoring
- Container activity tracking
- Virtual and physical server monitoring
- Website availability and response time monitoring
Why do we recommend it?
ManageEngine Applications Manager proved valuable in our testing, offering performance monitoring with a focus on website availability, response times, and connection issues such as virtualizations and containers. The software’s installation on both Windows Server and Linux provided flexibility.
The Applications Manager is particularly string sat monitoring website performance, including tests on the response times and availability of websites. These are network-linked issues that can be explained by poor internet service. The dashboard of the Applications Manager includes root cause analysis That can trace performance problems right down to the connections.
Who is it recommended for?
ManageEngine Applications Manager is recommended for enterprises and businesses with a focus on website performance. IT professionals responsible for monitoring virtualizations and containers will find its features valuable. The availability on both Windows Server and Linux caters to diverse infrastructure preferences.
The Applications Manager software is available for Windows Server and Linux. There are two paid editions of Applications Manager. The Professional edition will track up to 500 Applications for a price of $945 per year. The Enterprise edition will monitor up to 10,000 application statuses at a price of $9,595.
There is a 30-day free trial available and also a Free edition that allows five applications to be monitored.
8. ManageEngine EventLog Analyzer – FREE TRIAL

ManageEngine EventLog Analyzer is a network security tool that gathers log data from a wide range of devices and analyzes them to identify any patterns or insights that could signal potential issues or anomalies. It also comes with many predefined reports that provide information about switch connections, configuration changes, traffic patterns, logon trends, firewall auditing, and more.
Key Features:
- Identifies complex attack patterns and indicators of compromise.
- Leverages global threat exchange databases to identify known and zero-day attacks.
- Supports forensic analysis to recreate incidents.
- Checks analyzed data against 30+ predefined correlation rules.
- Offers predefined workflows for efficient incident response.
Why do we recommend it?
We recommend ManageEngine EventLog Analyzer for its comprehensive approach to network monitoring and security. It leverages AI and ML algorithms to monitor, record, and analyze network events, and identify known vulnerabilities and zero-day attacks. It can also correlate the data to identify patterns and integrate with third-party threat intelligence feeds to help you proactively prevent zero-day attacks.

Another highlight of this tool is its real-time alerts. It analyzes every pattern with predefined correlation rules and sends alerts when there is a match. As a result, you can address issues before they impact users. We also love its custom workflows that enable you to respond quickly to incidents. Its well-designed interface and reports are another reason to pick this tool.
Who is it recommended for?
It is recommended for network engineers, IT administrators, and MSPs who are responsible for ensuring the security and performance of networks.
EventLog Analyzer has custom pricing, where the cost depends on the number of log sources, endpoints, and cloud accounts.
Download a 30-day free trial to get started.
9. SolarWinds Network Performance Monitor

SolarWinds is one of the leading IT management and monitoring software developers in the market, and SolarWinds Network Performance Monitor (NPM) is one of their signature products. NPM is one of the most robust and scalable network monitoring tools. Although it works for small networks, its functionality is suited for medium-to-large networks.
Key Features:
- Compatible with multiple network vendors.
- Create advanced customized alerts and reports.
- Generate network path visualizations with NetPath.
- Analyze performance with the PerfStack dashboard.
- Create intelligent maps, graphs, and charts.
- Monitor interfaces, wireless, hardware, etc.
Why do we recommend it?
SolarWinds Network Performance Monitor proved invaluable during our testing with its SNMP-based monitoring, processing alerts from network devices. It addressed critical issues promptly, offering automatic network inventory and mapping functions. The software’s installation on Windows Server ensured seamless integration into our existing infrastructure.
This product aims at checking the health and performance of all the devices in the network, including routers, switches, workstations, mobiles, servers, storage, etc. This product is best known for is highly flexibly alerting system that allows you to combine network data sources. NPM is also known for its easy troubleshooting with the NetPath and PerfStack modules.
The on-premises solution can only be installed in Windows Server 2016 and Windows Server 2019. You can also deploy it on AWS or Azure public cloud.
Who is it recommended for?
SolarWinds Network Performance Monitor is recommended for enterprises seeking a comprehensive network monitoring solution. Its ability to process alerts and provide automatic inventory makes it suitable for IT professionals managing large-scale networks. The Windows Server installation caters to environments with a Windows-centric infrastructure.
Access a fully functional 30-day free trial of NPM.
10. Obkio
Obkio offers end-to-end visibility into your network’s components and devices to help pinpoint issues accurately. It can find the insights required for troubleshooting from all the corners of the network, including every service, device, application, end user, process, and more.
Key Features:
- Uses agents to monitor different metrics in your network.
- Supports all environments, including WAN, LAN, cloud, decentralized networks, and more.
- Offers templates to speed up the monitoring process.
- Measures extensive metrics. Also, uses synthetic traffic to monitor key aspects without packet captures.
- Leverages SNMP to monitor devices.
- Taps into traceoute for network path discovery and analysis.
- Highlights network issues backed by data.
Why do we recommend it?
We recommend Obkio for its extensive monitoring coverage, which provides detailed insights into every issue in your network. Armed with this information, your network administrators can quickly and efficiently fix issues before they create a major impact on your organization.
Moreover, all the insights are displayed in an intuitive interface, making it easy for people of all backgrounds to better understand the status of your network. Whether it is network administrators or executives responsible for making decisions, Obkio’s insights can help everyone.
One aspect that we love about this tool is that it focuses on both the hardware and software metrics to provide a unified view of everything happening in your network.
Who is it recommended for?
It is recommended for network administrators, C-level executives, and anyone who needs detailed information about the performance of their networks. It can provide information about the entire infrastructure, and at the same time, drill down into specific components as well. Such detailed information also comes in handy for MSPs.
Obkio’s base Starter Plan is priced at $224 per month when paid annually. They also have a Basic, Premium, and Custom Enterprise plans. Start a 14-day free trial.
11. Nagios XI

Nagios is originally an open-source network monitoring software that has supported thousands of other projects within the community. The software helps SMBs and Enterprise-size businesses find and solve IT infrastructure issues.
Key Features:
- Powered by the powerful Nagios Core 4 monitoring engine.
- Customizable web interface.
- Visibility Of Network Components And Monitoring Data.
- Automatic capacity planning graphs.
- Auto-discovery, auto-decommissioning, and mass acknowledgments.
- Configuration snapshots.
Why do we recommend it?
Nagios XI, derived from the open-source Nagios Core, proved its worth when put through its paces. The system’s capability to extend its functionality with free plugins was a standout feature. It played a crucial role in quickly identifying devices on our network and assessing their performance. This allowed us to address potential bottlenecks promptly, ensuring smoother network operations. The Linux-based installation provided a robust foundation for our infrastructure monitoring needs.
Nagios XI can virtually monitor any application or system with the help of third-party add-ons, provided by the open-source community. The NagiosXI can keep track of the network, servers, applications, databases, operation systems, system metrics, protocols, etc., all from a central server.
Nagios XI is supported by the following Linux distributions; RHEL, CentOS, Oracle Linux, Debian, and Ubuntu.
Who is it recommended for?
Nagios XI is best suited for network engineers seeking a comprehensive solution for monitoring and optimizing network performance. It proved invaluable in detecting issues like congestion, packet loss, or device failures. Security teams can also benefit from Nagios XI for intrusion detection and monitoring security-related events. It caters to advanced users and IT professionals with experience in system administration and network monitoring.
The standard paid edition for Core XI starts at $1,995 for 100 monitoring nodes, and the Enterprise Edition starts from $3,495. Download the full 60-days-trial version of Nagios XI.
12. Zabbix
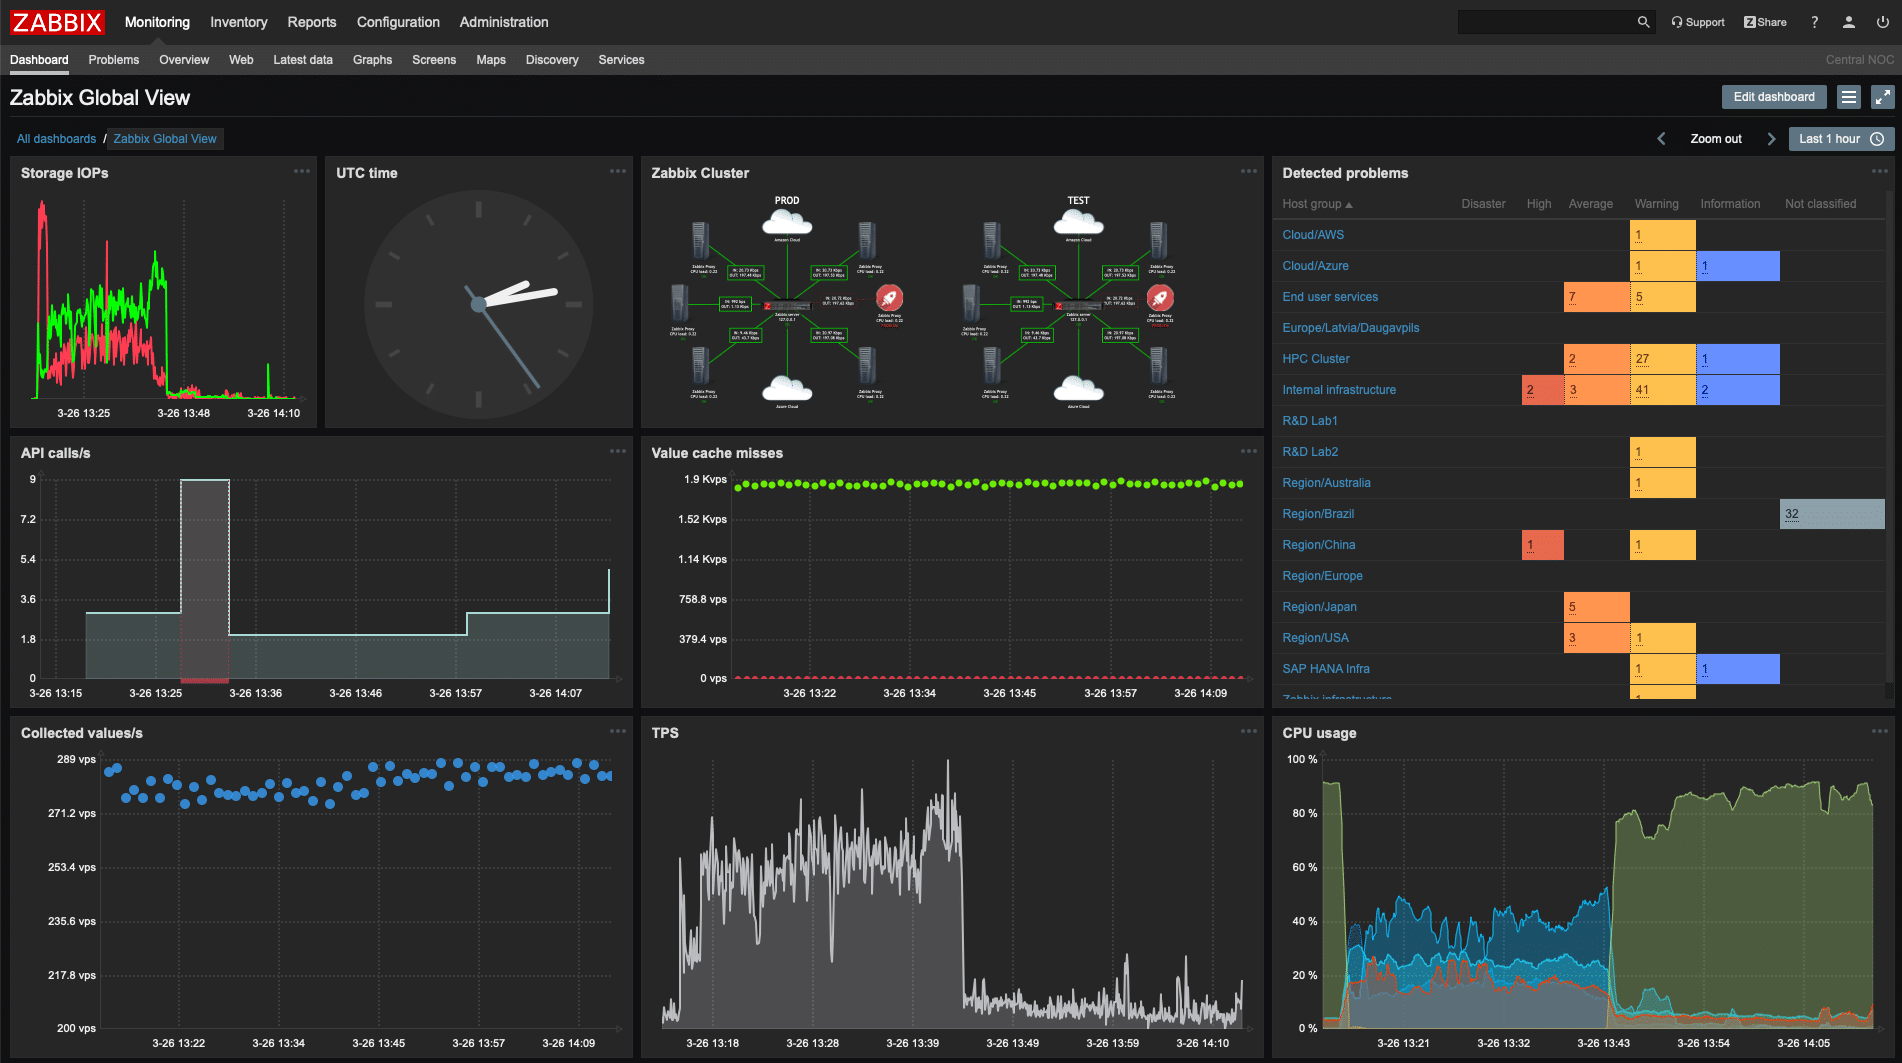
Zabbix is an open-source network monitoring and management solution. It lets you keep track of your entire IT infrastructure, including network, servers, hardware, apps, VMs, databases, and more. Zabbix is well known for its scalability. It is powerful enough to monitor SMB networks or small enterprises well below 10,000 nodes.
Features:
- Customizable Web-GUI.
- Out-of-the-box templates.
- Agent and agentless monitoring.
- Anomaly detection and trend prediction.
- Single-pane-of-glass with graphs, visualizations, and dashboard.
- Advanced notification and remediation system.
Why do we recommend it?
Zabbix, an open-source network monitoring and management solution, impressed us with its scalability and powerful trending mechanisms. During testing, the software showcased its ability to predict trends based on historical data, providing valuable insights into network traffic behavior. The active user community, coupled with excellent forum support, contributed to a positive experience.
One of the features that draw a lot of attention is its powerful trending mechanisms. Zabbix can predict trends based on network traffic. It takes historical data and real-time analytics and forecasts future traffic behavior. Another advantage of Zabbix is that it has a worldwide active user community with a fantastic forum and documentation.
Who is it recommended for?
Zabbix is an ideal choice for those managing SMB networks or small enterprises with scalability needs below 10,000 nodes. Its flexibility in supporting various operating systems, including Linux, FreeBSD, macOS, Solaris, and Windows, makes it versatile for different environments. The robust trending mechanisms make it suitable for organizations focused on proactive network management.
Zabbix is free and open-source. If you are using Zabbix in a commercial context, you can purchase a level of support. Download it free Zabbix.
13. LogicMonitor

LogicMonitor is a SaaS-based network monitoring and APM software. It comes with over 1000 pre-built mechanisms that automate monitoring and alerting for the IT infrastructure and applications. With LogicMonitor, you can keep track of cloud services, such as AWS and Azure, on-premises IT infrastructure (networks, containers, apps, databases, servers), and even hybrid environments.
Key Features:
- Automatic device discovery.
- Collect Netflow, J-Flow, sFlow, and IPFIX data.
- Measure and visualize website performance.
- Flexible alerting and real-time dashboards.
- Collect and manage network device configuration.
Why do we recommend it?
LogicMonitor, a SaaS-based network monitoring and APM software, impressed us with its automation and over 1000 pre-built mechanisms. During testing, the software demonstrated its effectiveness in automating monitoring and alerting for IT infrastructure and applications. The ability to monitor cloud services, on-premises infrastructure, and hybrid environments showcased its versatility.
This solution does not use any agents; instead, it uses the LogicMonitor Collector, which is an application running on-premises. The Collector uses common monitoring protocols to retrieve performance metrics from the devices; it then encrypts the data and sends it to the LogicMonitor servers over an SSL connection.
LogicMonitor works great with locations that have multiple and reliable access to the Internet. Loss in Internet connectivity will prevent uploading of collected data to the LogicMonitor server.
Who is it recommended for?
LogicMonitor caters to organizations with multiple and reliable access points to the Internet. It is suitable for monitoring cloud services like AWS and Azure, on-premises infrastructure, and hybrid environments. The SaaS-based model and extensive automation features make it a valuable choice for organizations focused on seamless monitoring and alerting.
LogicMonitor comes through three different editions, the Starter, Pro, and Enterprise. For more information on pricing, request a quote. Sign up to LogicMonitor to get a 14-days free trial.
14. Icinga

Icinga is another open-source IT infrastructure monitoring software. It was created by a group of developers from the Nagios open-source community. Icinga extends many of Nagios features, adds a web-interface, and pushes more regular updates.
Features:
- Custom views over a web user interface.
- Integrates with vSphere.
- Certificate monitoring.
- Threshold analysis.
- Advanced reporting and alerting capabilities.
Why do we recommend it?
Icinga 2, an open-source IT infrastructure monitoring software, proved to be a worthy successor to Nagios Core during our testing. The web interface, advanced host and application monitoring capabilities, and regular updates were notable strengths. It effectively integrates on-premises data centers and cloud infrastructure, providing a comprehensive monitoring solution.
Icinga’s monitoring engine can keep track of the entire on-premises data center and the infrastructure deployed on the cloud. It integrates all monitored data and sends it to the cloud over a secure SSL connection.
Icinga is well known for its advanced host and application monitoring capabilities and basic metrics alerting.
Who is it recommended for?
Icinga 2 is recommended for organizations seeking an open-source solution with advanced monitoring capabilities. Its web interface, vSphere integration, certificate monitoring, and threshold analysis make it suitable for various monitoring needs. The regular updates and strong community support contribute to its appeal for organizations of different sizes and technical requirements.
Download Icinga from its official repositories.
15. Spiceworks Network Monitor

Spiceworks Network Monitor is one of the only Network Monitoring and Infrastructure Management solutions that is 100% free and not open-source. Spiceworks is fully supported by ads and through extensible third-party products. Although the software is free, it still provides solid network monitoring capabilities.
Features:
- Configure access controls and permissions.
- Manage capacity, compliance, and inventories.
- Audit network issues.
- Schedule maintenance and patches.
Why do we recommend it?
Spiceworks Network Monitor, being a 100% free network monitoring and infrastructure management solution, proved valuable during our testing. It efficiently monitored servers and SNMP-enabled devices, providing real-time insights into network performance. This solution is an excellent choice for SMBs, offering solid network monitoring capabilities without any cost. It allowed us to manage capacity, compliance, and inventories effectively.
It is an all-in-one monitoring solution that is often the one-stop for many SMBs that are looking to keep an eye on their infrastructure. The monitoring engine provides real-time monitoring for servers and SNMP-enabled devices such as routers, firewalls, and switches.
Spiceworks Network Monitor is supported by Ubuntu, Debian, Windows, and macOS.
Who is it recommended for?
Spiceworks Network Monitor is recommended for small and medium-sized businesses (SMBs) that are looking for a free and comprehensive solution to monitor their infrastructure. It is suitable for those who prioritize a cost-effective approach without compromising on essential monitoring capabilities. SMBs can leverage Spiceworks Network Monitor to audit network issues, schedule maintenance, and manage their infrastructure efficiently.
Spiceworks products are 100% free, including support. Download the free Spiceworks Network Monitor tool.
16. ConnectWise Automate

ConnectWise Automate, formerly known as LabTech, is a remote network monitoring and infrastructure management software (RMM) with strong automation capabilities. It can automatically discover assets, schedule automatic patch deployment, and automatically find and fix specific issues with pre-defined actions.
Key Features:
- Automatic patch management.
- Asset automatic discovery.
- Endpoint management.
- More than 500 out-of-the-box monitors.
- Over 400 scripts for self-healing.
- Proactive maintenance.
Why do we recommend it?
ConnectWise Automate, formerly known as LabTech, stood out during our testing due to its remote network monitoring and robust infrastructure management capabilities. It solved the challenge of automating routine tasks, such as asset discovery and patch deployment. This automation, combined with more than 500 out-of-the-box monitors and proactive maintenance features, allowed us to streamline operations and enhance overall efficiency.
The software can also detect all devices within the network, including their status, and quickly create access to all managed devices. ConnectWise Automate also comes with endpoint management. You can access all devices from a single place and resolve issues faster.
The software uses lightweight agents installed on each client that monitor specific metrics on the device and other metrics specific to the subnet.
Who is it recommended for?
ConnectWise Automate is recommended for managed service providers (MSPs) and IT professionals who require remote monitoring and management capabilities. It is suitable for organizations that prioritize automation, proactive maintenance, and efficient issue resolution. With features like automatic patch management and endpoint management, ConnectWise Automate is a valuable tool for those managing a diverse range of devices across different client environments.
The price of ConnectWise Automate is based on quotes. To get pricing information, request a quote. Get a free 7-days trial of ConnectWise Automate.
17. OP5 Monitor

OP5 Monitor is a network monitoring and management solution based on the Nagios open-source project. With it, you can keep track of the entire IT infrastructure, from networks, servers, applications, storage, regardless they are located on-premise, on private/public cloud, or in hybrid environments.
Features:
- Smart monitoring and self-healing.
- Distributed IT environments monitoring.
- Advanced reporting: Custom, SLA, and availability reports.
- Read and generate alerts from SNMP Traps.
- REST API.
Why do we recommend it?
OP5 Monitor, based on the Nagios open-source project, impressed us with its flexibility and scalability. During testing, it efficiently monitored the entire IT infrastructure, including networks, servers, applications, and storage, regardless of their location. OP5 Monitor’s smart monitoring and self-healing capabilities were instrumental in addressing network problems affecting VoIP, video, applications, and more.
The OP5 Monitor tool was initially designed for flexibility and scalability. It can be deployed in SMBs or Enterprise networks. It can keep track of hundreds of monitoring devices while checking at the same time without compromising its performance.
The solution comes with an interactive and fully customizable dashboard that shows you instant insights through graphs and maps. The software can be deployed on RedHat 6.x or CentOS 7.x.
Who is it recommended for?
OP5 Monitor is recommended for organizations of various sizes, including SMBs and enterprises, seeking a versatile network monitoring and management solution. It can handle monitoring for hundreds of devices without compromising performance. The interactive and customizable dashboard provides instant insights through graphs and maps, making it suitable for both beginners and advanced users.
For more information based on your requirements, request a quote. Download a 30-day free trial of OP5 Monitor with full support and unlimited devices. When the trial expires, the number of devices will be limited to 20 for an unlimited time.
18. Pandora FMS

Pandora FMS is an open-source network monitoring and management solution. It can help network admins keep track of the performance of servers, applications, network devices, hardware, virtual machines, and more.
Key Features:
- Display performance through dashboard, reports, SLAs or graphs.
- Remote network monitoring.
- Discover networks and create maps.
- Agent and agentless monitoring for Linux, Windows, and Unix servers.
- Monitor applications such as Oracle, Exchange, Hyper-V, and more.
Why do we recommend it?
Pandora FMS, being an open-source network monitoring and management solution, proved valuable during our testing for its ability to monitor diverse IT elements. It excelled in monitoring servers, applications, network devices, hardware, virtual machines, and more. The enterprise version, with its high scalability, addressed the need for comprehensive monitoring and management, especially for critical applications like Oracle, Microsoft Exchange, and others.
All network resources can be monitored remotely without agents through SNMP and other protocols like TCP, UDP, WMI, ICMP, etc. The software can also use agents on each client to gather data and send it to the server.
Who is it recommended for?
Pandora FMS is recommended for organizations that prioritize flexibility and scalability in their monitoring solutions. The community edition, being free and open-source, is suitable for those with budget constraints. The enterprise version, available in different editions, caters to organizations with varying monitoring needs. It is beneficial for monitoring applications across different sectors, making it a versatile choice for enterprises and large-scale deployments.
Pandora FMS Community is free and open-source. The Pandora FMS Enterprise comes at three different versions NMS ($2,930), Enterprise ($4190), and Corporate (request a quote). Download the free and community Pandora FMS edition or get a free 30-day trial of Pandora FMS Enterprise.
19. Monitis

Monitis is a website, network, server, and application performance monitoring tool. This solution does not need an agent to be installed on the monitored client. As long as the network endpoints are enabled with SNMP, they can be monitored through a single dashboard.
Key Features:
- Unified dashboard.
- Instant alerts.
- Open API.
- Thirty monitoring testing distributed locations.
- Real-time views, interactive charts, and reports.
Why do we recommend it?
Monitis emerged as a comprehensive website, network, server, and application performance monitoring tool during our evaluation. Its agentless approach and support for SNMP-enabled devices make it easy to monitor various endpoints through a unified dashboard. Monitis excelled in providing real-time views, interactive charts, and instant alerts, helping us stay ahead of potential issues. The ability to monitor HTTP performance for multiple websites simultaneously was a standout feature.
With Monitis, you can keep track of availability, uptime, response time, server health (CPU, memory, etc), network performance, and more. If there is an abnormal status, Monitis can immediately send an alarm through its dashboard, via email, SMS, Phone Call, Twitter, and Pager Duty.
Monitis is well known for HTTP monitoring. This feature helps you keep track of many websites at the same time. You can check their traffic, availability, status, etc. The software can run in the cloud (SaaS-based) or can also be deployed on-premises.
Who is it recommended for?
Monitis is recommended for organizations looking for a versatile performance monitoring tool that covers websites, networks, servers, and applications. Its unified dashboard and instant alerts make it suitable for both beginners and advanced users. With support for SNMP-enabled devices, Monitis is a valuable choice for those who want to monitor network performance without the need for installing agents. The pay-as-you-go model allows users to customize their monitoring plans based on specific needs. The minimum billable rate must be a minimum of $12.00/month. For more information, build your own plan. Register for a fully-featured Monitis15-days free trial.
20. Idera Uptime Infrastructure Monitor

Idera Uptime Infrastructure Monitor is an all-in-one IT management solution. It provides network monitoring, infrastructure management, and APM capabilities. With Idera, you can manage your hybrid environments, including on-premises, virtual, and cloud-based infrastructure simultaneously.
Features:
- Capacity planning. It can predict trends by correlating historical and real-time data.
- Keep track of your service and fulfill SLA compliance and reporting.
- A unified dashboard to monitor everything, networks, servers, VMs, cloud, etc.
- Auto-discovery mechanism.
- Integration to ServiceNow, to create incident tickets.
Why do we recommend it?
Idera Uptime Infrastructure Monitor impressed us as an all-in-one IT management solution, offering network monitoring, infrastructure management, and APM capabilities. Its wide support for third-party plugins, including NetApp monitoring and SAN health monitoring, made it stand out. The capacity planning feature allowed us to predict trends by correlating historical and real-time data, enhancing overall network performance management.
The software is well known for its wide support for third-party plugins. With over 89 plugins, you can improve the functionality of the software and virtuality monitor anything. Some of its pre-built plugins are NetApp monitor, log file monitoring, and SAN health monitoring.
The Idera Uptime Infrastructure Monitor server application deals with all the management information. The server processes and presents all the data via a dashboard. The software is supported by Windows and Linux operating systems.
Who is it recommended for?
Idera Uptime Infrastructure Monitor is recommended for organizations seeking a comprehensive IT management solution with a focus on network monitoring and APM. Its support for third-party plugins makes it suitable for those with diverse infrastructure components. The capacity planning feature is beneficial for organizations that prioritize predicting trends and ensuring optimal resource utilization. The unified dashboard covers everything from networks to servers, making it suitable for both small and large enterprises.
For information on Idera’s prices, request a quote. Download a fully functional free trial of Idera Uptime Infrastructure Monitor for 30 days.
21. Dynatrace

Dynatrace is an all-in-one intelligent monitoring platform that aims to simplify the complexity of the enterprise cloud. The Dynatrace monitoring platform provides cloud infrastructure monitoring, APM, and Artificial Intelligence for Operations “AIOps.”
Key Features?
- APM empowered by Artificial Intelligence.
- Monitoring containers, VMs, servers, network, and logs.
- Anomaly detection and event analytics.
- Auto-discovery for cloud infrastructure.
Why do we recommend it?
Dynatrace, as an all-in-one intelligent monitoring platform, impressed us with its AIOps capabilities and automated approach. During testing, it provided valuable insights through APM empowered by Artificial Intelligence. The support for monitoring containers, VMs, servers, networks, and logs showcased its versatility. The auto-discovery for cloud infrastructure and anomaly detection capabilities were instrumental in proactively addressing issues.
This solution is empowered by AI and is completely automated, so it is one of the few monitoring tools that provide valuable insights and follow up actions. It also supports more than 129 monitoring services for resources such as Docker, AWS EC2, Hyper-V, and more.
Who is it recommended for?
Dynatrace is recommended for organizations that prioritize intelligent monitoring with AIOps capabilities. Its automated approach, coupled with support for various resources such as containers and VMs, makes it suitable for modern and complex IT environments. Dynatrace is beneficial for enterprises that require comprehensive monitoring of applications, networks, and infrastructure components. The platform’s AI-driven insights and auto-discovery enhance its appeal for organizations focused on proactive issue resolution.
Dynatrace is SaaS-based, you just need to install the OneAgent on any on-prem, virtual, or cloud resource. But if you must fulfill compliance, you can also deploy and manage Dynatrace fully on-premises.
For more information on pricing, get a quote. Register for a 15-days free trial of Dynatrace.
22. Thousand Eyes

ThousandEyes is another SaaS-based network performance monitor and analyzer. The software gives you full visibility of the cloud, on-prem resources, Software-Defined WANs (SD-WANs), and even of other SaaS.
Key Features:
- Show a visual representation of the Path Trace data with Path Visualizations.
- Smart network analysis and insights.
- Monitor BGP, DNS, VoIP, and HTTP/HTTPS.
- Highly customizable reporting and alerting system.
- Fast problem diagnosis.
Why do we recommend it?
ThousandEyes, as a SaaS-based network performance monitor and analyzer, provided comprehensive visibility into cloud, on-prem resources, SD-WANs, and SaaS applications. Its unique capability to measure performance and detect service disruptions using synthetic monitoring probes impressed us. The software’s ability to monitor characteristics such as packet loss, latency, and analyze routes made it a valuable tool for optimizing network performance.
ThousandEyes is well known for its capability to measure performance and detect service disruption using synthetic monitoring probes that inject traffic. It uses three types of agents, Endpoint, Enterprise, and Cloud Agents. These two agents are excellent methods for collecting real-user traffic data and measuring network performance.
The software can monitor characteristics of the network such as packet loss and latency, analyze routes to visualize BGP, monitor DNS, VoIP, HTTP/HTTPS, and poll any device enabled with SNMP.
Who is it recommended for?
ThousandEyes is recommended for organizations looking for a cloud-centric solution with a focus on network performance monitoring. Its ability to measure performance using synthetic monitoring probes makes it suitable for those prioritizing proactive issue detection. ThousandEyes is beneficial for enterprises with diverse IT environments, including cloud resources, SD-WANs, and SaaS applications. The visual representation of Path Trace data and customizable reporting enhance its appeal for organizations seeking detailed insights into network behavior.
For information on pricing, get a quote. Register to get a 15-days ThousandEyes free trial.
23. Zenoss

Zenoss is a SaaS-based intelligent application and service monitoring (APM) and AIOps software. It was recognized by the 2019 Gartner Market Guide for AIOps Platforms. It provides a unified monitoring platform to gain full visibility of the entire IT infrastructure, from cloud environments, VMs, containers, SDNs, apps, databases, logs, servers, storage, networks, and more.
Features:
- Full-stack monitoring.
- Root-cause analysis via Machine Learning.
- Analyze data from Netflow, logs, and UC and get insights.
- Immediate alerts and proactive solutions.
- Monitor multi-vendor solutions from a single-pane-of-glass.
Why do we recommend it?
Zenoss, as a SaaS-based intelligent application and service monitoring (APM) and AIOps software, stood out for its full-stack monitoring capabilities. It provided actionable intelligence by collecting data from various network resources, including metrics, events, and logs. The software’s emphasis on applications and services, coupled with its support for on-premises or cloud-based deployment, addressed our need for unified monitoring across diverse IT elements.
The type of network monitoring and analytics that Zenoss provides is centered around applications. The software lets you monitor physical and virtual networks in real-time. It collects data such as metrics, events, and logs from on-premises or cloud-based networks and reports back to the server, to get actionable intelligence.
Who is it recommended for?
Zenoss is recommended for organizations seeking a unified monitoring platform with a focus on applications and services. Its machine learning capabilities for root-cause analysis and the ability to analyze data from Netflow, logs, and UC make it suitable for those prioritizing comprehensive insights. Zenoss is beneficial for both cloud-based and on-premises deployments, catering to organizations with varied infrastructure preferences. The availability of different editions allows customization based on specific monitoring needs.
Zenoss comes in four categories, the Zenoss Cloud (which is the commercial), the Open-source, Community, and the subscription-based. All of these products provide unified monitoring for SNMP, WnRM, or SSH-enabled devices. Zenoss is mainly cloud-based but also offers a managed on-premises solution.
Zenoss Community Edition is a free and open-source application, and the Zenoss Cloud (Professional and Enterprise) are the commercial editions. For more information request a quote. To start with Zenoss, you can request a demo.
Our Top Choice
In the years 2018 and 2019, there was hype on cloud and SaaS-based models. But unfortunately, not all applications can fully benefit from these models. And network monitoring is one of them; it needs to stay local.
Although you could benefit from cloud-based analysis and AI solutions, avoid full SaaS network monitoring software. Having network monitoring software deployed, on-premises guarantees reliability, availability, security, and fast data transfers. Therefore, it is recommended to look for a solution that can be deployed on-premises, but also has the benefits of cloud services.
Also, look for network monitoring solutions that…
- allow you to manage and monitor the full stack.
- give you full visibility through a unified dashboard.
- keep you alerted and show you results.
- are flexible and compatible with other tools.
If your budget is limited, but you have the time for implementation and learning, then we recommend the free and open-source products, such as Nagios Core or Icinga.
But if you are looking to invest in robust network monitoring systems, some software solutions are generous with free trials and freebies. Tools such as Auvik and ManageEngine Applications Manager are fantastic tools to start your journey, especially that they offer a 30 Day Free Networking Monitoring Software starter trial!