
Finding the right toolset as a network engineer can be difficult. There is a lot of information required to master the subject, and knowing which tools are right for your job can be difficult. From being overwhelmed by the current issue, to simply not being aware that a solution exists as a tool, optimizing your workflow is paramount for keeping productivity levels high.
The Best Network Engineer Tools
1. Site24x7 – EDITOR’S CHOICE

Site24x7 is particularly strong for capacity planning because it continuously tracks bandwidth usage, traffic behavior, device health, and response times across the network. That gives administrators current operational data as well as historical records they can use to judge where demand is rising and where constraints are starting to form.
Historical analysis is one of the more useful parts of the service for network engineers. By reviewing usage patterns over time, teams can forecast when additional capacity will be needed and plan upgrades before performance drops or congestion begins to affect users.
Threshold-based alerts add another practical layer. When bandwidth use, traffic volumes, or other monitored values move toward critical levels, administrators can act before the network reaches a breaking point. You can assess Site24x7 through a 30-day free trial.
EDITOR'S CHOICE
Site24x7 is our top pick for a network engineering tool because it supports capacity planning with continuous performance data rather than guesswork. The platform measures traffic, bandwidth use, device health, and response times in real time, then keeps historical records that help teams identify trends and plan infrastructure changes before service is affected. Custom alerts provide earlier warning when thresholds are nearing, which makes scaling and optimization more proactive.
Download: Get a 30-day FREE Trial
Official Site: https://www.site24x7.com/signup.html?pack=44&l=en
OS: Cloud-based
2. ManageEngine OpManager Plus – FREE TRIAL

ManageEngine OpManager Plus is a unified platform that ensures the availability of your critical devices and applications. More importantly, it provides in-depth insights to provide complete control and visibility to your DevOps and network engineers and IT administrators, so they can take proactive actions to reduce disruptions and prevent downtime.
It monitors all aspects of your network, like applications, infrastructure, bandwidth, traffic, and more. Armed with this data, your network engineers can make appropriate configuration changes, predict resource requirements, and remediate problems.
OpManager Plus works well across all deployments, including distributed IT environments. Its unified console is intuitive and provides all the required information in a single pane.
This platform offers two editions – Professional and Enterprise. Start a 30-day free trial.
3. Paessler PRTG
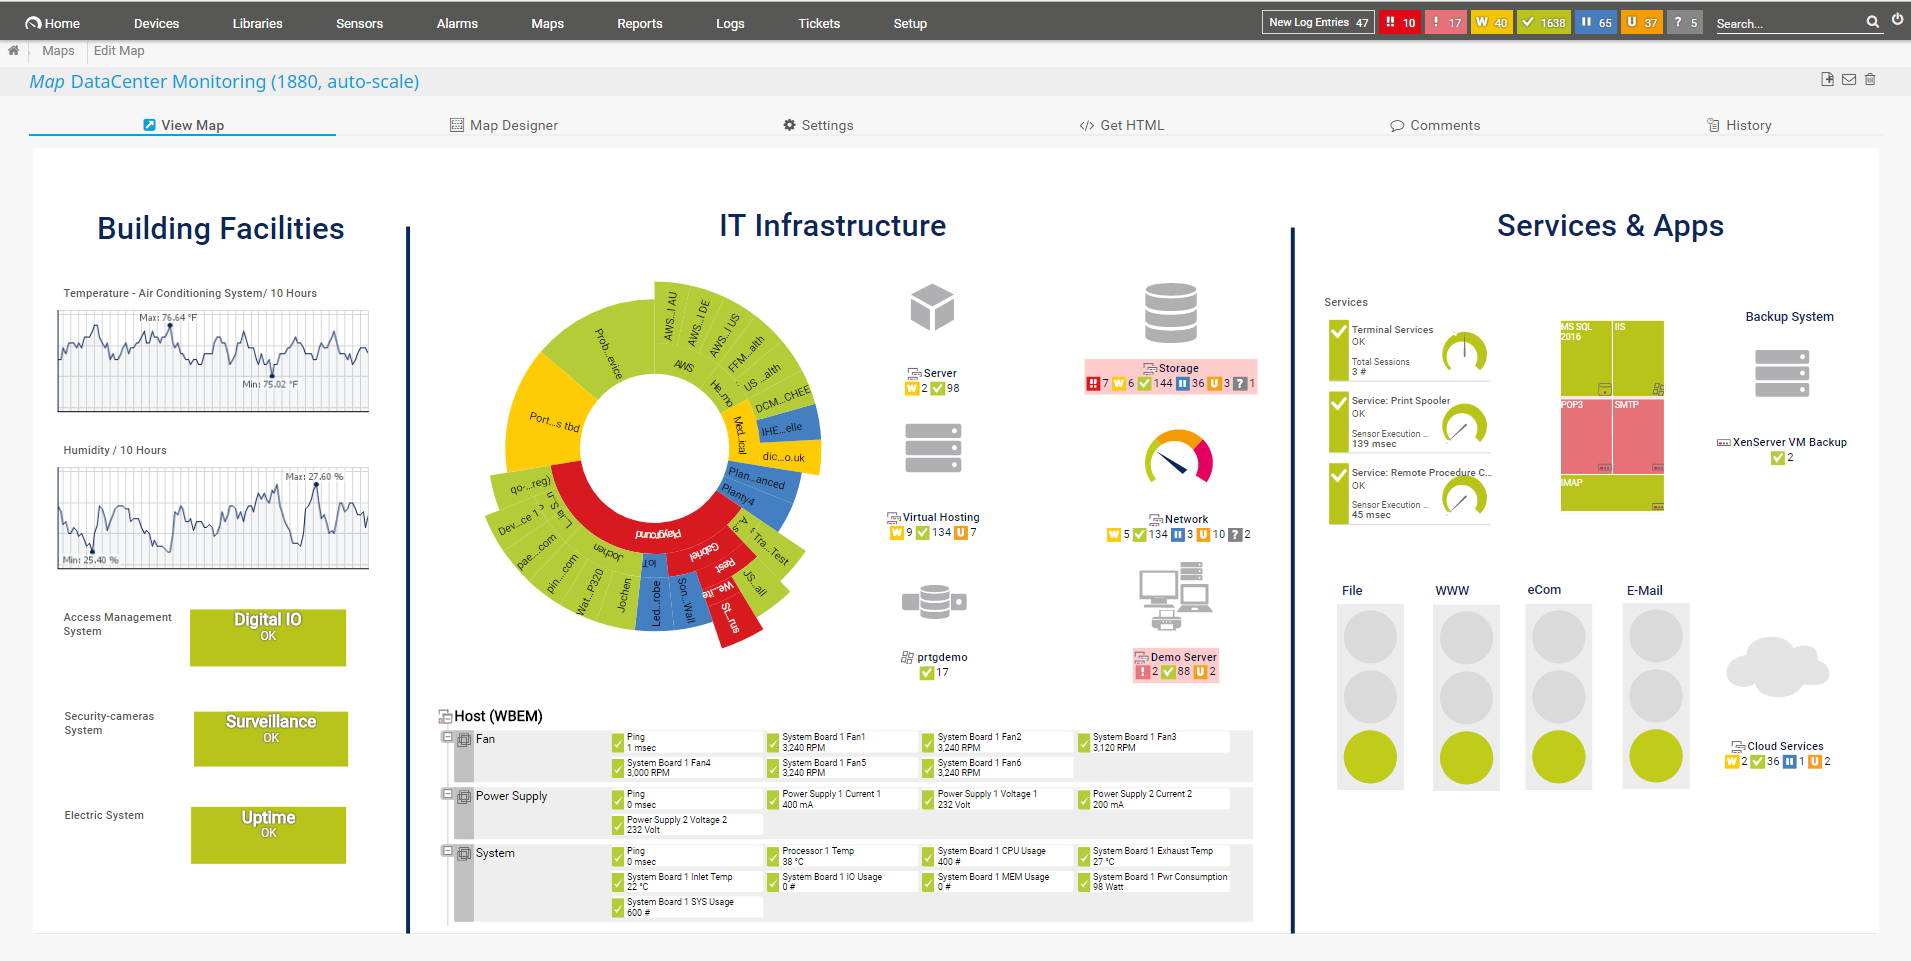
Paessler PRTG is an on-premise or cloud tool that is best suited for small to medium-sized businesses. Similar to the previous tool, it’s a unification of many different features, all unified in a streamlined way. This way, you can have full monitoring capability where all of your needs are accounted for. It is fully functional out of the box since it comes pre-configured with a variety of templates to choose from. This doesn’t mean the system is rigid though, it is highly customizable in almost every aspect possible. This way, your technicians can be quick to start using the tool in a quick and comprehensive manner, while also getting familiar with it over time, custom-tailoring the experience to your network uniquely. Paessler PRTG functions on something they call “sensors”. In essence, one sensor monitors one value in your network. You assign this value and it can vary, for example, disk space, CPU load of a server, traffic of a switch port, et cetera. On average, you need 5-10 sensors per device. This tool comes with different purchase plans, mostly varied by the number of sensors they have. It offers a free 30-day trial and is also fully free for up to 100 sensors.
4. Nmap

Nmap is best used as a penetration testing and security scanning tool. Whenever you are dealing with something unfamiliar, or simply want to check your ports and services, Nmap has you covered. It’s based on a command line interface meaning that there is no visual way to interface it, instead it is based on text inputs. If you wish to have a graphical interface, however, you can use Nmap’s official GUI (Graphical User Interface), called Zenmap. If you are new to software such as this and need help with overcoming the initial problems associated with learning how to use it, the graphical interface can help you with that. Furthermore, it is also open source.
5. Wireshark

Wireshark is an open-source network protocol analyzer that is available for Windows, Linux, MacOS, FreeBSD, NetBSD, and more. It allows you to browse through the traffic on your network, and capture it. It offers unique insight as it lets you get to the bare-bones level of your network packets, which allows for precise, granular control. This way, root cause analysis is a breeze since you have full oversight of the most core details. You will however need to be proficient in using this tool for adequate analysis since you will have to go through a lot of data to effectively track the issue. Take note that it might be prudent to pair Wireshark with a tool such as WinPcap to capture link-layer packets with Wireshark.
6. SolarWinds Engineer’s Toolset

SolarWinds Engineer’s Toolset allows you to eliminate the need for multiple tools by unifying all of the necessary services, as a single solution, through a single, centralized view. This way you can reliably mitigate costs, and make sure that your technicians can stay focused on the task ahead of them. ETS offers a lot of variety, from real-time monitoring, and automated network discovery, to enhanced network security, and powerful diagnostic capabilities. Since SolarWinds ETS has 60 tools available for use, you can reliably assume that your network management and monitoring needs will be met. You won’t have the need to get lots of third-party software to have your technicians do their job, instead, now it’s all conveniently present in one comprehensive bundle. Furthermore, if you have any more monitoring concerns, you can pair SolarWinds ETS with the SolarWinds Network Performance Monitor (NPM). SolarWinds offers a 14-day free trial for this tool.Engineer’s Toolset
7. Infection Monkey

Infection Monkey is an open-source penetration testing tool. It is available on-premises, on public, and on private clouds. It helps you simulate breaches and attacks in a controlled, and safe environment to see how your network would get impacted as a result. After which, you can patch the holes in your network security to make sure you are as protected as possible. It offers three different analysis reports. Zero Trust, MITRE ATT&CK, and Breach & Attack Simulation. All of these features are available for free, as well as the source code which you can find on GitHub.
8. iPerf3

iPerf is designed to help you measure the maximum achievable bandwidth on IP networks. It does this by testing the bandwidth, packet loss, and many more variables. It supports tuning TCP, UDP, and SCTP with both IPv4 and IPv6. It supports a variety of platforms, these include Windows, Linux, Android, MacOS X, FreeBSD, OpenBSD, NetBSD, Vxworks, Solaris, and more. It is free and released under a three-clause BSD license.
9. Cacti

Cacti is supported on Windows, Linux, Apache, MySQL, and PHP. It is also a fault management framework and a frontend to RRDTool. All the information to create performance Graphs is stored in either MySQL or MariaDB. This allows you to completely graph your network so you can monitor all of your operations. Cacti was initially intended to be a performance manager but has since extended its range of operation management. Besides fault management, Cacti now offers log management, router configuration backup, NetFlow data collection and display, device discovery, network mapping, and more. Furthermore, it scales from just a couple of hosts, all the way up to thousands. Cacti is also free, it does have dependencies however which you should check in the requirements section in the manual.
10. Snort

Snort is an open-source Intrusion Prevention System (IPS). It works on a series of rules that define malicious network activity and then uses said rules to find packets that match against them, then accordingly generates the alerts. Snort can be used in three different ways. It can be used as a packet sniffer similar to tcpdump, as a network intrusion prevention system, and as a packet logger. Snort comes in two different configurations, the Snort subscriber ruleset, and the community ruleset. The community ruleset is free to use and is developed by the community. The Snort subscriber ruleset is developed, tested, and approved by Cisco Talos.
11. Aircrack-ng

Aircrack-ng is an open-source WiFi security assessment tool. It is designed to run in Linux, but it also works on Windows, macOS, FreeBSD, NetBSD, OpenBSD, Solaris, and eComStation 2. Do note that the Windows version requires you to develop your own DLLs to link Aircrack-ng to your wireless card. These Windows DLLs are unavailable for download, and Aircrack-ng will not work without them. It offers a multitude of tools to help you monitor and manage your WiFi security, and they boil down into four types. The monitoring aspect allows you to capture packets. The attacking aspect allows you to achieve many effects such as de-authentication and fake access points via packet injection. It also checks WiFi cards and driver capabilities (capture and injection. And finally, it allows you to crack WEP and WPA PSK (WPA 1 and 2).
12. PuTTY

PuTTY is an open-source tool that is supported by Windows, MacOS, and Linux. It allows you to configure or reconfigure a network. It is a serial console, terminal emulator, and network file transfer application. It supports network protocols such as SCP, SSH, Telnet, rlogin, and raw socket connection.
13. GNS3

Graphic Network Simulator-3, or GNS3 for short, is a network software emulator. It allows you to simulate complex network environments, either fully virtually, or as a mix of both virtual and real components. It has a visual interface where you can drag and drop routers onto the screen, and then configure them as you would in real life. This way you can both practice and test any scenarios that you need. This way when you migrate onto the real-life network, you can be aware of any issues that you may run in, and know how to deal with them accordingly beforehand. In other words, GNS3 provides you with an ideal lab setup for you to learn and figure out ideal parameters for your network. Furthermore, it is free and open source as well.
Conclusion
We have listed out many different tools here for you to browse through and get informed about if you haven’t already known about them. Each one of them has their own unique strengths. Some are well-rounded and try to incorporate as many features under one roof, some of them are highly specialized in doing one task very well. Either way, hopefully, this has been helpful to you, and you have discovered something new and useful.