Microsoft Azure, a leading cloud computing platform, offers full observation and visibility into applications, infrastructure and networks with its growing collection of integrated services. Many organizations use Azure in their infrastructure and today we’ll be going over the Best Azure Monitoring Software and Tools for your environment.
With cloud computing forming an essential role in organizations as technology evolves, the need for fast, easy and above all safe access to stored data from anywhere in the world has become vital. Ensuring uptime, resilience and redundancy in Cloud infrastructures is an network admins top focus and implementing a robust Azure monitoring solution should be a top priority.
Here is our list of the best Azure monitoring software & tools:
- Turbo360 Azure Monitoring – FREE TRIAL A system of three tools for monitoring Azure services, letting you define logical applications, distributed tracing on application resources, and tracking Azure resource usage for invoice reconciliation. Available as a SaaS package, or as a privately hosted Azure service. Start a 15-day free trial.
- SolarWinds Server & Application Monitor – FREE TRIAL This application monitor is able to supervise Cloud resources as well as on-premises activity. It covers servers as well and so it has special routines for monitoring Azure services, such as virtual server space and containers run in the Cloud under Kubernetes. Installs on Window Server.
- AppOptics – FREE TRIAL A cloud-based monitoring service for applications that has specialized procedures for monitoring Azure services.
- Site24x7 Infrastructure Monitoring – FREE TRIAL A cloud-based application, server, and network monitor that includes many integrations for Azure services.
- ManageEngine Applications Manager – FREE TRIAL An application performance monitor that has capabilities in Cloud service monitoring as well as on-premises resource supervision. This system can monitor Azure services and installs on premises on Windows Server and Linux.
- Paessler PRTG – FREE TRIAL A collection of monitoring systems for networks, servers, and applications that include processes for monitoring Cloud platforms, including Azure. Installs on Windows Server.
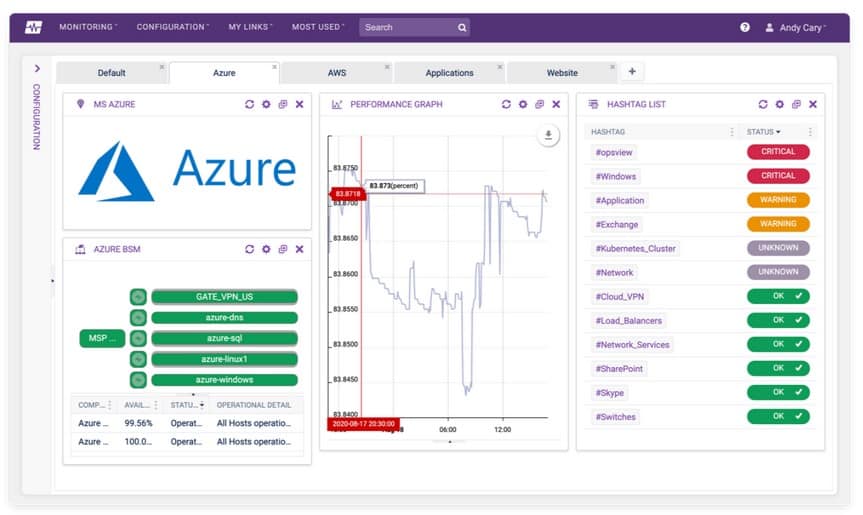
- Opsview A system monitor for server and application performance and covers cloud services, such as Azure as well as on-premises resources. Installs on Linux.
- Dynatrace A cloud-based infrastructure monitoring service that includes monitoring procedures for Azure services.
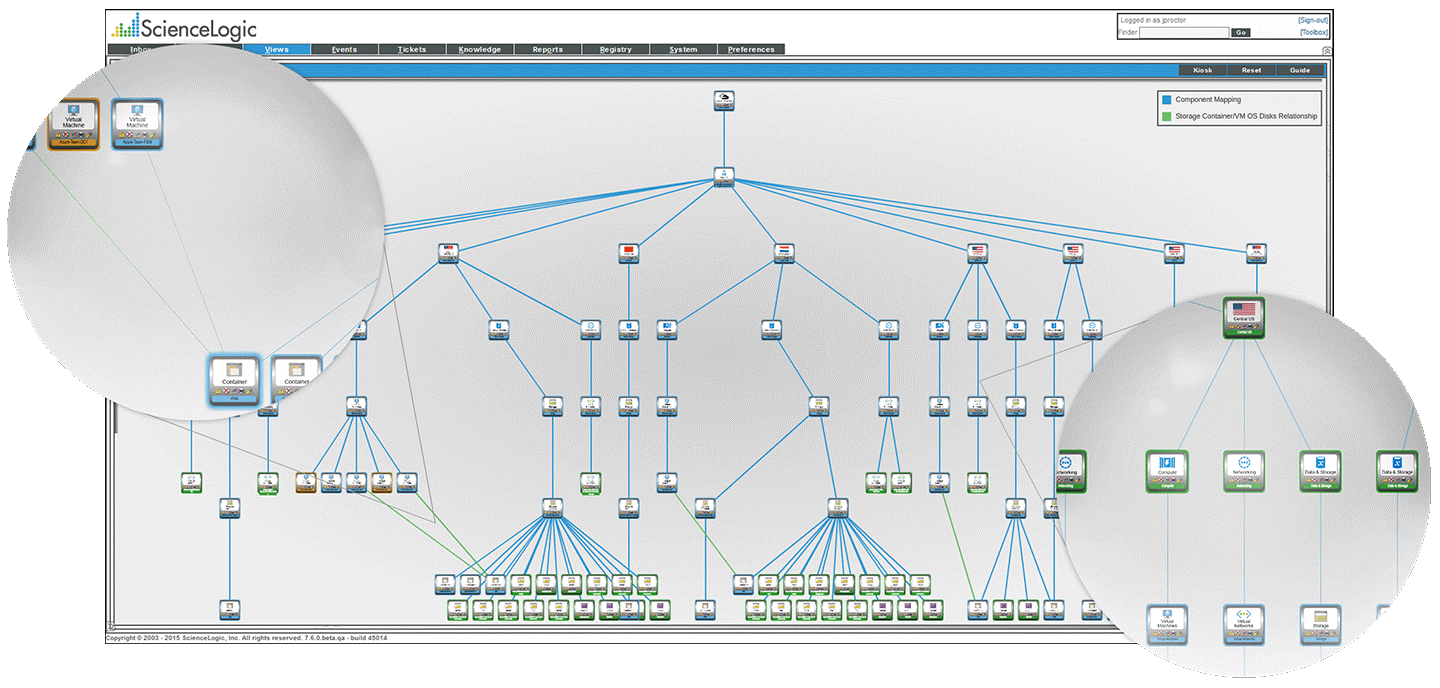
- ScienceLogic SL1 An AI-driven infrastructure monitor that includes performance tracking for Azure services. Available as a physical or virtual appliance.
Azure’s flexibility to operate within multiple environments, combined with its scalability and ability to monitor everything from one, centralized location, is ideal for organizations utilizing or switching to hybrid and multi-cloud environments. Azure further increases the resilience and availability of all services, allowing for maximum performance and availability of applications.
This is achieved through its extensive collection, analyzation and action on operational telemetry from both cloud and on-premises environments, thereby supporting the fast, proactive identification of issues. This allows for timely reactions to problems arising, ensuring applications and networks run smoothly and uninterrupted.
It further enhances security measures, known for delivering highly rated data protection and security certifications, while also ensuring critical components are consistently supervised to reduce the risk of lost information. While the Azure Platform allows for analysis and visualization of its vast information collected, as well as alerting, third-party tools greatly assist in the monitoring and management of Azure services, virtual machines and databases.
With these Azure monitoring tools, system administrators can detect, diagnose and rectify issues with far more ease. This is possible through the substantial insight provided into an organization’s Azure environment through the level of granularity offered as well as the variety of parameters monitored.
Combined with broader, overall visibility, as well as automation and auto-discovery capabilities, the following Azure monitoring tools make the monitoring of this complex environment far more manageable. The benefits, featured functions, download links and pricing structures are listed beneath each of the Azure monitoring tools mentioned.
The best Azure monitoring software
1. Turbo360 Azure Monitoring – FREE TRIAL
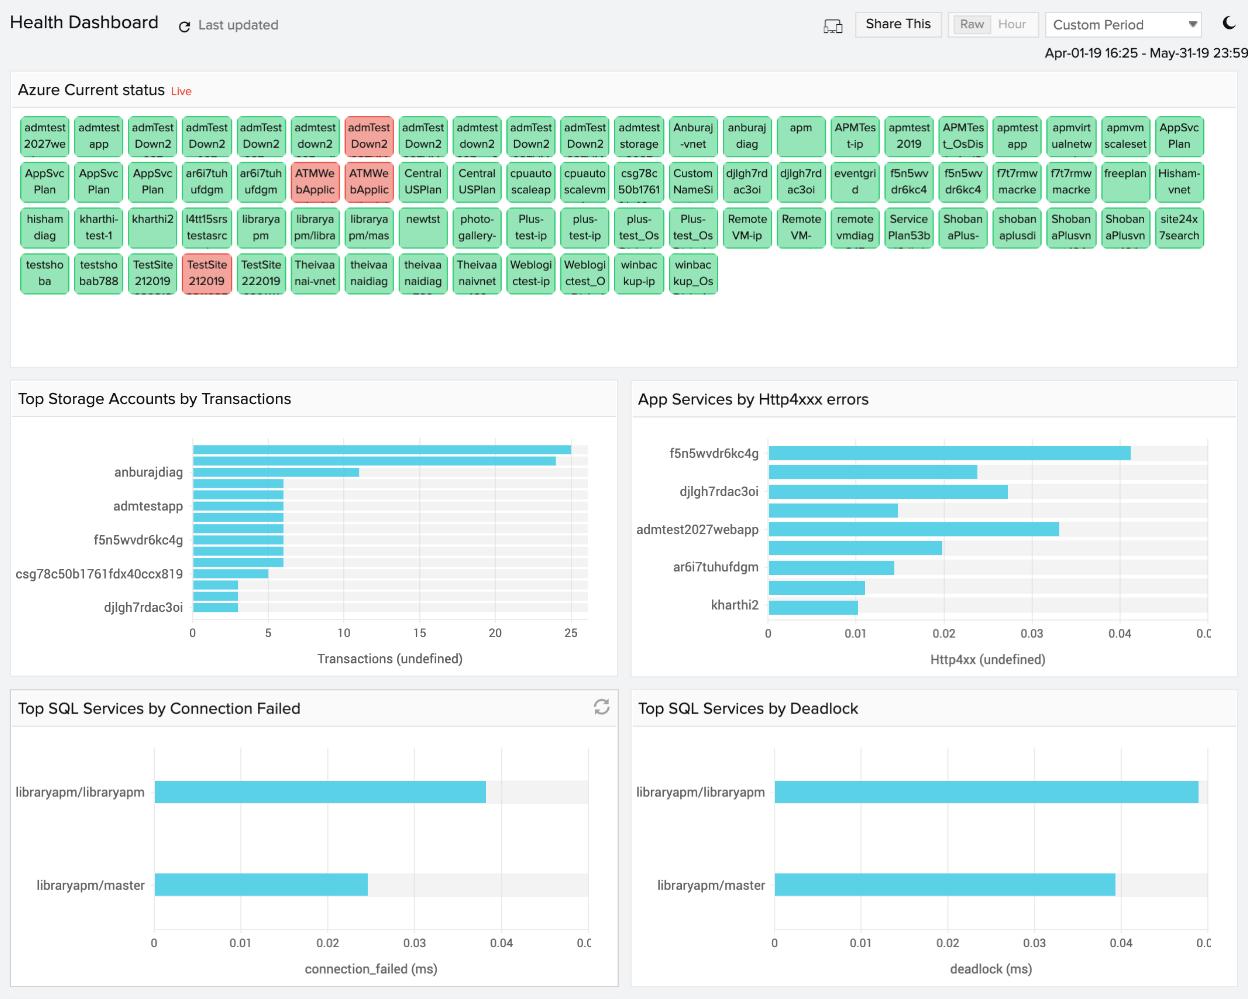
Turbo360 is a platform that includes three modules: Business Applications, Business Activity Monitoring, and Azure Documenter. These tools are all available individually, but they also work well together as a suite.
The Business Applications and Business Activity Monitoring tools are particularly good together. The first of these utilities lets you define a group of Azure services as a logical application. This is beneficial for monitoring because, although the Azure platform provides metrics on the performance of its services, these statistics are delivered in separate streams.
The silo approach of the Azure platform in how it delivers its services makes tracking the performance of your Azure-based infrastructure very difficult. When you are looking at microservices, hosted on Azure, performance tracking and root cause analysis becomes even more complicated and almost impossible to perform with the assistance of a monitoring tool. The Business Activity Monitoring unit provides that service.
So, the Business Applications unit virtualizes a bundle of Azure services into a single entity by providing a wrapper. The consolidation of metrics related to those individual services enables the Business Applications dashboard to present live performance data for that logical application. You also need to knit that logical application into its environment. The Business Applications service provides an application dependency map around that virtual application. With this, you can see the services that feed into your virtual application and the applications that depend on the services of your new application.
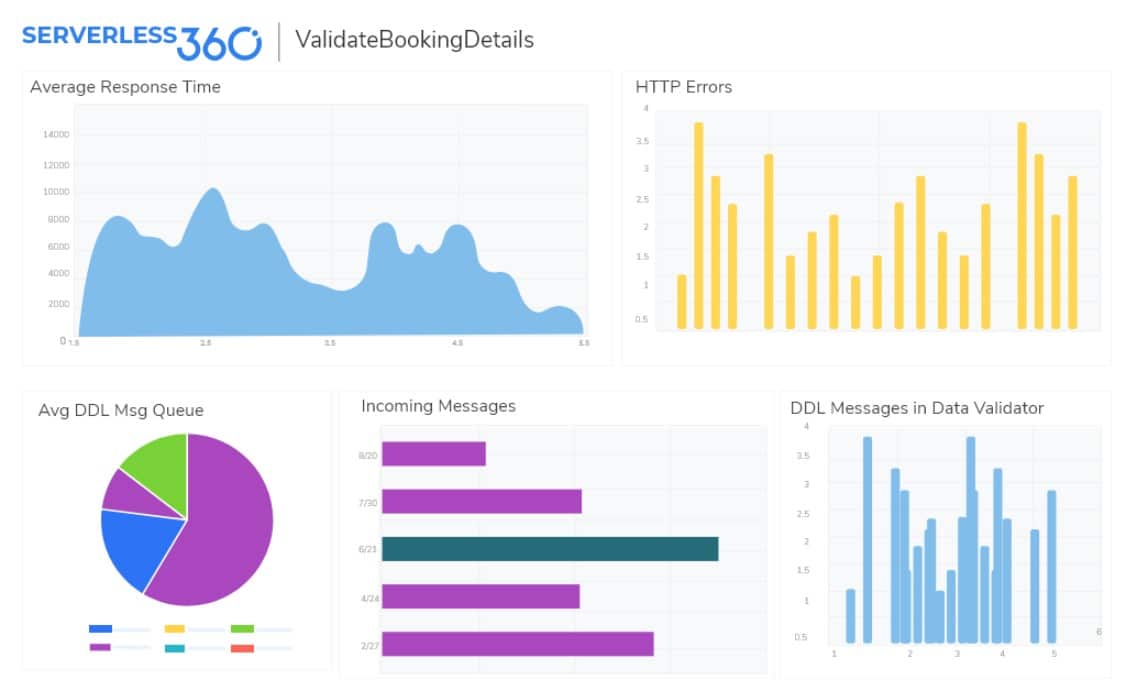
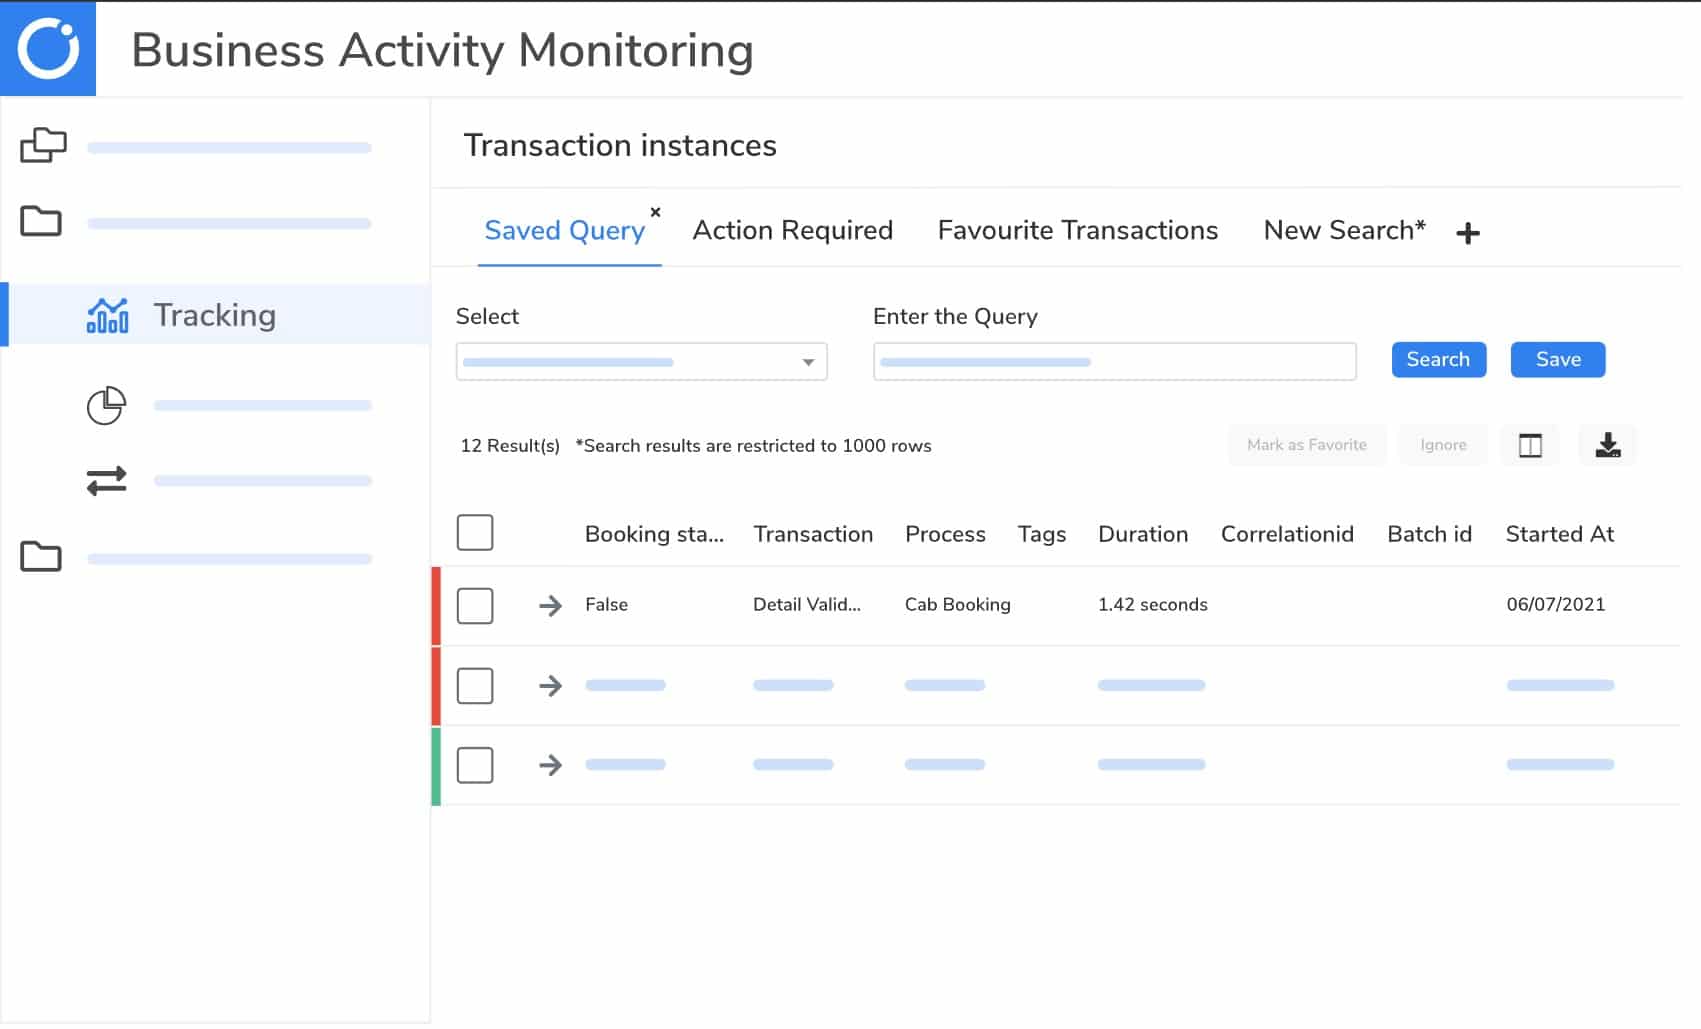
Business Activity Monitoring is a distributed tracing service, which is suited to monitoring microservices, hosted on serverless platforms.
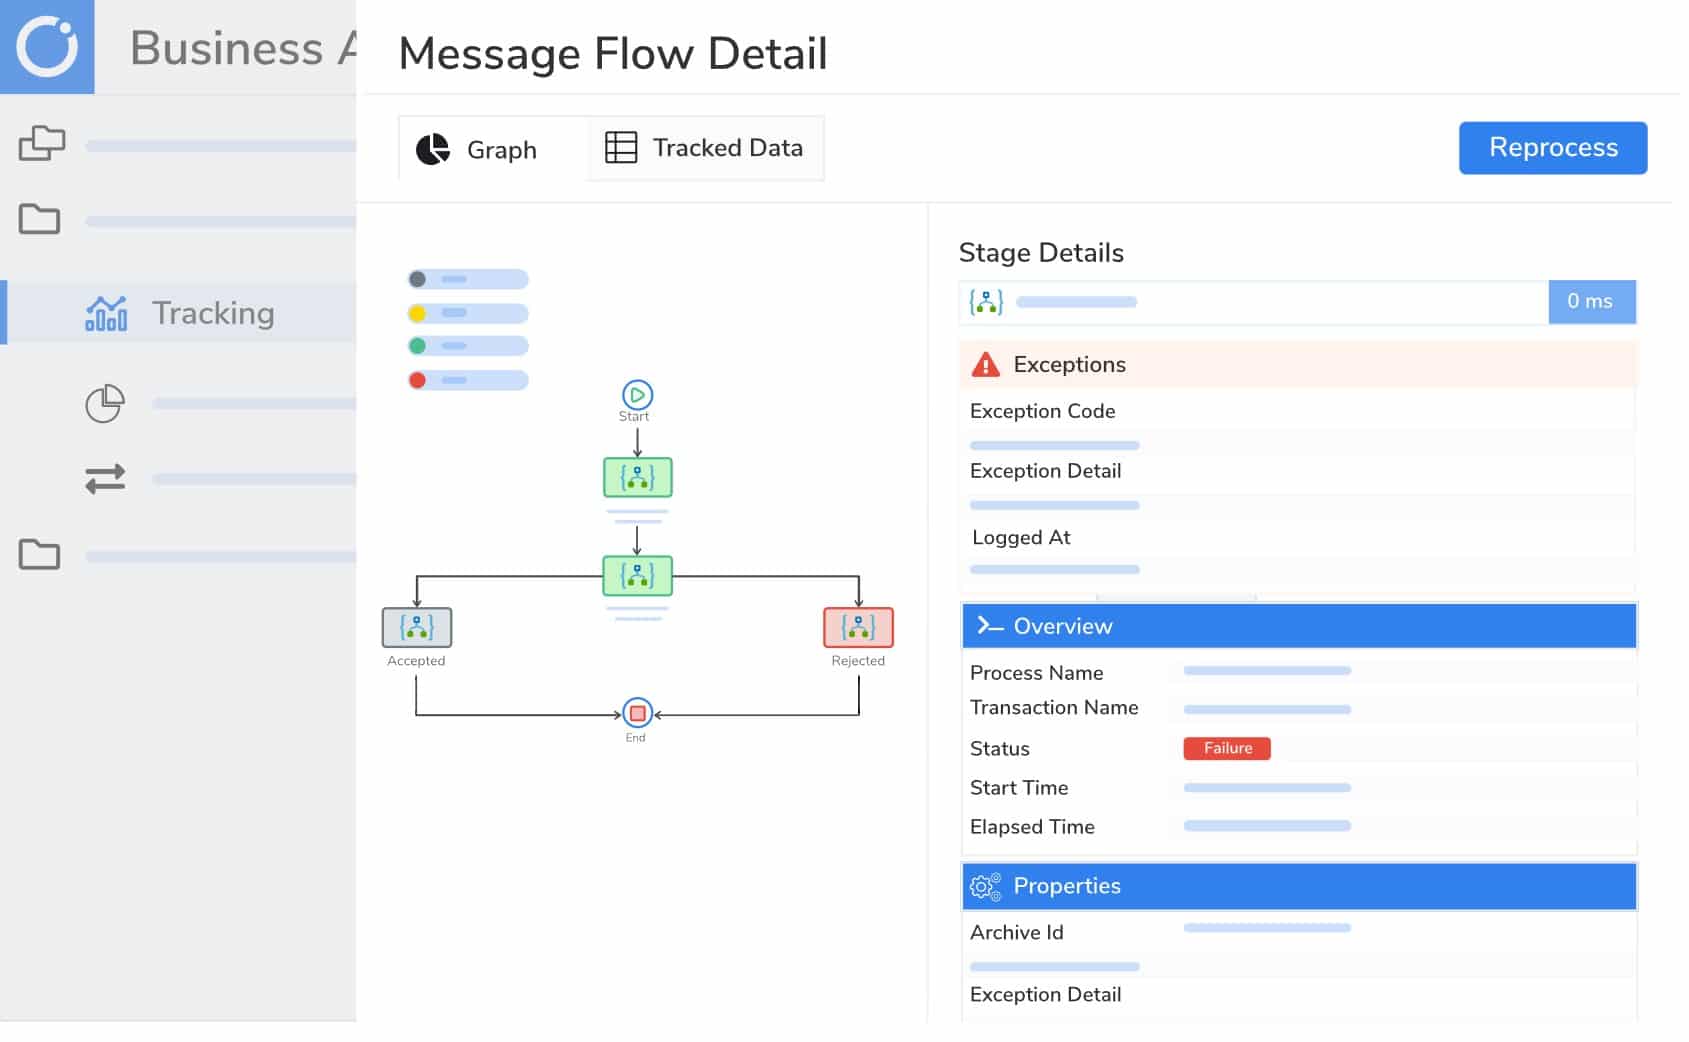
The monitor tracks the activities of your business processes as the message travels through the application components. This makes querying the transactions on business values, monitoring for exceptions and reprocessing failures to restore business feasible.
The third service that is available from Turbo360 is a usage tracking system for Azure resources. This provides daily summaries of the consumption of metered services so that you can check the invoice from Azure.
The Turbo360 package is available as a SaaS platform. It also packages its units so that you can run them as services within your own Azure accounts. Whichever deployment option you select, your monitoring service will be able to operate across platforms.
Pricing: The three modules of Turbo360 are priced individually and billed annually. The Business Activity Monitoring module starts at $300 per month, the Business Application module starts at $150 month, and the Azure Documenter starts at $49 per month.
Demo: You can register for a free demo. You can also get started with a 15-day free trial.

2. SolarWinds Server & Application Monitor – FREE TRIAL
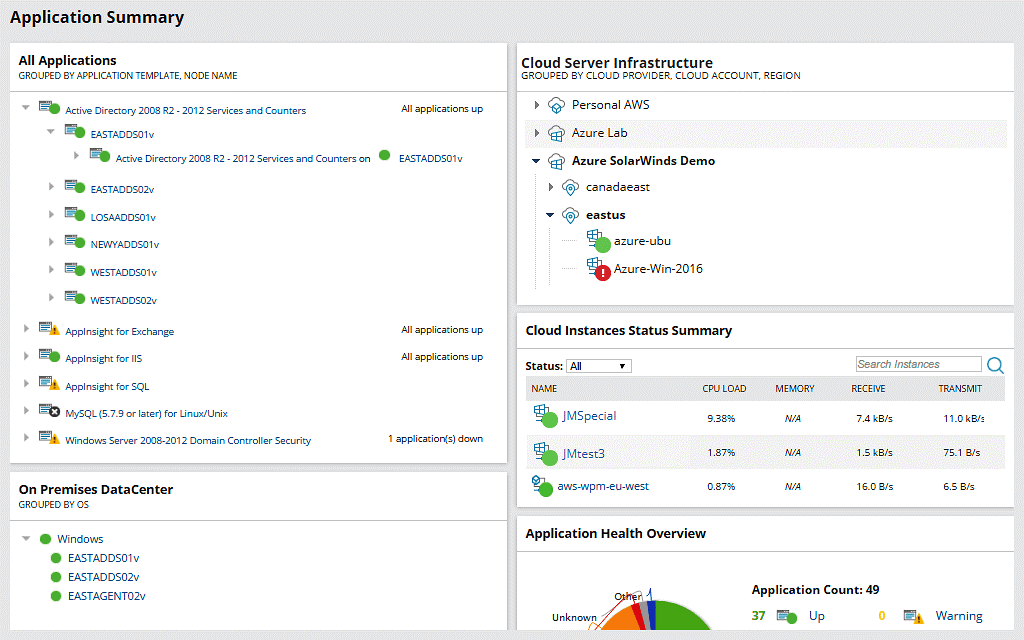
To achieve comprehensive monitoring and management of performance and availability within an organization’s Azure Environment, SolarWinds Server & Application Monitor provides insight and telemetry into cloud workloads through a single, concise dashboard. With a complete overview of the entire Azure Environment, system administrators have the ability to visualize and correlate performance metrics, while gaining valuable information on system, application and infrastructure performance.
Its auto-discovery features further ensure that every single Azure virtual machine and container is consistently monitored. This, when combined with its dynamic baseline capabilities and alerting system, allows for system administrators to get instant notifications when an issue is identified.
With faster reaction times, problems detected are troubleshooted and resolved faster, reducing the potential for interruptions to the organization’s workflow processes.
SolarWinds Server & Application Monitor, through the use of its Azure IaaS monitoring, supports the monitoring of Kubernetes and virtual machine performance. With the aim of seamless service delivery, the software also gives system administrators the ability to gain oversight into Azure performance over periods of time.
This, and the option of viewing and correlating infrastructure metrics as it relates to application performance, assists in the determination of the overall health of the Azure environment.
The ability to track network communication between virtual machines as well as visualize dynamic mapping between virtual machines and applications further supports this cause.
The identification and gathering of information such as Azure region, configuration, security details also helps in the event of troubleshooting performance issues arising.
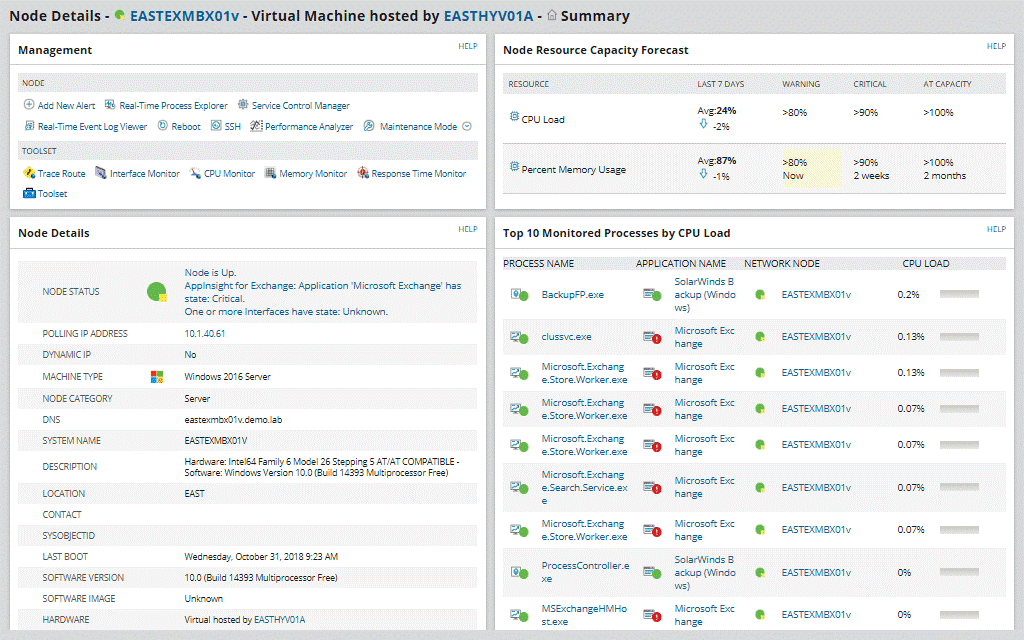
With the monitoring of critical Azure components being crucial to ensuring the consistent performance and availability of applications, SolarWinds Server & Application Monitor makes use of its Azure PaaS monitoring capabilities.
The components tracked include CPU, memory, response times, requests and more, while keys service metrics tracked cover app services, event hubs and SQL databases.
With its inclusion of Microsoft Office 365 monitoring, SolarWinds Server & Application Monitor compiles reports on data monitored, such as active users, mobile devices, mailbox sizes and growth over time.
This allows system administrators to identify trends within the organization’s Office 365 applications, with the additional benefit of being able to track and remove inactive users, assisting with unnecessary billing.
In support of full Microsoft ecosphere monitoring, SolarWinds Server & Application Monitor further allows system administrators to view all Microsoft systems, applications and cloud resources from one, centralized viewpoint.
Pricing: A perpetual license for SolarWinds Server & Application Monitor starts at $2995.00, while the alternative subscription licensing starts at $1567.00. You can view the different pricing options for both licenses and request a quote, get instantaneous access to an interactive demo or trial the software for free for 30 days.
Download: https://www.solarwinds.com/server-application-monitor/registration
3. AppOptics – FREE TRIAL
AppOptics, from SolarWinds, was built with the understanding that an organization’s Azure environment can host multiple, highly diverse cloud-based services, provides both a powerful and flexible solution to meet the needs of such a complex environment. This software grants system administrators the ability to efficiently monitor key Azure services and applications running on virtual hosts or containers through its user-friendly dashboard.
By design, Azure metrics monitored by AppOptics is integrated into dashboards through an automated, intuitive process. From here, infrastructure metrics are viewable side-by-side in real-time, providing a comprehensive overview of CPU, memory and network metrics as well as services consuming resources. The software further includes multiple pre-populated dashboards, such as the monitoring of virtual machines and networks, keys vaults and more, while still supporting customization in its monitoring processes.
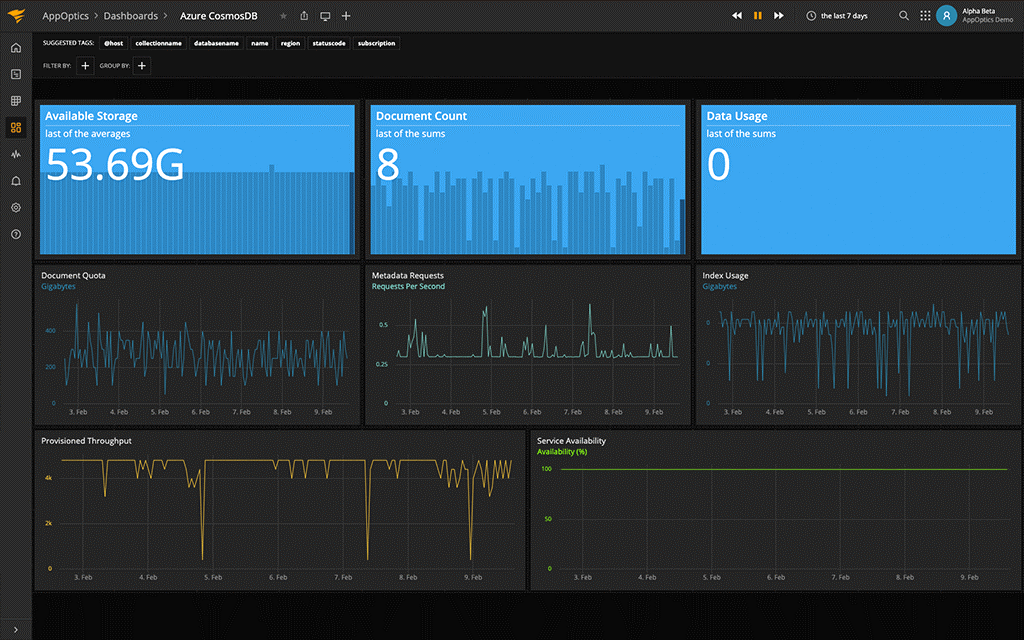
AppOptics, making use of its multidimensional filtering, allows system administrators to quickly detect performance issues, such as outliers and hot spots, in an organization’s Azure services in real-time. Its proactive alerts, via SMS, email and Slack, amongst other platforms, immediately notifies system administrators of issues as they arise. These alerts, set with either built-in or customized thresholds, provide much needed assistance in the pinpointing of relevant metrics in an organization’s Azure hosts and containers.
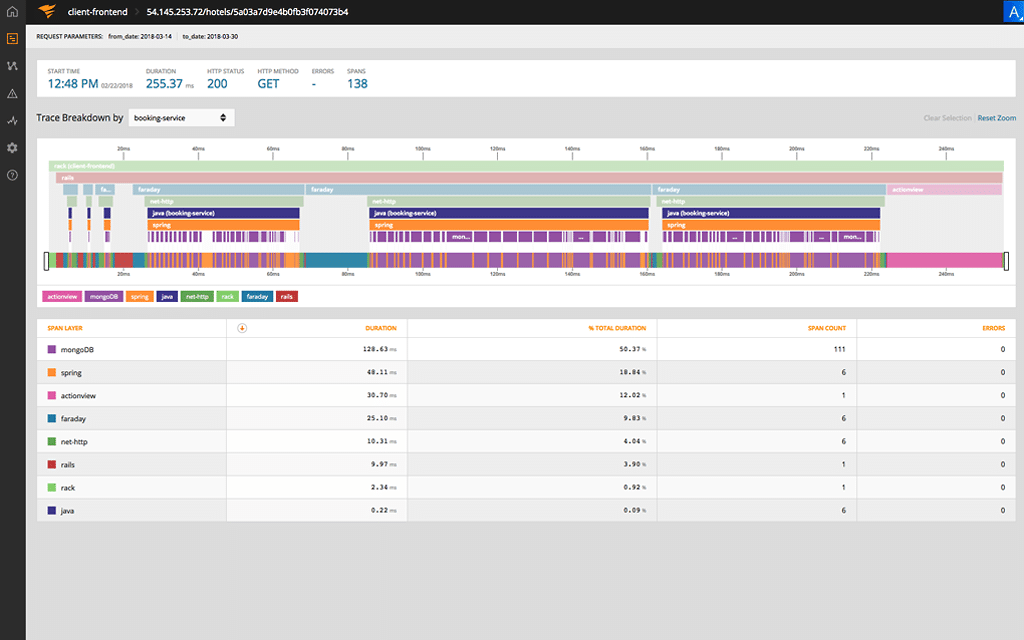
This gives system administrators the ability to identify and resolve problems in the Azure environment faster and with more efficiency, while the option of deep diving into code-level performance provides even more accuracy. The use of AppOptics’ distributed tracing, exception tracking and live code profiling allows system administrators to attain such a comprehensive overview of application performance. With the further ability to view time-series metrics for all cloud-based and on-premises infrastructure, AppOptics ensures troubleshooting is done with ease and speed.
With its use of full-stack visibility, AppOptics monitors both cloud-based Azure services as well as underlying infrastructure in an effort to improve the tracing of performance issues. This information, viewable in customizable dashboards and service maps that are streamlined, further assists system administrators in identifying and understanding the relationships between Azure services and the applications running on them.
Pricing: AppOptics provides the option of both annual and monthly plans, with infrastructure monitoring starting at $9.99 per host per month on the annual plan and $12.90 the monthly plan.
The inclusion of application monitoring rises the starting price to $24.99 on the annual plan and $29.90 on the monthly plan. To test the software, you can sign up for the 14-day fully featured trial or schedule a custom demo.
Download: https://my.appoptics.com/sign_up
4. Site24x7 Infrastructure Monitoring – FREE TRIAL
Site24x7 is a cloud-based platform of system monitoring tools. Its Infrastructure module deals with servers, networks, and services, among which are virtualizations. This system can easily monitor Cloud resources as well as on-premises systems and Azure services are among the products that Site24x7 is able to monitor.
The Site24x7 system includes many specialist modules that can be added on or free. Among these are a number of Azure tailored solutions. These are called “integrations” and they need to be activated in order to add on specialized screens to the dashboard.
The Azure-related integrations available in Site24x7 Infrastructure include:
- Microsoft Azure
- Azure Files
- Azure PostgreSQL DB
- Azure Redis Cache
- Azure Cosmos DB
- Azure Backup
- Azure WebJobs
- Azure Functions
- Azure Gateway
- Azure SQL Database
- Azure Service Bus
- Azure IoT Hub
- Azure Maps
- Azure Search
- Azure ASP
- Azure ML
- Azure Analysis Services
The Site24x7 Infrastructure system is run almost entirely from the Site24x7 servers. One account can manage your on premises servers and services and your Azure systems together. However, the system does require an agent program to be installed on each monitor system.
The dashboard for Site24x7 is resident in the Cloud and is ca be accessed through any standard Web browser. The screens in the dashboard can all be customized through a drag-and-drop utility.
Site24x7 Infrastructure builds a map of inter-dependencies between server resources, services, and applications that support front-end software. The tracking of the included services of Azure builds up a picture of all of the activities that go into providing a website or a software package to users and enables identification of the root cause of performance problems.
Pricing: Site24x7 costs $9 per month when paid annually.
Download: Site24x7 Infrastructure’s Azure monitoring systems can be experienced on a 30-day free trial. You can get more information about Azure monitoring with Site24x7 and access to the free trial: https://www.site24x7.com/azure/
5. ManageEngine Applications Manager – FREE TRIAL
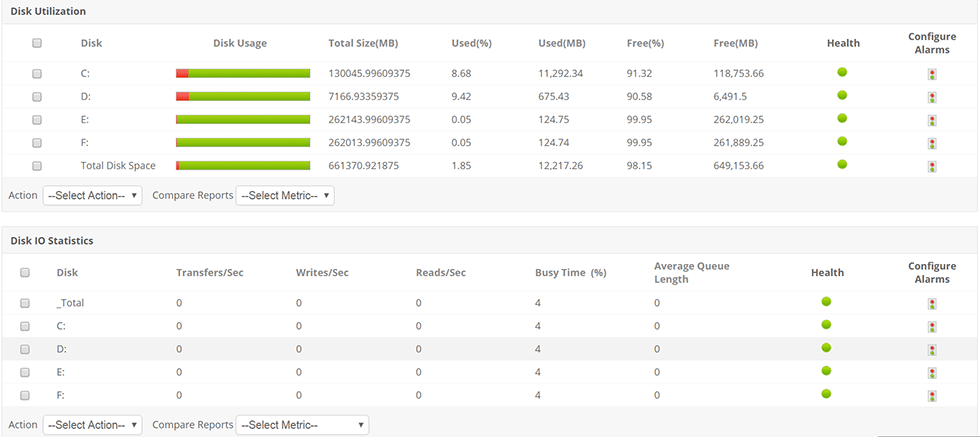
ManageEngine Applications Manager provides an overall, aerial view of an organization’s Azure environment, tracking the health and operational status on all virtual machines deployed within the Azure Environment. While Microsoft Azure supports a wide range of servers and allows users to deploy applications in minutes, making it indispensable to most organizations, without proper monitoring, servers rarely perform at maximum efficiency.
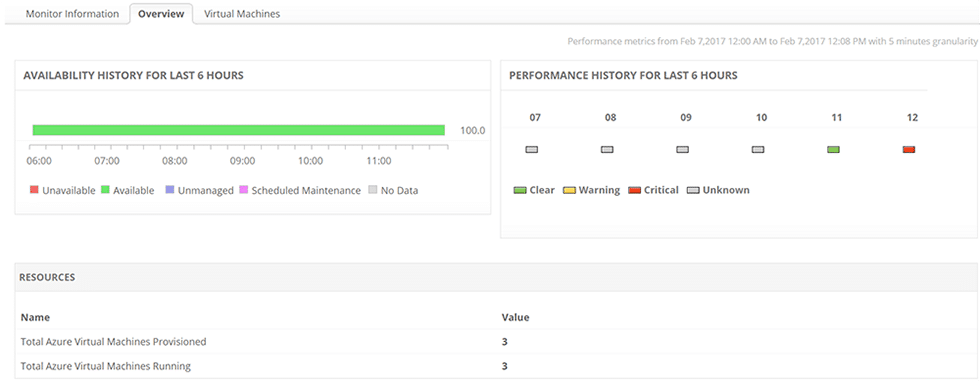
ManageEngine Applications Manager solves this issue with the constant tracking of key metrics, which are kept readily available. This enables system administrators to ensure that each virtual machine is running correctly, without any glitches, thereby avoiding unnecessary down-times and disruption of service.
Through monitoring memory and processor metrics of virtual machines in the Azure environment, ManageEngine Applications Manager assists system administrators in the effective planning of upcoming tasks and improving overall performance.
All of these metrics and information gathered related to activities of the network are viewable in elaborate graphs, further aiding in the fast identification of potential issues arising.
With the aim of increasing the efficiency of addressing issues before they affect end users and making troubleshooting easier, ManageEngine Applications Manager allows system administrators to configure alarms for different attributes of virtual machines.
The software ensures that alerts are sent out instantaneously if it detects unusual activity, while also sending out notifications if threads/ process counts surges. With the ability to react faster, system administrators are better able to manage and monitor the Azure environment, minimizing the chances of performance degradation.
Pricing: ManageEngine Applications Manager is available in a Professional Edition and Enterprise Edition. For the Professional Edition, pricing for a subscription license starts at $945.00 while a perpetual license starts at $1895.00. The Enterprise Edition starts at $9595.00 for a subscription license and $19195.00 for a perpetual license. You can access a 30-day free trial to assess the software and determine your network needs.
Download: https://www.manageengine.com/products/applications_manager/download.html
6. Paessler PRTG Network Monitor – FREE TRIAL
The Paessler PRTG Network Monitor\ provides a comprehensive overview of an organization’s entire Azure infrastructure through a centralized, customizable dashboard. With its full integration with Microsoft Azure and Martello iQ, all Azure resources are tracked with their performance and availability viewable in one overview. This, along with its prompt alerting system and automatic reporting feature, ensures the fast identification and resolving of issues arising while also keeping relevant co-workers and management aware of all situations occurring.
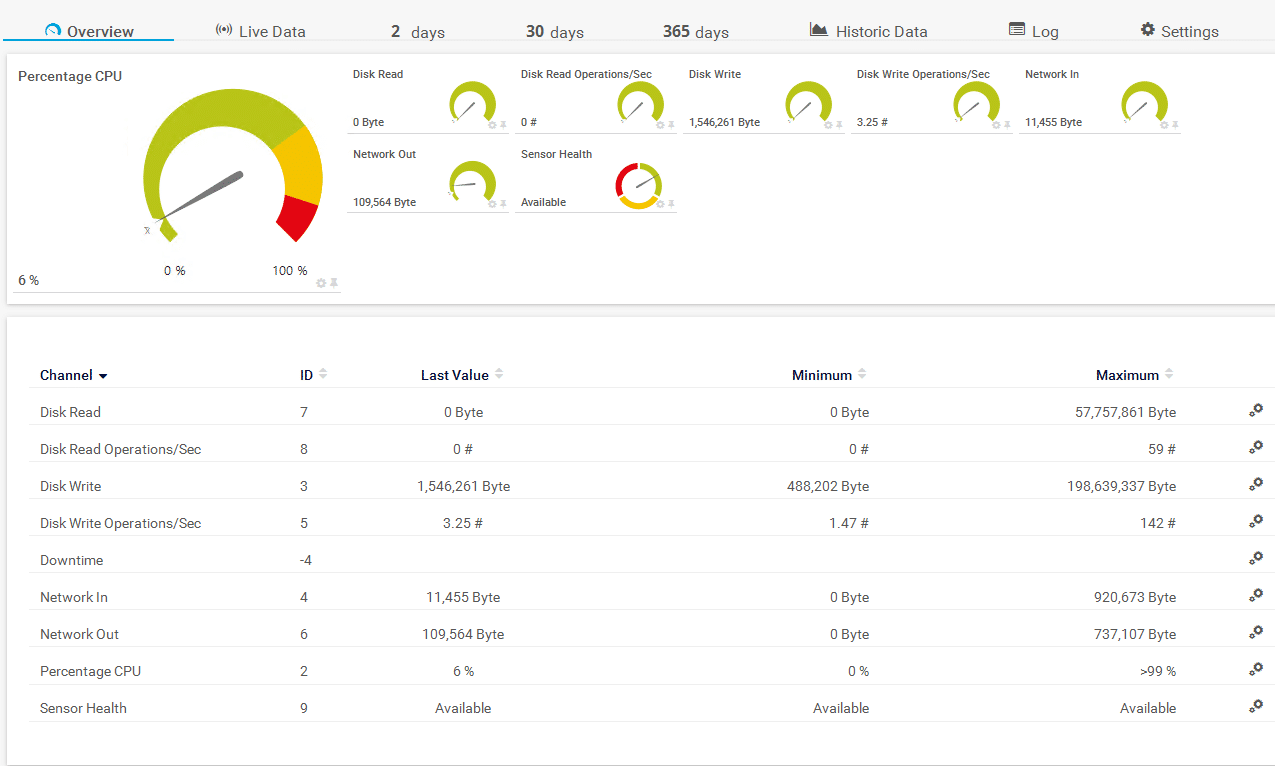
With the aim of ensuring that an organization’s Azure environment is functioning smoothly at all times, the PRTG Network Monitor allows for fast verification of its status even when system administrators are out of the office. This is possible through its compatibility with multiple mobile devices and its instant notifications when defined threshold values are exceeded, with the options of push notifications, email or SMS alerts.
The provision of 18 Microsoft Azure sensors, offered by Paessler’s partner AutomonX, which collects various metric values and information and reports relevant metrics back to the Paessler PRTG Network Monitor assists in this regard. The software further assists system administrators in reducing risks in the cloud, while also ensuring an organization’s local network is correctly adapted to cloud integration.
Pricing: An unrestricted trial version of the Paessler PRTG Network Monitor is available for testing and you can use up to 100 sensors for free. This will automatically switch to a free, limited version of the Paessler PRTG Network Monitor after 30 days, unless you chose to upgrade to a paid license. Options start at $1750.00 for 500 sensors and one server. You can download the 30-day free trial.
Download: https://www.paessler.com/download/prtg-download?download=1
7. Opsview
Opsview provides a unified insight into an organization’s infrastructure and applications running on Microsoft Azure, monitoring for performance and availability continuously to ensure services run efficiently and smoothly. With the aim of keeping monitoring simple and fast, Opsview allows system administrators to quickly discover and import Azure objects within a given Azure subscription automatically.
Dashboards utilized in Opsview display various monitored elements in a summarized, visual fashion, with the additional benefit of allowing the use of auto-refresh intervals to ensure the data displayed is current. Acting as an overall health indicator for the Azure environment, the dashboards can be displayed on large TV’s in an operation center, throughout offices, data centers and more. These two functions, used together, enables the faster identification and resolving of issues detected, with the further ability of easy navigation between multiple dashboards assisting with timeous reactions.
To provide the highest possible experience for customers, in addition to the monitoring of all metrics required to run Azure App Services, Opsview also monitors Office 365 applications and all applications an organization’s website depends on. This ensures effective service delivery which is paramount to an organization, while further avoiding unforeseen costs caused by a lack of insight.
Some of the metrics monitored in Azure App Services include number of requests and data bytes coming in and out, as well as response times. The support of elastic pool monitoring further simplifies data tier management and development, while Opsview’s virtual machine monitoring allows for a large range of computing solutions.
Pricing: You can test out Opsview Cloud here by signing up for a free trial to see if the product suits your needs. You can further contact the sales team here for pricing of the Opsview Cloud plan, which starts at 150 hosts, and the Enterprise plan, intended for organization’s needing to deploy more than 300 hosts on-premises. The details of these plans, as well as Opsview’s SMB plan, are viewable here, while the scheduling of a demo for Opsview Cloud is available here.
Download: https://www.opsview.com/product/trial
8. Dynatrace
Dynatrace provides advanced, comprehensive observability into an organization’s entire Azure infrastructure in a single overview. This extends to the hybrid, multi-cloud ecosystem while the software further scales across hundreds or thousands of apps and nodes with ease. With deployment, configuration and updates automated, Dynatrace aims to end all manual effort of system administrators.
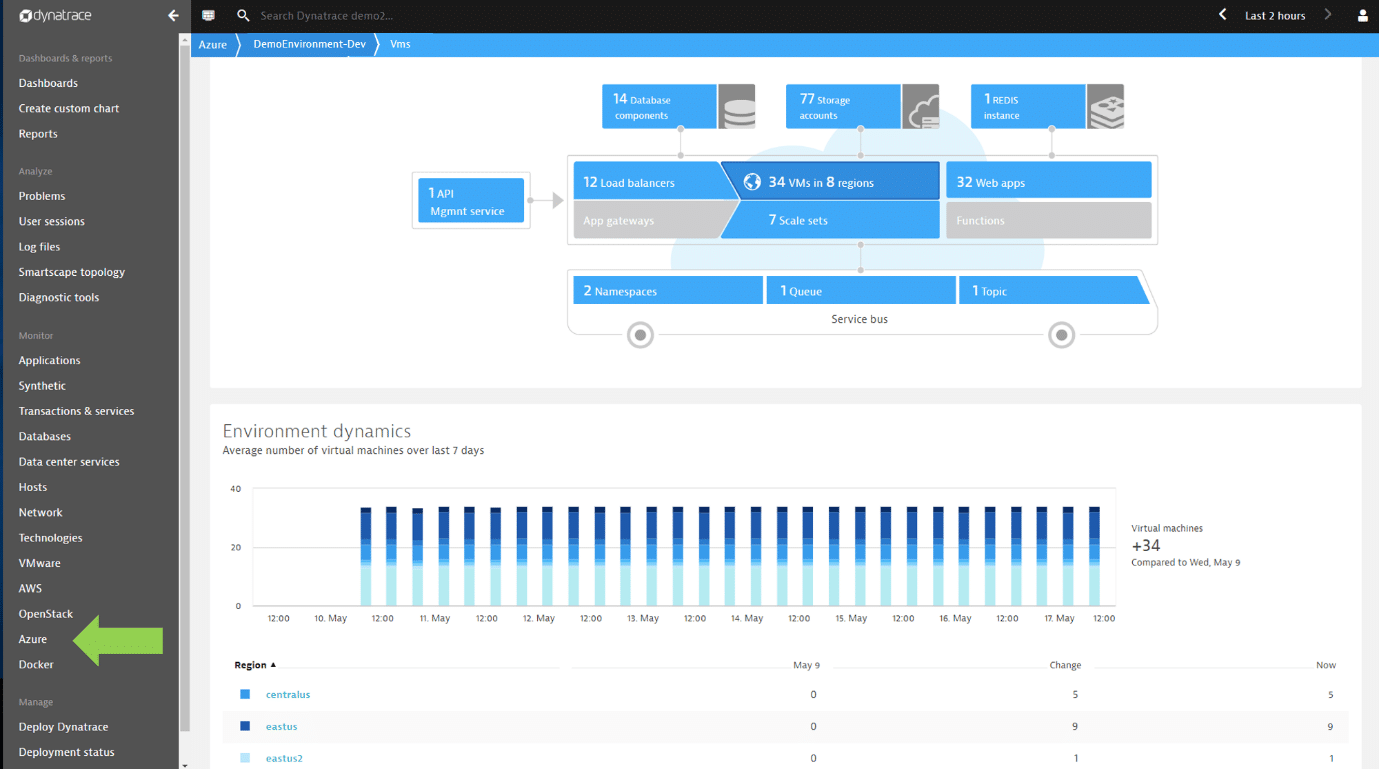
This goal is supported by its AI-powered problem identification and root cause analytics, allowing for fast, accurate and efficient monitoring and troubleshooting of applications, clusters and underlying cloud infrastructure. With the inclusion of container-based applications, this ensures that the health and performance in Azure environments is maintained at a high level. As an additional benefit, Dynatrace allows system administrators to have a working overview of everything while running two versions of the infrastructure simultaneously.
Dynatrace further provides full-stack observability, including metrics, logs and traces, within minutes, while continuous dependency mapping is made possible through its auto-discovery capabilities. With the goal of attaining cross team efficiency across an organization’s Azure environment, Dynatrace offers a single overview source for use in collaboration and innovation. This allows teams to proactively detect problems and work on resolutions wherever they may reside.
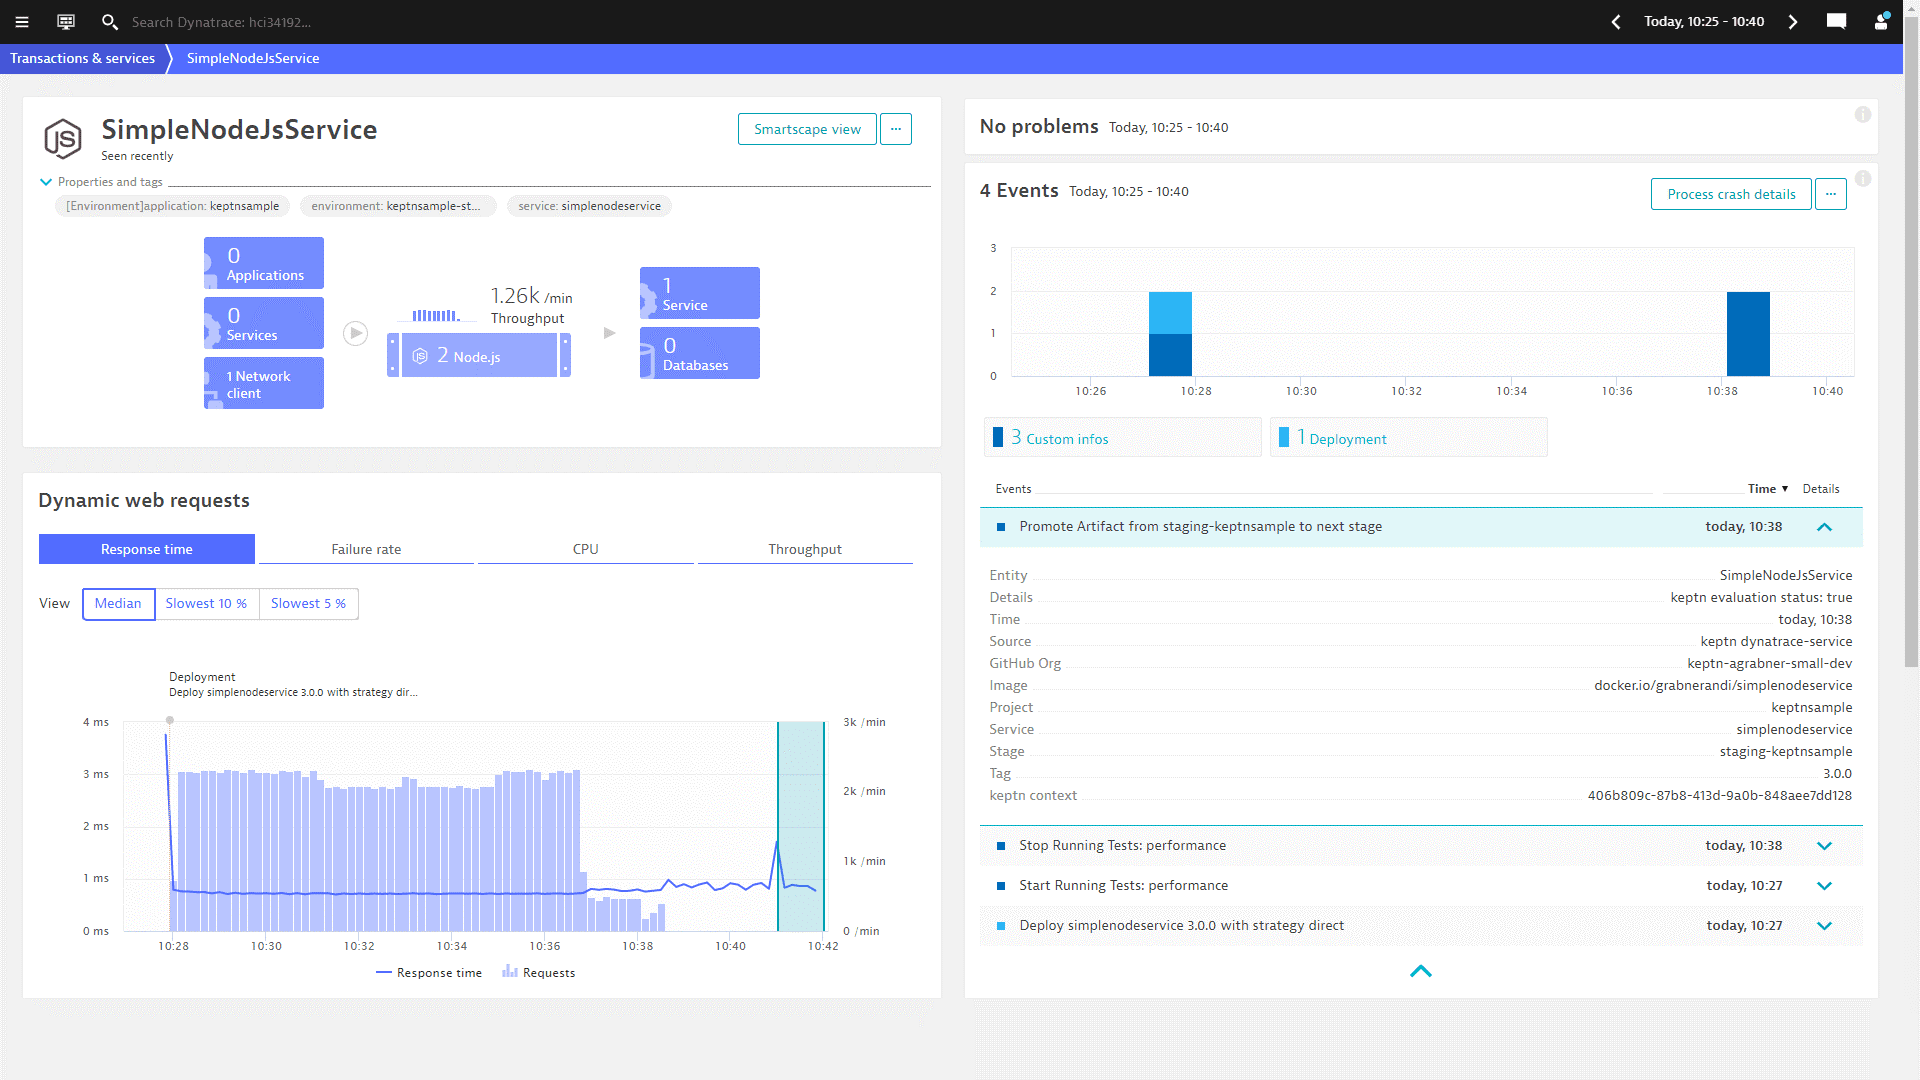
In this regard, Dynatrace’s AI-powered problem identification and root cause analytics significantly speeds up the process of identifying potential issues within the Azure environment. With its ability to scan billions of dependencies in search of root causes of problems, resolutions are achieved faster, decreasing the chance of the organization being negatively impacted.
Pricing: To gain practical insight into Dynatrace before deciding if it suits your organization’s requirements, you can start a 15-day trial here. Dynatrace starts at $69.00 per month for full-stack monitoring, billed annually, and is viewable here, along with Dynatrace’s infrastructure monitoring and digital experience monitoring plans.
Download: https://www.dynatrace.com/trial/
9. ScienceLogic
ScienceLogic offers a clear and concise overview into all of an organization’s Azure-based workloads, across multiple regions or comprehensively into single consoles in the Azure environment. With its pre-configured monitoring policies, based on Server Monitoring best practices, ScienceLogic allows for system administrators to begin monitoring immediately. All core services are monitored for health and performance, such as virtual networks, traffic manager, device groups and more, with performance comparisons available over extended time periods.
This, as well as its auto-discovery and interdependency mapping between Azure regions and services, supports system administrators in understanding relationships between elements. With this knowledge, system administrators are able to identify, troubleshoot and remedy issues faster, as well as monitor impacts on the Azure environment, ensuring it is run efficiently and without interruptions.
With Azure resources automatically discovered, ScienceLogic further ensures they are automatically kept up to date as they are added and removed. All assets within the Azure environment are organizable through automated functions though functions, groups and more for more precise and efficient management oversight. Its role-specific visibility, including hybrid and multi-cloud visibility, ensures system administrators approach the monitoring and management of the entire Azure environment consistently and effectively.
This granular oversight, allowing visualization into every aspect of an organization’s Azure deployment, as well as easy navigation across clouds, infrastructure on the premises and apps relationships, supports fast troubleshooting and resolutions. When combined with ScienceLogic’s alerting system, system administrators are able to proactively detect and resolve performance issues with speed and accuracy. This is supported further by ScienceLogic’s runbook automation, allowing for immediate response to availability or performance degradation within the Azure environment.
ScienceLogic, with its use of its SL1 platform, aims to make the monitoring and management of an organization’s Azure environment as easy as possible. To achieve this, ScienceLogic offers seamless integration with IT management systems for the full monitoring of an organization’s IT management ecosystem, with dashboards displaying information attained in real-time. System administrators can further rapidly deploy solutions to multiple customers at once. This takes little administrative overhead, while the ability to grow current cloud and hybrid IT services as well as the create new managed services for Azure and more with ease is also supported.
Pricing: ScienceLogic offers four different packages, namely Base, Standard, Advanced and Premium, details of which are viewable here, with pricing available on request, while a personalized demo for ScienceLogic is available here.
Download: https://sciencelogic.com/
Conclusion
With the complexity of Azure environments, including required visibility into hybrid and multi-clouds, third party tools have become crucial for an organization’s monitoring and management to be effective. As this continues to play a key role as technology develops at an increasing rate, this task only becomes more difficult.
Multiple tools are designed to monitor the Azure environment, each monitoring a variety of parameters with different levels of granular insight available. Whether coming from a smaller or larger organization, the monitoring capabilities of these tools are customizable to meet an organization’s specific needs, keeping in line with the flexibility of the Azure environment.
With the overall aim of ensuring the performance and availability of the Azure environment is always up and running effectively in organizations, we have listed multiple tools that can assist in this regard below.
We hope the information provided here helps with your choice of which of these Azure Monitoring Software and tools best fits with your requirements and budget.