Modern companies rely on virtualization to get work done.
There are a few different ways of accomplishing this, but by far one of the most popular ways is by using VMWare’s ESXi platform.
It is a complicated system to setup initially and it requires specialized talent to administer it and ensure that it is maintained and monitored properly.
VMWare offers its own set of recommended monitoring tools, but we want to look what else is on offer.
We will be looking at SolarWinds Virtualization Manager and how it works with your infrastructure, making the job of monitoring that much easier.
We want this article to show you some of the best features that SolarWinds Virtualization Manager has to offer, and why you might consider it for your own daily needs when using virtualized servers .
We want to go into some of the capabilities of this software system and show you some of the features that you will find indispensable in your day to day operations.
SolarWinds VM is a stable and reliable system with tons of extra functionality to manage your ESXi servers.
Key Features that are mentioned on Virtualization Manager product page are:
- Comprehensive virtualization performance management
- Powerful capacity planning tools
- VM sprawl management
- Predictive recommendations
- Manage across on-premises, hybrid, and cloud
- Visibility across the entire application stack
Where is VMWare ESXi server used and what is it?
VMWare ESXI is used for virtualizating bare-metal systems and it operates as a hypervisor.
A hypervisor is a software layer that controls virtual machines and gives them direct access to the resources of that bare-metal server.
There items include RAM, CPU and storage.
VMWare’s ESXi gets installed physically onto the server on a local storage device such as a hard drive or high-performance memory card.
This is the system that the server boots up into when the bare-metal server starts up.
It has very little overheads, so it doesn’t take many resources away from the virtual machines that will be running on that server.
The virtual machines then have a direct path to the resources that we mentioned above, so you can run multiple servers from one single hardware stack.
This allows you to be more flexible and agile when you need to provision new servers for increased capacity.
The reason why most IT teams are in favor of this approach is that the costs associated with new servers is prohibitively high for most companies.
If you needed to purchase a new server for every new instance that you required then you would need to allocate more space for each server to be installed in, more utility costs, man power to install and configure the physical hardware.
It will give you the ability to cut costs, run your systems more efficiently, save on space in your data center, and a much easier way to monitor and administer your servers.
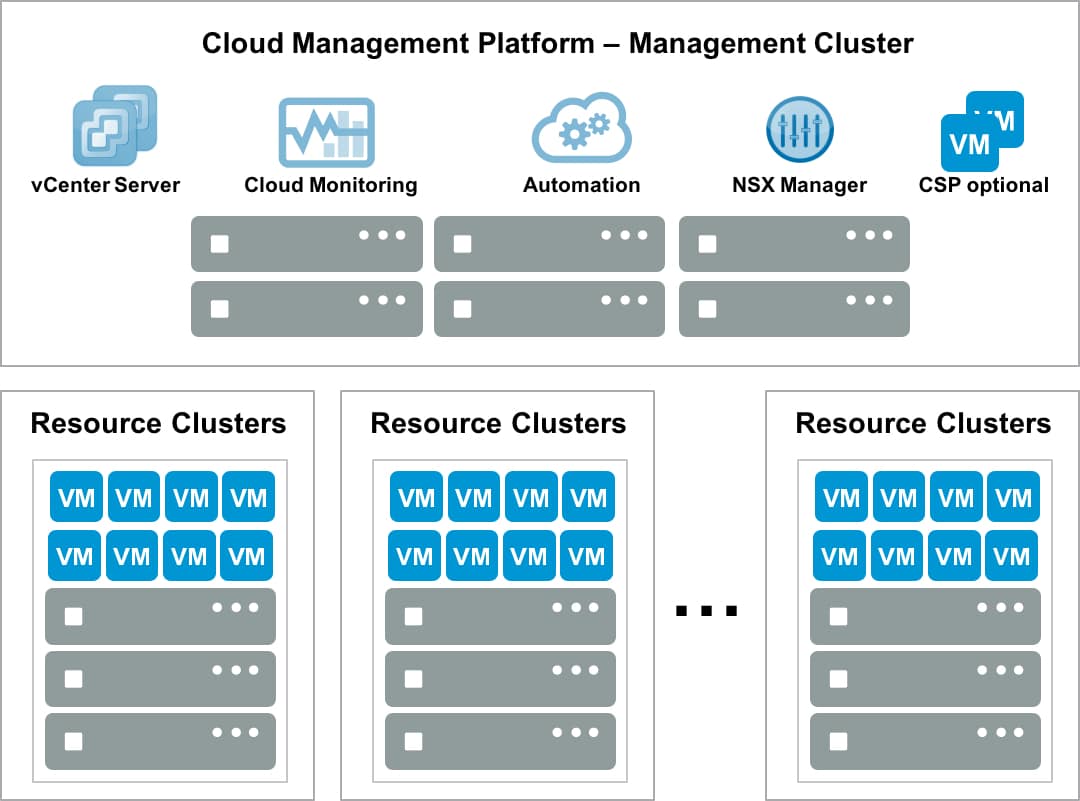
VMware ESXi Clusters and SolarWinds Management
When you are running a massive collection of servers that span across multiple locations then you will need to start thinking about High Availability groups, Failover capabilities and Disaster Recovery.
When you start using this kind of setup you encounter resource pools and clusters, which come with benefits that make your applications, data bases and hosts work faster and harder than traditional physical servers.
 \
\
You are able to combine the multiple resources from these virtual machines and allow them to work together for improved performance and reliability.
Setups like these are traditionally managed from within VMWare’s own software.
There are many roles that this kind of configuration supports, which are great for uptime, high performance and effective resource sharing between virtual machines.
VMware ESXi Server Monitoring
In order to manage and monitor your setup on both the server level and the host level you need to understand the metrics that need to be monitored and looked at closely.
There are 2 levels of monitoring that you need to consider.
A virtual machine that runs Windows will show you the resources that the operating system is using.
The hypervisor monitoring will show you how many resources the server is using overall, and how much it has left to provision to the virtual machines that are running on the hypervisor.
Once you know what you have to monitor, you need to configure the way that you receive alerts and alarms.
This is done by configuring the thresholds of these alerting resources so that your teams can receive warnings when a threshold has been breached.
Having access to this deep level system overview will allow you to see issues ahead of time before they turn into a major issue or system outage.
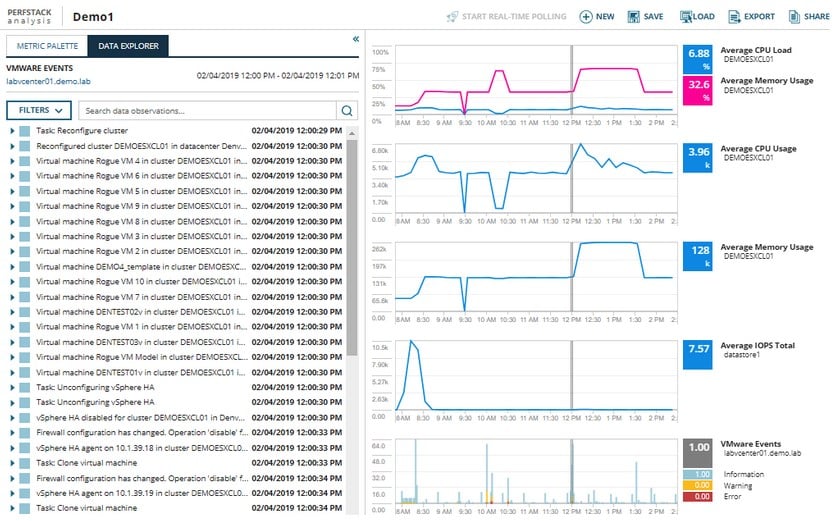
Graphical Output with Charts
The system has access to graphical outputs like graphs and charts which will give you a much better understanding about the current state of your virtual machines.
Looking at data in a visual format is much better when you need to understand what is happening with the resource allocation of your hypervisor.
Using the Command Line Interface
There are many tools available for administrators to run so that they can drill down into specific details about your current ESXi setup.
Executing these tools from the command line will give you access to parts of the system that are not accessible in the graphical user interface.
Health Monitoring of Hosts
If you want to know how your hosts are faring, then you need to have health monitoring enabled on your various instances.
There are built in health services that monitor ESXi right out of the box, but there are third party options available too.
Notification Triggers
You can configure items like alerts and alarms that will either perform an automated action when a threshold is met, or you can have an automated alert trigger so that you are notified when there is an issue.
You can also automate actions that you would normally perform manually which with streamline your workflow.
These efficiencies add up over time and will free you to work on more pressing issues.
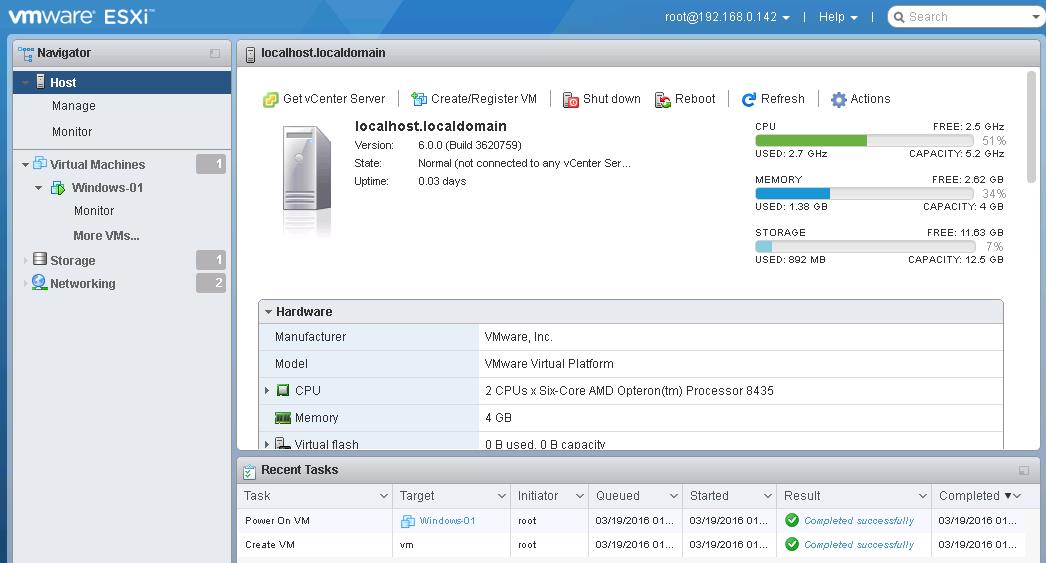
Connecting to VMware ESXi Server
The default method of connecting to one of these installations is through the built in VMWare ESXi client called vSphere.
This comes in 2 different version, the install-able client and the vSphere Web Client.
Both of these versions connect to the ESXi server and you can view important stats such as hardware resources and virtual machines that are running on the box.
You can also provision additional virtual machines from this application, as well as adjust the peripherals such as ethernet, CPUs, cores, memory and storage.
In order to connect to ESXi host you will need to be connected to the same network segment.
All of the connections are done over the network, so you do not need physical access to the server in order to connect.
Once you have connected successfully you will be able to login and start configuring your virtual machines so that you can get things setup.
Managing VMware ESXi
As far as managing your VMWare ESXi installation goes there are a few different options.
You can fire up ESXi and use the remote utilities that it has, or you can try the VI client which has a graphical user interface.
You can think of the graphical tool as being used for setup, and the CLI as being used for writing scripts and running applications and other advanced automated tasks.
You can get more or less the same work done with either of these methods, although it will depend greatly on which format you are comfortable using when it comes to using these tools.
Command line tools are traditionally preferred by people with more experience, and that have advanced requirements that are accessible via command line switches and parameters.
The graphical tool will lack some of the advanced functions that are offered by the command line tool, but it will definitely get the majority of tasks complete.
The Vi client connects directly to the Virtual Center if you need it to, or alternatively you can connect to and ESXi host.
In both instances you can use either the command line session tool, or a terminal prompt in order to send and receive commands and output.
There are some setup caveats and limitations that you need to be familiar with before successfully connecting the services to your hosts.
For instance, the requirement is that the system that you are connecting from must be recognized by the Virtual Center tool in order to successfully connect and start configuring and managing that instance.
It is a good idea to locally configure your user account access privileges when working with an ESXi system.
Each command will require set access so you must ensure that user access is fully configured before you try and run any commands on the target system.
IF you do not have appropriate privileges setup then you will not be able to run certain commands.
The user setup for this kind of environment is less than ideal for a few reasons.
The main issue is that in order for you to properly incorporate a new user into the management role of your host, you need to recreate all their permissions again for a new authorization to access data on the remote host.
This means that you need to recreate local accounts for the same box, even though AD credentials might already exist.
This is not the best way to manage credentials, especially because it is not centralized.
SolarWinds Virtualization Manager (VMAN)
As we have seen so far there are some built-in tools that can help you to configure and manage your ESXi hosts without needing to download additional tools.
The built-in tools can be somewhat frustrating for someone that is new to the platform though.
If we then add to that the difficulty of the repetitive setup of users that need local access to the machine as well as network access, then you start to see a picture emerging.
SolarWinds realized that this gap in the market exists and they have developed their own monitoring and configuration solution for ESXi, SolarWinds Virtualization Manager (VMAN).

SolarWinds is known all over the world for creating user interfaces that make you feel like a pro.
VMAN is no exception here, and it offers a very easy navigation and configuration platform for you to use.
The layout of the application is customizable, and the way in which servers are monitored means that you will be well aware of issues before they come up.
SolarWinds uses a combination of SNMP and other scanning tools in order for it to map out the environment of your network as it relates to your virtual machine infrastructure.
All of these user-friendly capabilities help to take out a lot of the guess work when dealing with a host system like this.
By using a flurry of notification data for your specific data requirements you have unprecedented access to the current state of your virtual machines and hosts.
It does an excellent job of showing you which virtual machines need attention for reasons such as repeated alerts on a specific virtual machine, or for virtual machines that are under heavy load for a long time.
In these instances, it is easy enough to resolve simple issues like this by allocating more resources for the affected servers.
This is not to say that throwing resources at a server is necessarily the best option every time, but it is good to know that you have the option from within the SolarWinds application.
To help you with deciding on how much or how little your server needs you can rely on VMAN to help you get it done quickly.
If you are not sure how to proceed then you can use the built in right-sizing technology to select the hardware specs that are lacking within your system, which will save you time if you are uncertain of the best way to go about resolving those hardware deficiencies and errors.
These are accompanied by VMWare directives that will clear errors automatically based on the selection hat you choose. The idea is that your server will be back in peak performance territory in very little time.
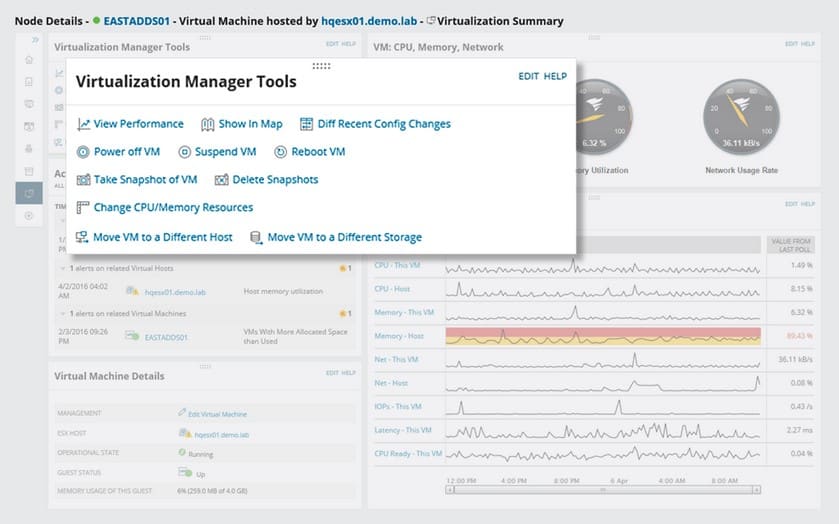
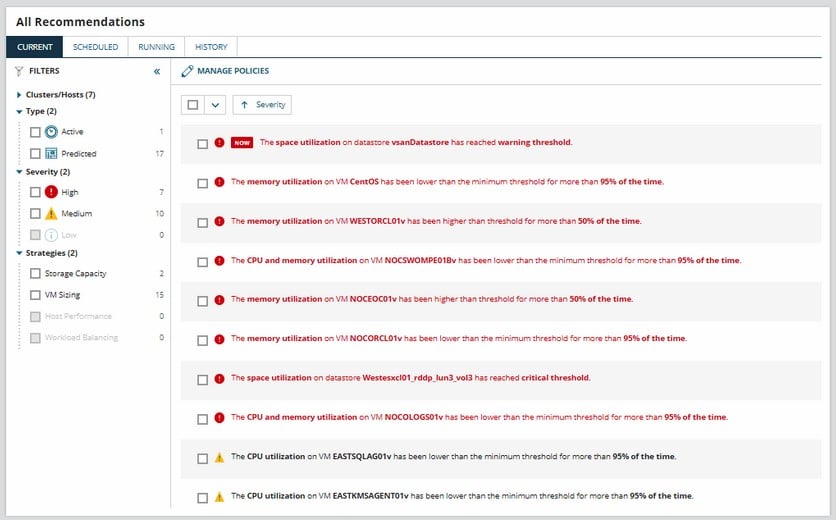
VMAN gives you access to detailed alerts which will inevitably help you optimize the VM performance monitoring within your environment and network.
In order to do this successfully VMware uses metrics as well as counters to analyze VMware performance.
From here it can make knowing which of the many resources that VMAN is preconfigured with are available.
VMware also uses counters and thresholds which needs to be periodically checked and adjusted for you reporting and alerting to be accurate.
Alerts are segmented into ‘potential’ and ‘active’ fields which lets you see which issues ongoing and which ones are going to be a problem soon.
This is great when you are fault finding and proactively administering your setup as it lets you plan for any potential issues, minimizing your downtime.
From this menu context you can also look at the conditions that activate triggers, you can look at historical data, and even get recommendations for solving issues.
All of this data ties back to VMWare specific terminology which gives you a greater understanding of what you need to do to resolve issues faster.
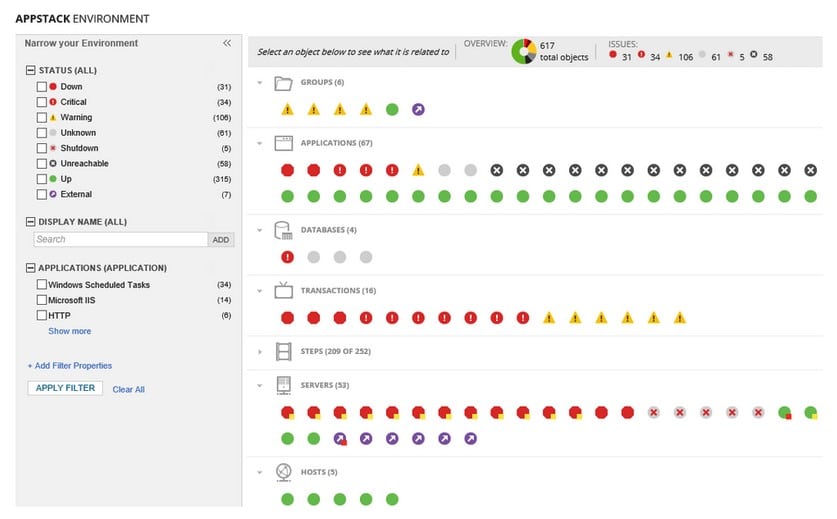
VMAN helps to mitigate some of the most often occurring issues with VMWare setups.
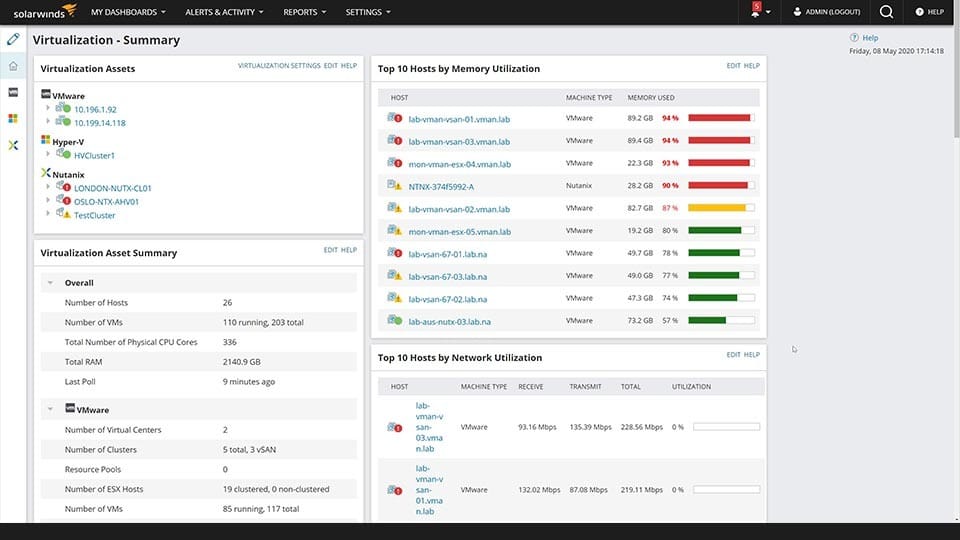
Handling so many virtual machines, each with their own CPU, memory and storage allocations can get very confusing, even for a system like VMWare’s ESXi. VMAN gives you a detailed overview of the current state of your setup, which you can then change and edit to resolve issues as you find them.
Examples of this are CPU over utilization, memory, and storage.
All of this is accessible via the dashboard which you can change to suit your personal preferences.
VMAN’s ability to emphasize issues as they happen, makes it a great tool for maintaining uptime and operational capacity.
When you combine the alerting and notification capabilities of the application with all of its already impressive features then you end up with a formidable host reporting platform for your VMWare infrastructure.
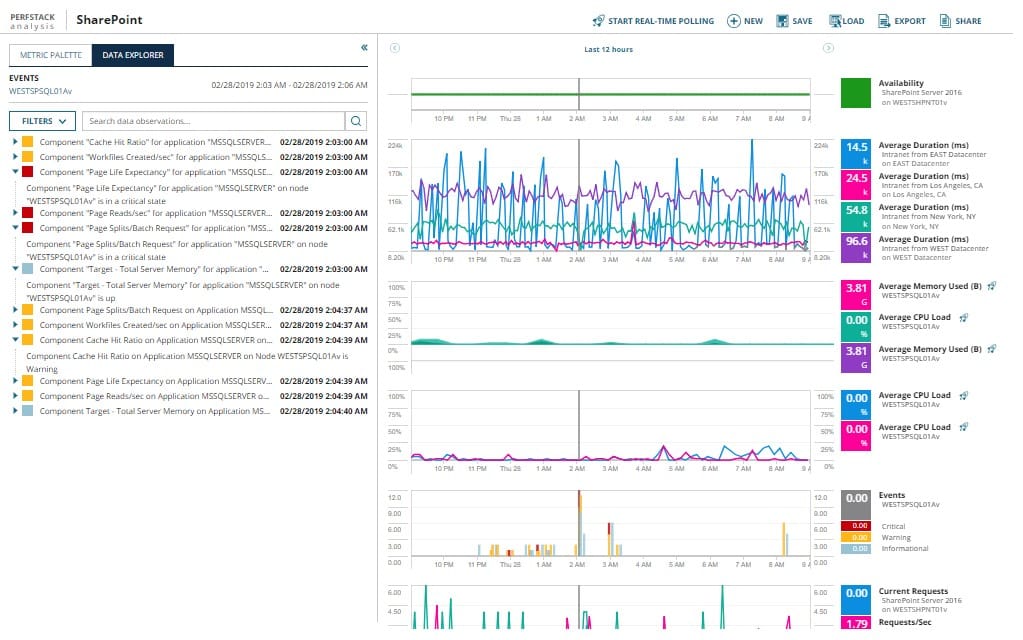
Graphs and charts can be applied to historical data which will give you a greater understanding of how your systems are currently handling their respective loads.
Having an overarching window into the operations of your system is highly beneficial, especially if you need to understand the system’s requirements in real-time.
If you are in the market for a virtualization platform then VMWare is definitely something you should consider implementing.
It is a production ready, hardy system that is bullet proof in most applications where uptime and operational capacity are mission critical.
You will find VMWare systems running the back ends of many corporations that value flexibility, performance and redundancy.
Although the underpinnings of this technology are complex and complicated for the average person to understand, but the management and usage of ESXi systems doesn’t need to be.
VMAN takes the complexity out of managing your virtual infrastructure.
Conclusion
In this article we have gone through all of the details of what ESXi is, how it works, and how you can use it to manage your infrastructure of virtual machines in your own business.
There are many great features that you can leverage with this technology that will make your business more flexible and agile while cutting costs and improving efficiency.
SolarWinds VMAN adds additional functionality and features by simplifying the process and improving accessibility to graphical data about the way your systems are running.