If you run an enterprise level network, then you probably know about all the different pitfalls that can affect your network and data operations. Malware, internal and external threats and hackers can all present challenges to your network performance and security. A packet sniffer can help you to investigate traffic on your network down to the smallest detail.
You can inspect headers and frame information from packets of data and will help you to discover things like false addressing, hidden payloads and many other important pieces of information.
What does a packet sniffer do?
A packet sniffer goes by man different names that you might have heard before, like protocol analyzer or network analyzer. You can get dedicated hardware versions of these devices that plug directly into the network, or software derivatives like the ones we will be looking at it today. They look at the data flows on your network and drill down into the details so that you can find irregularities and abnormalities that are acting upon your network so that you can take action and mitigate any threats and fix any issues before they become a much bigger problem.
Why would you use a packet sniffer?
A packet sniffer is not the be all and end all of network analysis. Instead, it forms one of many different avenues of investigation and troubleshooting. You would therefore use a packet sniffer to help you accomplish goals that your antivirus, antimalware, firewall, data loss prevention, and many other services and applications cannot assist with. Instances where a packet sniffer will help you to get information from your environment are plentiful, especially where there are complicated setups with multiple layers of routing and lots of users and devices.
How does a packet sniffer actually work?
A packet sniffer simply opens up a channel to listen to network flows. It intercepts all data flowing across its interface, and if not configured to filter out anything then it will grab every single instance of data as it is detected. It does not necessarily have any intelligence behind it while it performs data gathering operations. After your packet sniffing has been completed and you save your capture file onto your computer you can perform additional steps on it to find specific fingerprints of malicious behavior and items of interest that need to be investigated further.
Best way to use packet sniffers?
The best way to use a packet sniffer is to plan your investigation before you even get started. You need to think about the identified issue that you are trying to investigate, and then think about the potential attack vectors that it could be comping from. If your target device is running in a production environment, then you need to understand how the additional load of a packet sniffer might affect your operations. If there is a specific issue that occurs randomly then you need to be ready to run your packet capture operation when they incident begins. This means that additional resource planning and availability needs to be planned out as well.
The Best Sniffing Tools for Enterprise Network Monitoring
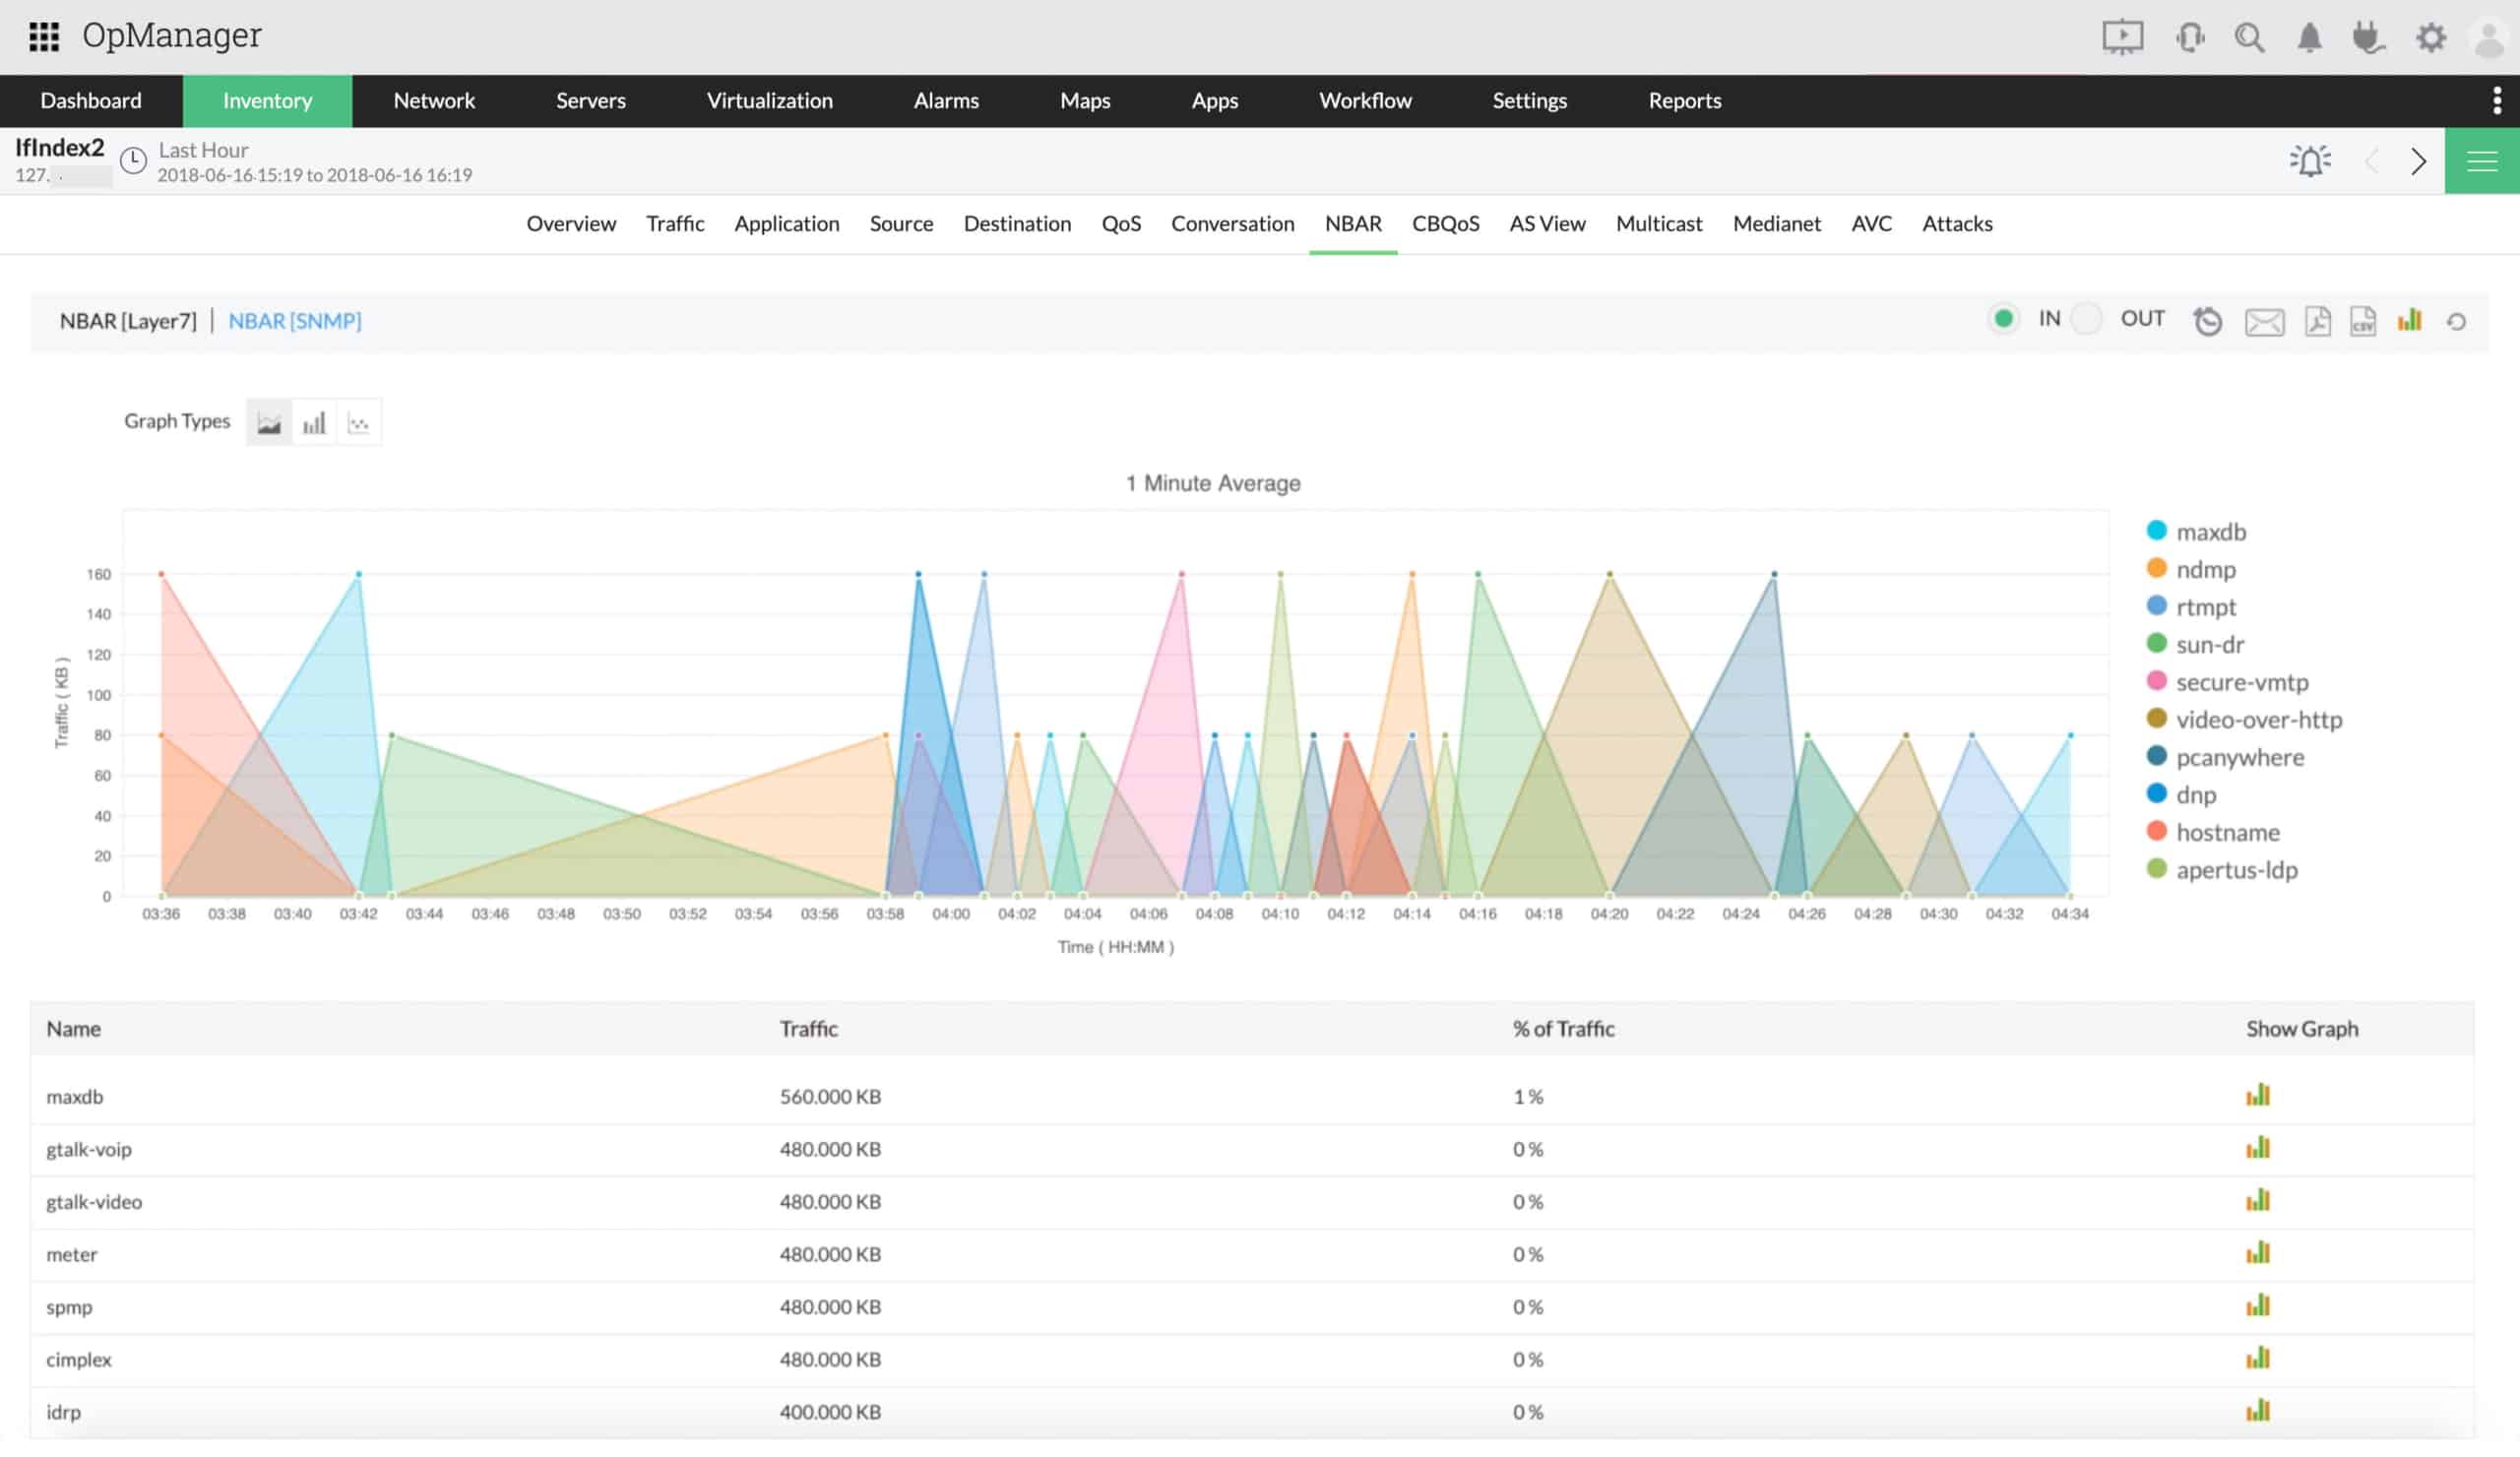
1. ManageEngine NetFlow Analyzer – FREE TRIAL
ManageEngine NetFlow Analyzer runs on different operating systems, namely Windows, Linux and even iOS as well as Android for mobile devices.
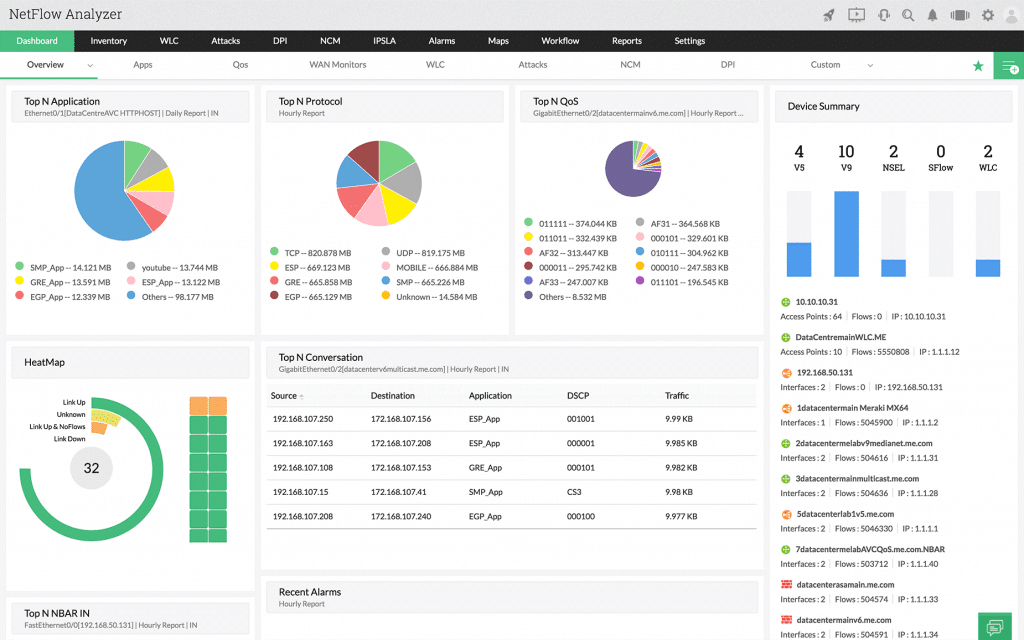
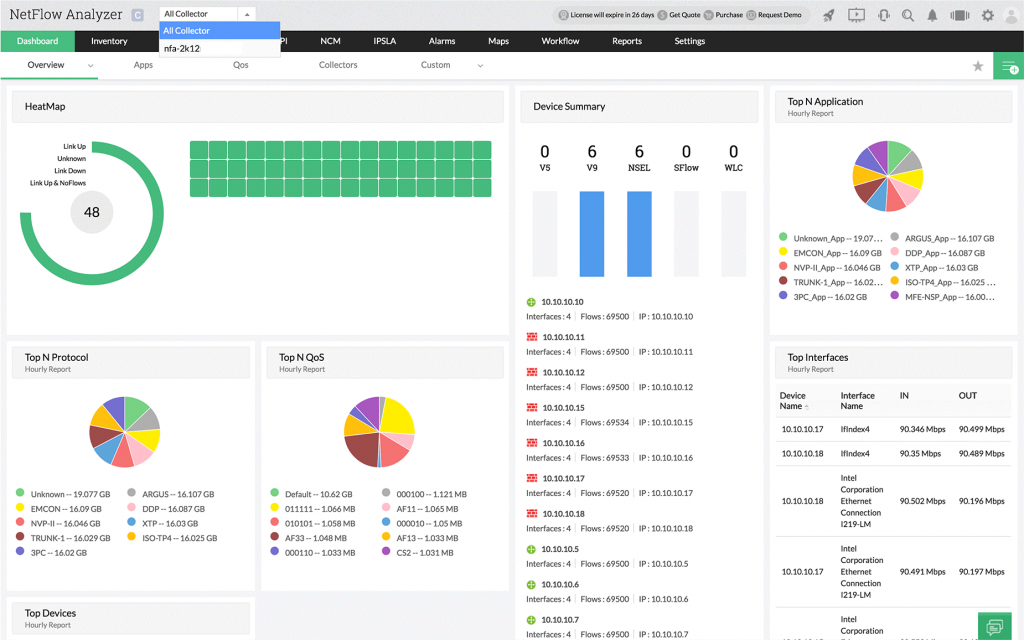
NetFlow analyzer is an advanced suite of network-based tools that will give you deep insight into the technical elements of your network. Netflow Analyzer allows you to monitor bandwidth usage as well as capture data packets for inspection. From the main console window, you can view the most active devices on your network, which can help you to enforce network usage policies if you find any discrepancies.
Why do we recommend it?
While we were putting it through its paces, ManageEngine NetFlow Analyzer allowed us to monitor and analyze network traffic, identify bandwidth-hungry applications, and allocate resources effectively. We recommend it for its robust traffic analysis capabilities, user-friendly interface, and ability to optimize network performance, especially in environments with high bandwidth demands.
The main area of technical analysis comes from the NetFlow, J-Flow, IP FIX and other integrations. This gives the application a much better integration layer, giving you the ability to tap into devices on a data packet level. NetFlow Analyzer then grabs this flow data and creates statistical models that are human readable.
The best part is that the graph generation is done in real time, giving you unprecedented access to your network’s inner mechanics on demand. If you notice any strange behavior you can escalate the problem before it turns into something far more serious. The ‘Top Talkers’ view on the network dashboard is especially useful for identifying bandwidth abuse. If you have a specific device on your network that needs to be inspected, then you can select specific interfaces on a device and home in on activity on a minute scale.
You can view the current traffic on the device by monitoring the in and out traffic and even see what speed the device is transmitting at, as well as the packets being transmitted and received.
Who is it recommended for?
In companies such as telecommunications providers, this tool is valuable for analyzing network traffic, ensuring quality of service, and addressing congestion issues.
Schools, colleges, and universities can leverage NetFlow Analyzer to manage their network infrastructure effectively, ensuring seamless online learning and administrative operations.
ManageEngine NetFlow Analyzer is designed to provide a user-friendly experience, making it accessible to a broad range of users with varying levels of expertise. Users should have a fundamental understanding of networking concepts, including IP addresses, ports, and network protocols. This knowledge will help in interpreting the data provided by NetFlow Analyzer.
If you would like to try it out for yourself then you can find the download page. Select the version for your operating system and then install it to try it out for 30 days as a trial for free.
2. Site24x7 Network Monitoring – FREE TRIAL
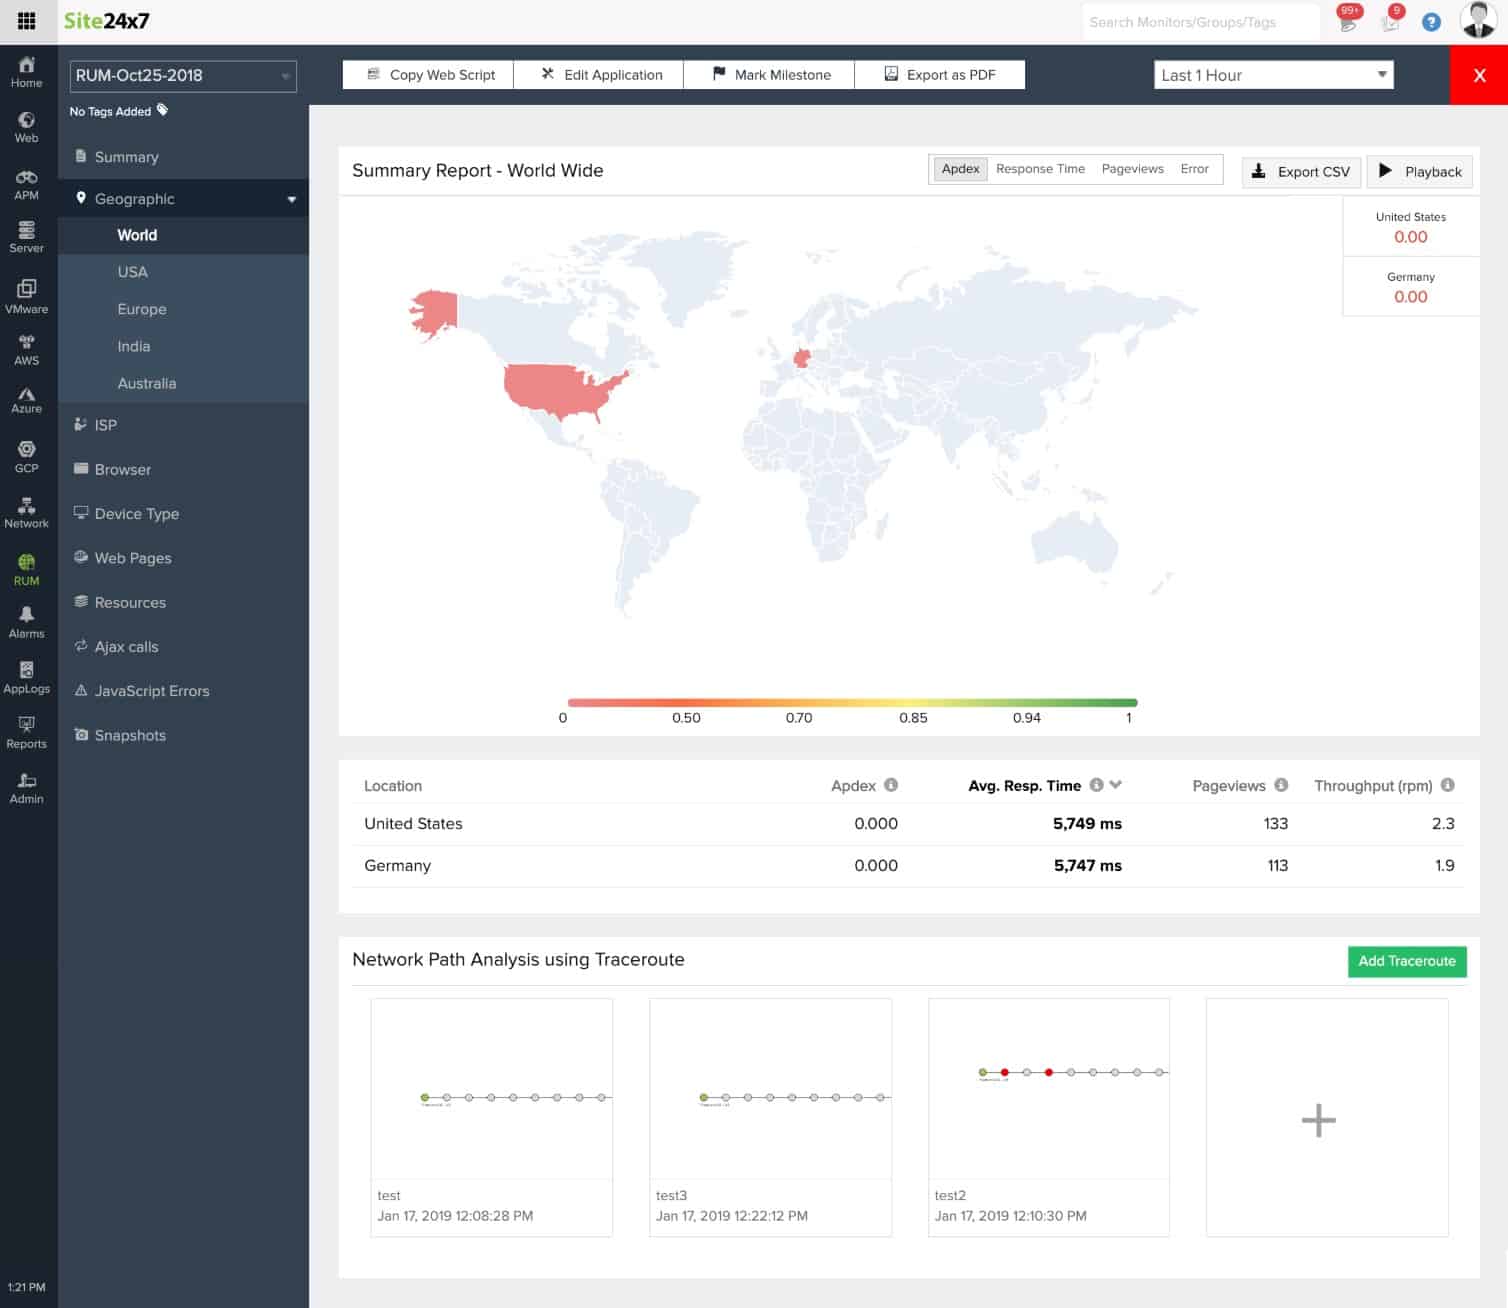
Site24x7 is one of the best packet sniffing tools that help administrators investigate devices and pull metadata. Using this cloud-based solution, users can automatically find out all the devices connected over a network. After collecting and correlating the data, the tool helps draw maps using its comprehensive feature and runs thorough analysis. With a properly organized device structure, users can easily pinpoint the issue and troubleshoot faster.
Key Features
- Supports automatic network discovery
- Alert options and insightful reporting
- Network topology maps
- Supports Inventory creation
Why do we recommend it?
You can select from a full range of monitoring services at Site24x7 to keep tabs on your performance-related problems. It even sets off alerts and notifies administrators on the Site24x7 dashboard to detect anything suspicious.
Since the tool offers a wide range of features, you would no longer need to pay extra for third-party programs to monitor your network’s components. You can monitor any device—firewall appliances, load balancers, switches, and routers—from a single panel.
Who is it recommended for?
The tool offers different monitoring services, including infrastructure monitoring, application, and network monitoring at a good price. As a result, both small and large firms can use the network monitoring tool for packet sniffing, tracking devices, and other operations without any hassle.
Pros:
- From a single dashboard, users can keep track of all their networks, servers, and infrastructure
- Allows watch over status data using SNMP and run in-depth analysis
- Finds out all network devices automatically and maps them for thorough analysis
- Easier to keep track of unusual patterns, user behavior, and other network technicalities with the Site24x7
Cons:
- Exploring the wide range of features offered by Site 24×7 might take time to fully understand
Site24x7 offers a 30-day free trial.
3. ManageEngine OpManager – FREE TRIAL
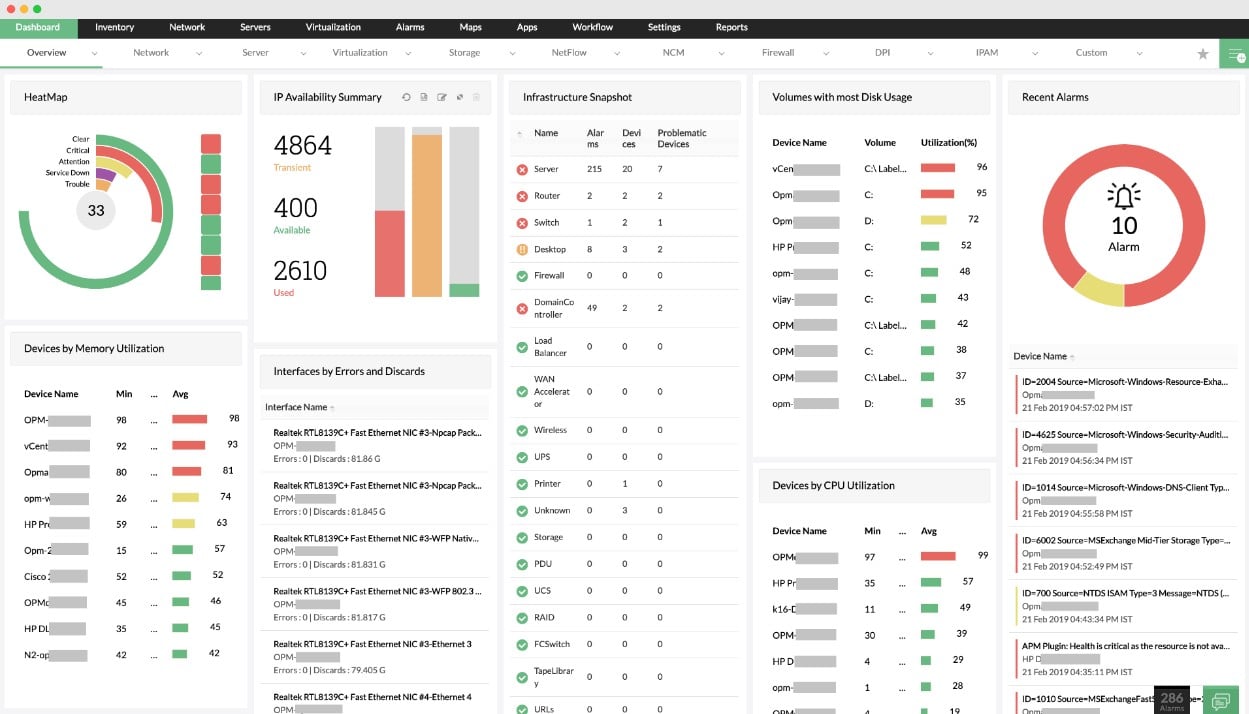
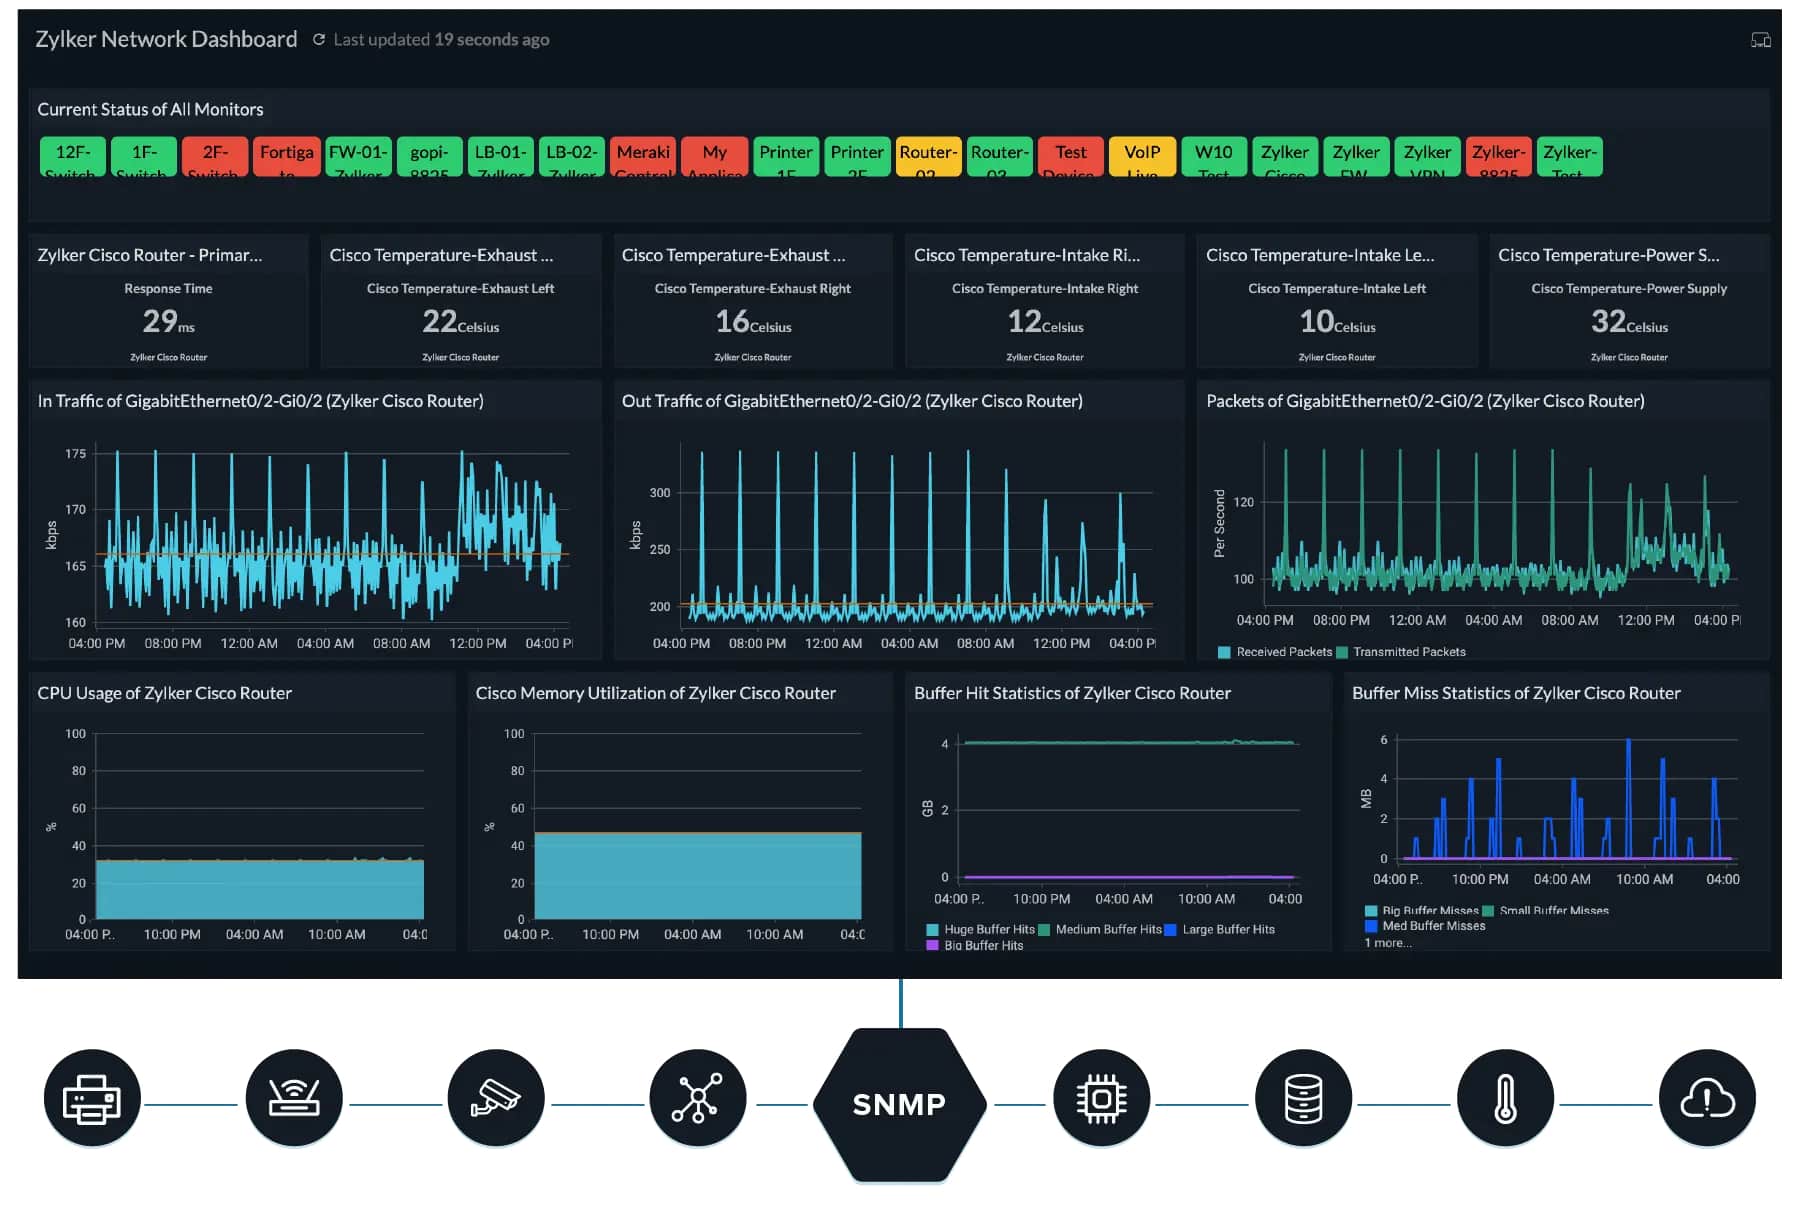
ManageEngine OpManager is an end-to-end monitoring tool that supports packet sniffing and bandwidth analysis. It uses ICMP pings for sniffing packets and identifying the cause of packet loss. Typically, it sends one ping per second between hosts and records the same to identify how many times the packet is lost. This approach provides accurate information about packet loss, so you can identify the cause and fix it immediately.
Key Features:
- Uses packet sniffing to provide information about a device’s availability.
- Checks the rate of discarded packets and the potential cause to improve the user experience of applications.
- Monitors configuration changes.
- Offers threshold-based smart alerts, so you can take the required actions quickly.
- Reduces false alerts by adapting thresholds to meet changing real-world requirements.
- Generates elaborate reports.
- Displays data on intuitive dashboards.
Why do we recommend it?
We recommend OpManager for its comprehensive approach to packet sniffing. It pings every second to identify where the loss is happening and the potential cause of the same, so you can take corrective action right away. This information is displayed in a way that’s easy to understand. You can even drill down into the metrics on the dashboard to find the information you need.
A notable aspect of this tool is its smart alerts. It compares the metrics against established thresholds and sends alerts when they are breached. You can also adjust the threshold values to avoid false alerts.
Who is it recommended for?
It is recommended for organizations that are facing network congestion issues and those that require extensive bandwidth for running critical operations. It is also a good choice for organizations running thousands of devices. A good option for MSPs as well.
Pros:
- Provides comprehensive insights into device health and availability.
- Monitors configuration changes.
- Supports threshold-based alerting.
- Well-suited for WAN and LAN.
Cons:
- The features can be too much, if you’re looking only for a packet sniffing tool.
OpManager’s Enterprise edition starts at $95 for 10 devices with two users. The Professional edition for the same starts at $145. Start a 30-day free trial.
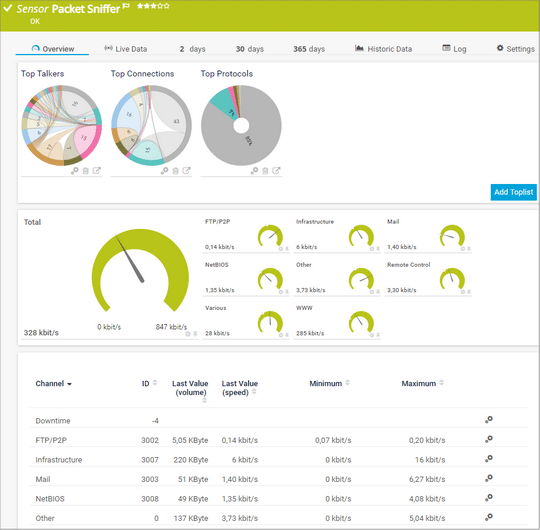
4. Paessler PRTG Network Monitor Packet and Sniffing Tool – FREE TRIAL
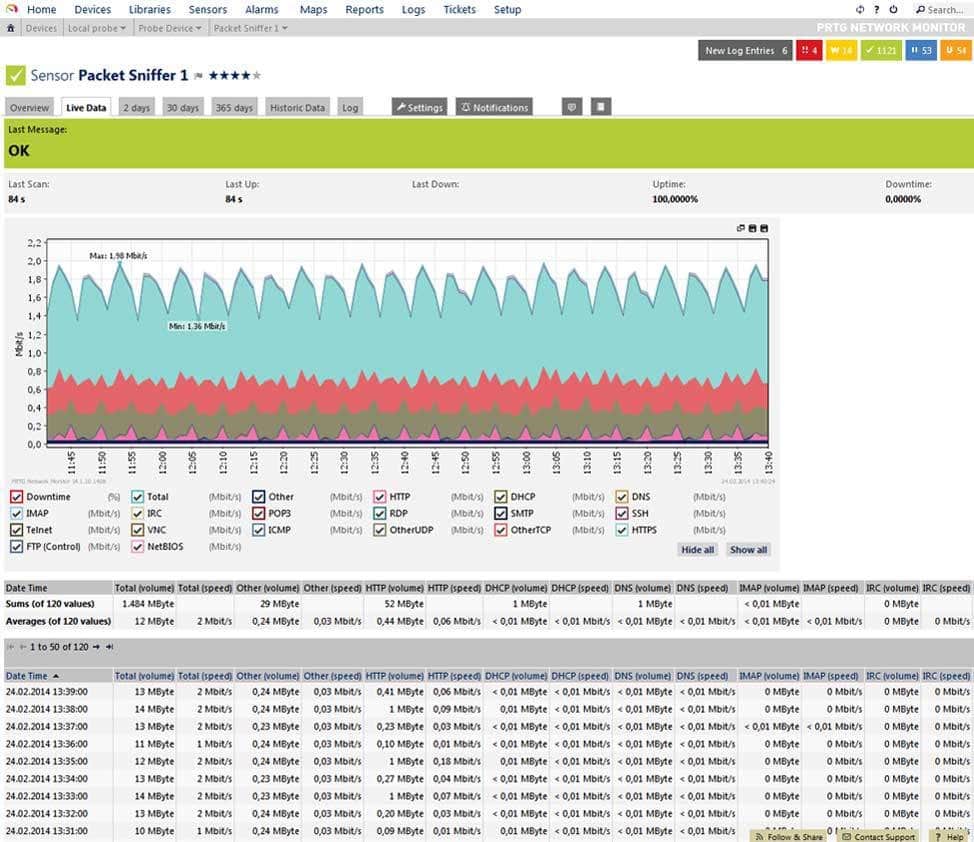
Paessler PRTG offers many different network monitoring solutions for fully integrating your monitoring and alerting solutions into the same platform. For this review we will be outlining this as well as the free to download Packet Sniffing tool that they offer. It is a general-purpose packet capturing utility that gives you access to low level meta data within your organization’s network traffic.
Why do we recommend it?
We were facing a sudden increase in network data usage, which resulted in skyrocketing bandwidth costs. We needed to identify which applications or devices were responsible for this excessive data consumption.
In the process of testing, PRTG’s packet sniffing tool allowed us to capture and analyze network traffic, revealing that a cloud-based backup application was running continuous, high-volume backups. With this insight, we could reconfigure the backup settings and implement bandwidth control policies, effectively reducing data usage and cutting down on costs.
By using both of these tools in conjunction with one another you will learn far more about your current network setup than you thought possible. As with most monitoring solutions, PRTG looks to help you to fix issues before they become widespread and operationally detrimental to your business.
It works by ensuring that you are notified before an issue causes an outage while increasing network traffic efficiency and data flow. With this application you can also monitor data usage to help shape your view of the current state of your networks. PRTG implements various types of sensors throughout your network on key network components.
IT reports back to you if any irregularities are detected and alerts you of what the issue could be. All of these sensors gather data continuously. There is a specific sensor for packet sniffing which helps you to isolate specific data packet types and then action them accordingly.
With the packet sniffer you can easily identify data traffic types such as web traffic, internet relay chat, Citrix, P2P, and file copies such as FTP as well as email.
PRTG only grabs data from the header of data packets, leaving the packet payload alone. This makes it far more efficient for the packet sniffer to do its work as there is less data that it needs to process in order to alert you to any issues. PRTG also has NetFlow and JFlow sensors that give you more details about the Cisco or Juniper network equipment that you have installed at your site.
This makes troubleshooting a while lot easier too. The packet sniffer sensor has a graphical interface which makes it easy to use and simple to see what is happening within the application.
Who is it recommended for?
SMBs can leverage PRTG’s affordability and scalability to maintain and optimize their network infrastructure efficiently, ensuring smooth operations without the need for extensive IT resources.
IT leaders can benefit from PRTG’s comprehensive network visibility, which helps in making informed decisions about resource allocation, capacity planning, and network investments.
Experience with network monitoring tools or practices is beneficial, as users who are accustomed to monitoring network performance and understanding network metrics will find PRTG easier to navigate. Familiarity with managing network devices and understanding how different network components work together is beneficial for configuring PRTG effectively.
If you would like to download a free version. You will receive an unlimited full version for 30 days after which it will revert to a limited functionality version which is free to run but consists of only 100 sensors. Start with a 30-day free trial. After that, pricing for PRTG starts at $1,750 for 500 sensors and offers packages with customized pricing for sensor counts starting at 20,000.
5. SolarWinds Network Performance Monitor
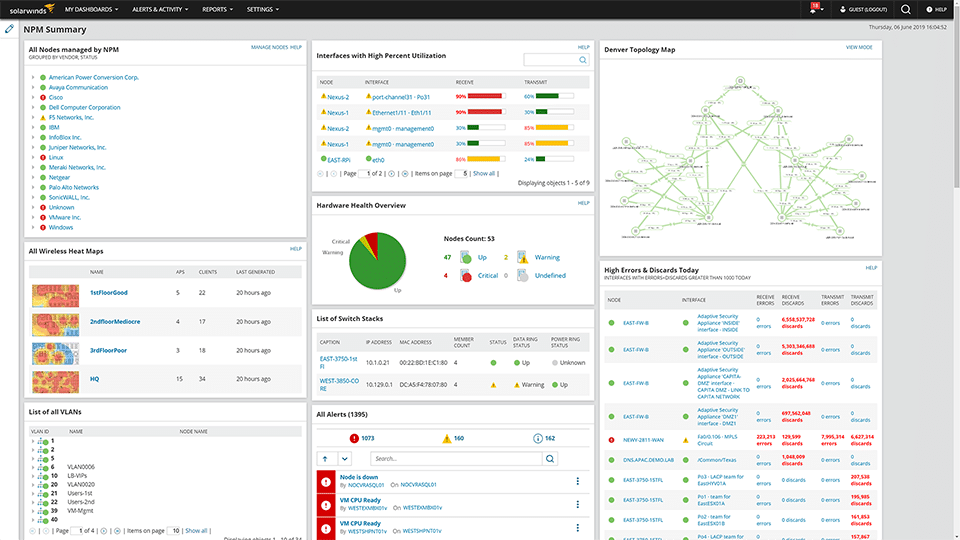
SolarWinds Network Performance Monitor is a tool that needs little introduction. As well as being a monitoring and alerting solution it also offers a wide variety of troubleshooting and analysis tools. This includes a packet sniffing implementation that is called Network Packet Sniffer. If you work in IT and you are responsible for looking after your network then you need a network sniffing tool.
Why do we recommend it?
We were experiencing intermittent latency and packet loss in our network, which was impacting our users’ experience. We decided to test out SolarWinds NPM, and it allowed us to capture and analyze network traffic in real-time, helping us identify the specific devices and applications causing the congestion. With this information, we successfully reconfigured our network to prioritize essential traffic and mitigate the issue.
SolarWinds has a solid packet sniffing capability build into all of their software probes. Simply deploy a probe to a device that you would like to investigate, and it will start probing the device and pulling meta data.
Once you have collected enough of a sample then you can start to apply different levels of investigation against the capture file. Where this application really excels is in the reporting department. The application is accessible over the internet so you can monitor multiple sites from a single location.
Because of the nature of the network scan, you can identify performance issues such as a quality of experience (QoE) and that it helps you to visualize the data on your network. SolarWinds NPM also gives you the ability your plug in your NetFlow data as well as configuration and server details, giving you a rich source of packet capture data. This will help especially when there is a complicated network issue for you to troubleshoot.
The packet analyzer tool also helps you to identify issues such as performance impedance and slow performance. It has a built-in packet metric analyzer with over 1200 predefined templates and also allows you to categorize data in different segments.All of this comes together to give you a comprehensive performance monitoring solution that is easy to setup and use.
Who is it recommended for?
The packet sniffing capability of SolarWinds NPM makes it a valuable asset for security experts. It aids in identifying security threats and vulnerabilities by analyzing network traffic patterns. Companies offering network services can use SolarWinds NPM to monitor and ensure the quality of service for their clients. It helps in identifying and addressing network issues promptly.
Despite its extensive capabilities, SolarWinds NPM offers a user-friendly interface and is well-documented, making it accessible to a broad range of users, from novice IT professionals to seasoned network experts.
Pricing: Pricing options start at $2,995 for a perpetual license, while a subscription model starts at $1,583 for monitoring for full pricing check out the quotation page here for a customized quote on NPM. You can access a 30-day free trial.
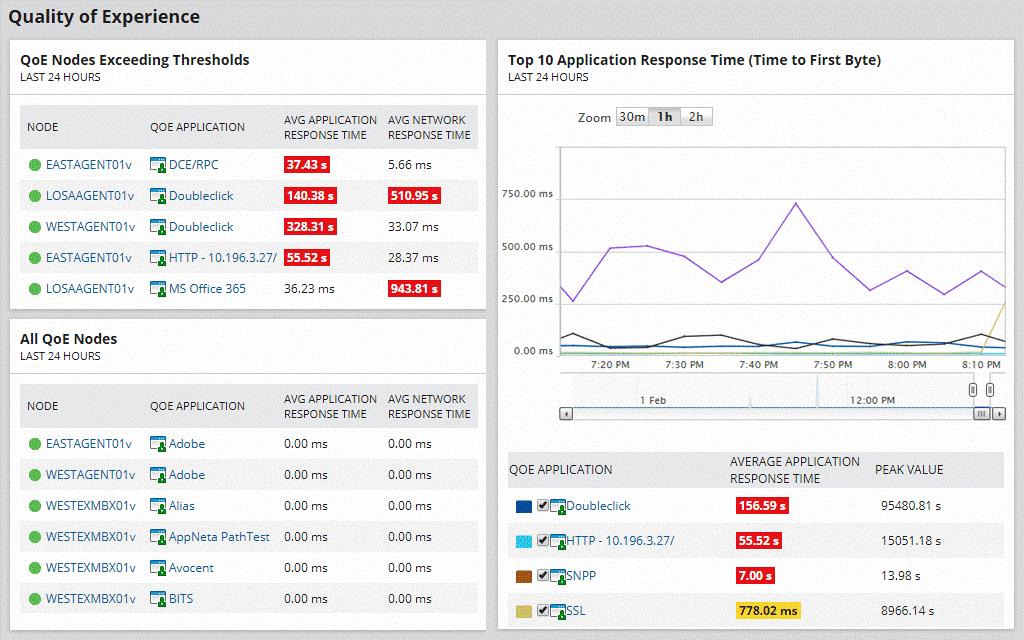
6. Savvius LiveAction Omnipeek Network Protocol Analyzer
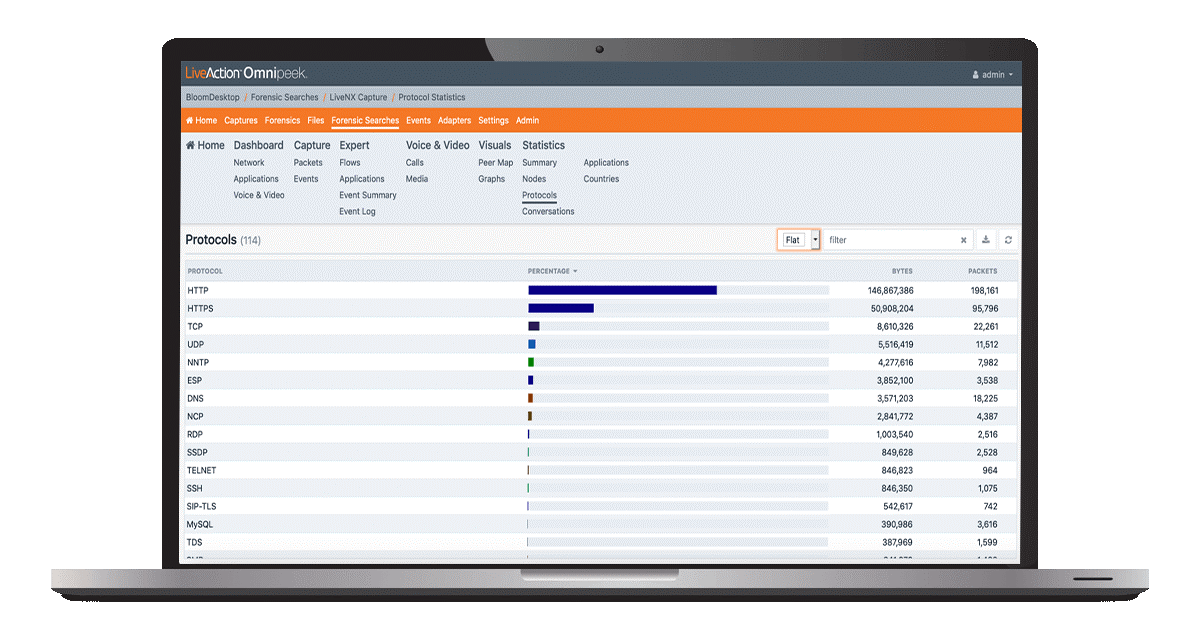
Savvius LiveAction Omnipeek Network Protocol Analyzer offers a product that gives you enhanced visibility on your network. It helps you to quickly and easily identify and resolve network issues such as bottlenecks and outages as they occur.
Why do we recommend it?
We used Savvius LiveAction Omnipeek Network Protocol Analyzer to resolve a critical network performance issue caused by intermittent network outages. We were struggling to identify the root causes of these outages, which were impacting our business operations. Omnipeek’s real-time analysis and deep packet inspection capabilities allowed us to pinpoint the issues, including excessive broadcast traffic and some misconfigured devices, enabling us to take immediate corrective actions.
It can identify and decode over 1000 different protocols, making it much easier for you to understand what is happening on your network. No matter what your network monitoring needs are in the real time analysis arena, you can count on LiveAction. It has real-time support for all network segment types, 1/10/40/100 Gigabit, 802.11 (wireless), Voice over IP and Video over IP, as well as any other protocol that you can think of monitoring in your enterprise network environment. LiveAction also offers integrated Flow and packet-level analysis. This gives you the ability to view details about Flow enabled devices. This helps you to forensically and methodically troubleshoot your network when issues occur.
To help defend against issues before they occur you can use LiveAction to generate automated alerts based on criteria that you configure yourself. You can align the alerts with network policies, and you can create your own views to show you the most important network information. This gives you the best of both worlds between packet analysis, packet sniffing and real time alerts.
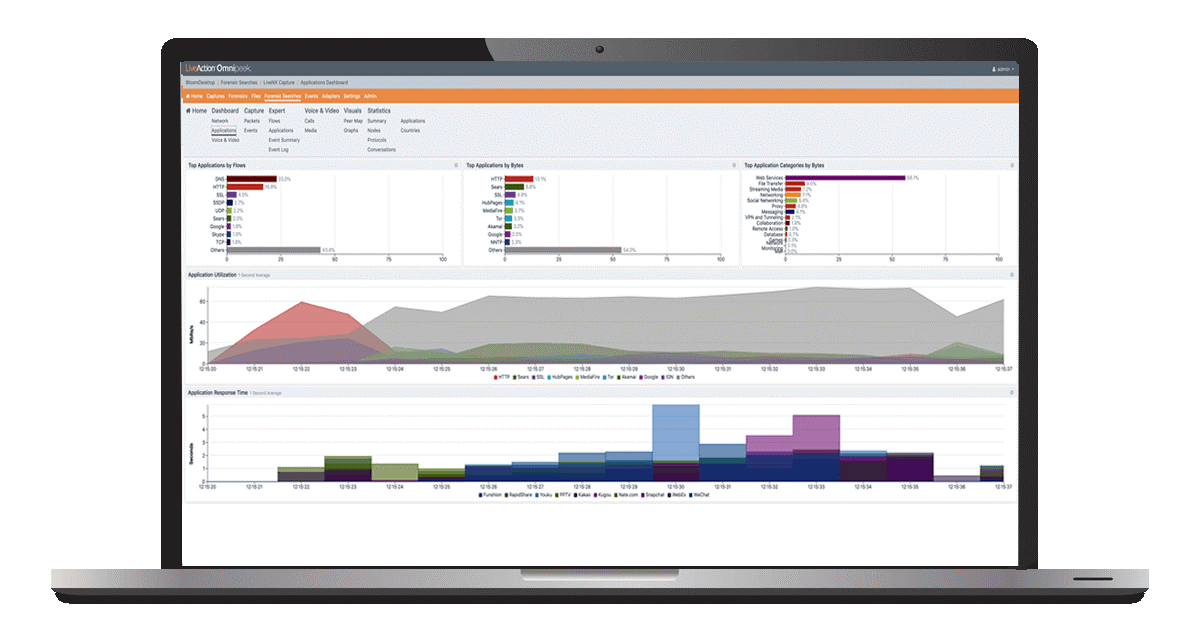
Like many of the other products that we have looked at today, there is a large graphical component to LiveAction that makes it especially useful for looking at network activity without an incomprehensible mountain of logs and lines of network traffic details. Instead, all of the data is transformed into intuitive and easy to understand graphical representations of network activity. This takes a forensic approach to network and application performance monitoring. It makes it convenient to get to the core details of each issue as they become available.
One of the best features is that LiveAction offers monitoring and visibility across multiple network nodes both local and remote. This increases your capabilities when it comes to troubleshooting and diagnosing application level errors and issues at remote locations like national branches, WAN connections and even connectivity between data centers.
The company also offers a hardware device called the Omnipeek WiFi adapter. It is a USB adapter that captures WiFi packet data, which makes it a very useful capture device for on site visits where WiFi analysis is necessary.
Who is it recommended for?
Large organizations with complex network infrastructures can use Omnipeek to maintain and enhance network performance, address outages, and ensure smooth operations.
Managed Service Providers (MSPs) can use Omnipeek to monitor and manage multiple client networks, providing quality network services and resolving issues efficiently.
To operate Savvius LiveAction Omnipeek effectively, users should have intermediate to advanced networking knowledge. A solid understanding of networking concepts, protocols, and device management is crucial for interpreting Omnipeek’s data effectively.
While Omnipeek offers advanced capabilities, beginners can start by using it for basic network monitoring and simple troubleshooting. As they gain experience and confidence, they can explore more advanced features to harness the tool’s full potential.
If you would like to try it out for yourself then you can create an account and add a 30 day trial to your cart here.
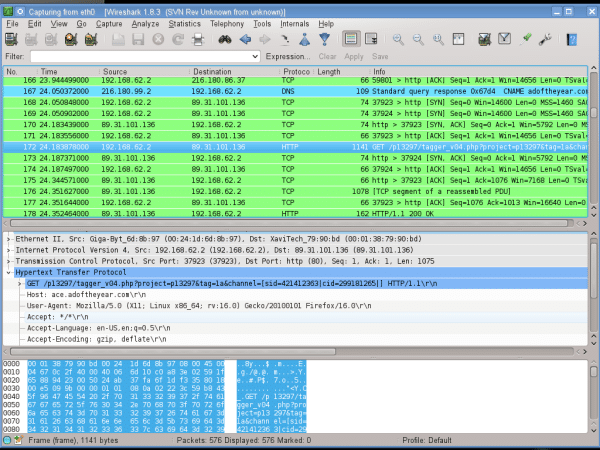
7. Wireshark
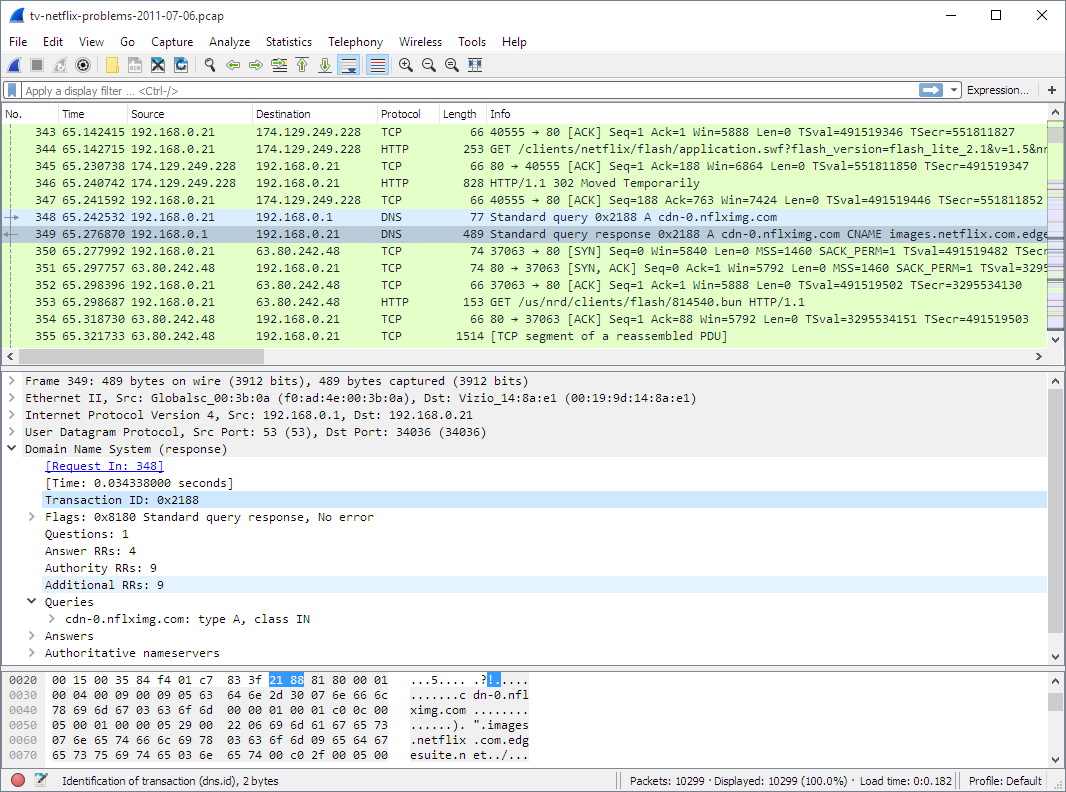
For many IT professionals Wireshark is the first stop when looking to capture network packets. The first reason is that the application is free and open source. The second reason is that it is very powerful, and when used correctly it is a powerful tool that can give you details about the packet flow on your network.
Why do we recommend it?
Wireshark proved invaluable in resolving a recent security breach within our network. We detected unusual traffic patterns and suspected a data breach. We used Wireshark’s deep packet inspection and analysis capabilities, which enabled us to identify the source of the breach and pinpoint the compromised device, ensuring our security protocols held strong against the attack attempt.
IT is able to create PCAP files from live data flows which are analyzed after the capture has been completed. The application itself is easy to use in the sense that starting a capture is very straightforward, however, the difficulty comes in analyzing the data.
To the untrained eye, there is a lot of data that doesn’t make much sense. In order to understand what the difference between TCP and UDP packets, you need to have a basic understanding of how network protocols communicate. This is no problem for network specialists that work with various layers of the OSI model, but for a casual network user there is a lot of information to cover.
The functionality of Wireshark is enhanced when you apply plugins to your capture files. Wireshark’s default mode captures everything that passes through the Network Interface Card, which means that the plugins limit the scope of that default behavior. You can specify the parameters of your search so that you filter out the packets that you don’t want to investigate.
The great thing about this tool is that it can be used by network engineers to troubleshoot issues and by security engineers to investigate potential security issues. You can drill down into the details of each packet and see what data is being transmitted within the packet itself.
Who is it recommended for?
We recommend Wireshark for its unmatched capability in forensic network analysis, making it an essential tool for security professionals and network administrators.
It’s a versatile tool suitable for users with varying levels of expertise, from beginners looking to understand network traffic to experienced professionals in the fields of networking, security, and forensics. Its open-source nature and extensive community support make it an accessible choice for a wide range of users.
Security professionals conducting penetration testing or ethical hacking can use Wireshark to analyze network vulnerabilities and assess security measures.
Large organizations like healthcare providers can leverage Wireshark for monitoring and securing network traffic, essential for patient data protection and compliance.
If you would like to try it out for yourself then you can download it for free from here. It is available on Windows, Mac and Linux, as well as a few other operating systems.
You can also take on some Wireshark training from here if you would like to learn how to use this powerful opensource tool. This application is free and opensource and is under active development.
8. Telerik Fiddler
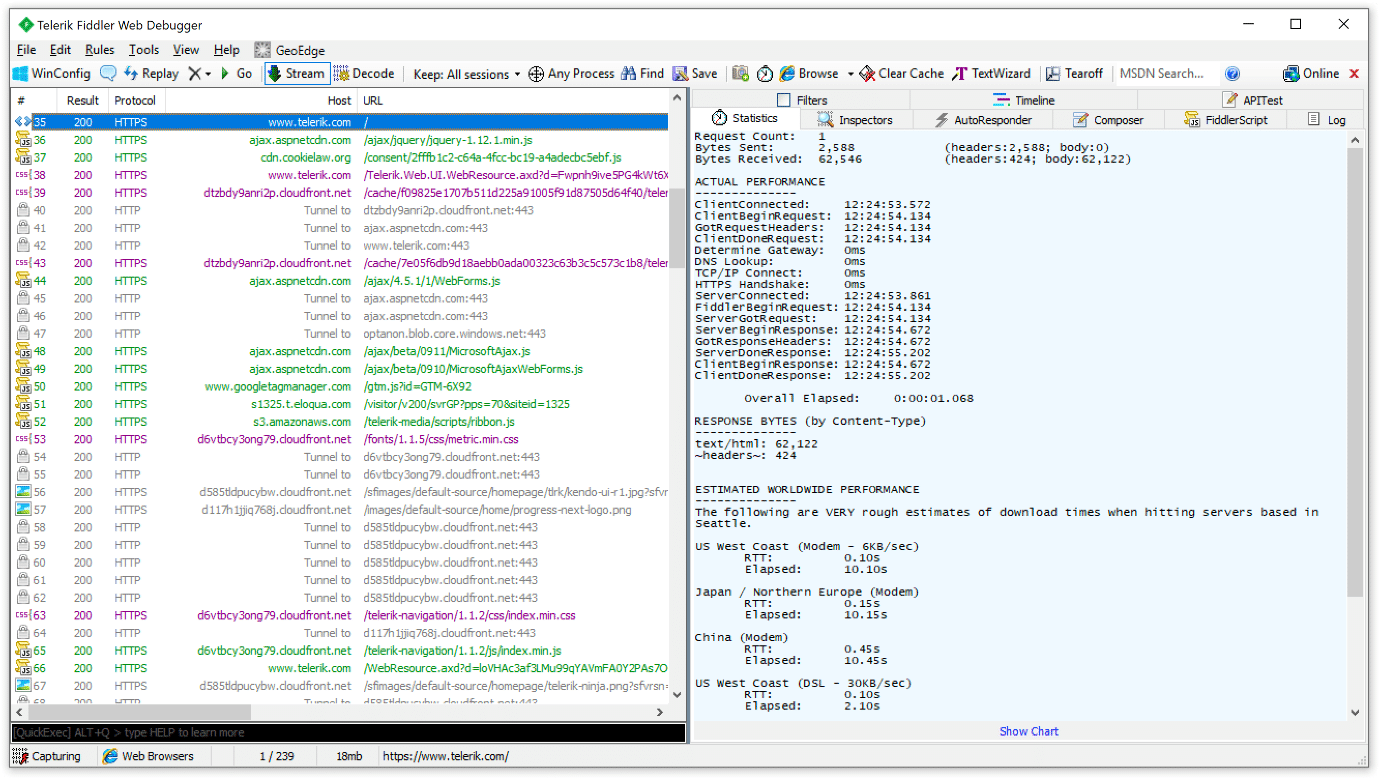
Telerik Fiddler is a niche tool that is useful for sniffing HTTP packets. It allows you to grab data from a browser or any other application that processes HHP packets. If you are a developer trying to troubleshoot some code, then this is a very useful tool. While it may be a little esoteric for most people looking to capture network data, it definitely has its use cases. The application has undergone a recent user interface refresh, which has made it easier to use and much more intuitive for developers to analyze the output of their applications.
Why do we recommend it?
During a time when we were experiencing sporadic performance degradation and inconsistent data retrieval, we turned to Fiddler. Fiddler allowed us to capture and analyze HTTP traffic, revealing that certain API requests were causing the problem due to excessive latency. This insight enabled us to optimize our website.
For software developers this is a very useful tool that will give you the run down on your web application’s behavior. It can offer you an alternative troubleshooting platform to use as opposed to using the web browser’s built in error console. Debugging is important when developing software applications and debugging traffic from multiple operating systems is not easy. You can analyze the state of cookies, headers as well as caching. The great thing is that it supports multiple frameworks such as .Net, Java and Ruby.
It is also a great way to send modify requests as well as responses on websites. This allows developers to test out web applications when they receive requests, and what data they send out. For prolonged and automated testing, Fiddler is able to utilize Fiddler Everywhere to record and log all HTTP and HTTPS protocols.
If you are using an application that supports a proxy then you can debug applications from Chrome, Safari, Firefox, Opera and Edge.

Once you have captured your traffic, you can share it with the res of your team and collaborate to improve your code. The process is simple and is done through the Fiddler application itself. To help with the collaborative features you can highlight and mark details within the sessions, add comments and even share captured sessions over a cloud-based service with the rest of your team. Fiddler is available in 3 different flavors.
Who is it recommended for?
Fiddler is an essential tool for web developers, providing insights into HTTP traffic, request and response details, and performance bottlenecks. It aids in debugging, optimizing web applications, and ensuring a smooth user experience.
QA professionals can use Fiddler to monitor and analyze web application behavior during testing. It helps identify issues, such as incorrect API responses, performance problems, and security vulnerabilities.
Telerik Fiddler is recommended for anyone involved in web development, testing, security assessment, or network administration. Its versatility and user-friendly interface make it a valuable tool for both beginners and experienced professionals in various domains.
Fiddler Classic is a debugging tool that runs on Microsoft Windows. FiddlerCore is a .Net library that lets you capture HTTP and HTTPS traffic as well as modify it. Fiddler Cap is a companion tool that also captures web-based traffic. If you would like to try it out for yourself then you can download the free version from here. Pricing starts at $12 a month per user. Full details for pricing can be found here
9. NETRESEC NetworkMiner
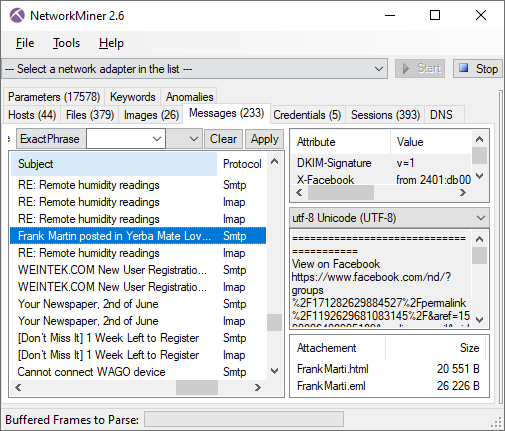
This is a forensic network tool that is able to intercept data from protocols such as SMTP and IMAP, which are 2 of the protocols that are used when sending emails. It is able to intercept password hashes, FTP file transfer data and HTTP objects that are transmitted. This tool can be used to help and secure your network, especially if you are trying to ensure that your users are not exposing company information accidentally.
Why do we recommend it?
NETRESEC NetworkMiner played a crucial role in helping us uncover unauthorized data exfiltration within our network. We suspected that sensitive data was being transferred without authorization, but we couldn’t pinpoint the source. We used NetworkMiner’s deep packet inspection capabilities to reconstruct file transfers, identifying the source of the potential breach. We promptly halted the intrusion before any harm could be done.
The NetworkMiner tool is under active development and is being improved on still to this day. The website still features an active blog as well, which is always good to see with a project such as this. In addition to all of these features, NetworkMiner can also parse PCAP and PcapNG files and it also has IPv6 support.
If you are trying to get information about the security certificates in use on your network then you can also use this tool to extract X.509 certificates from encrypted connections that are using SSL. The tool is very useful for in depth testing on a network and it is housed within a very basic GUI. This is not a bad thing, as simple is normally better with applications like this.
There is not much in the way of graphical representations of data in graphs or charts, so if you are hoping to use this tool for generating reports then you will have to combine the detailed output from your captures in this application with another graphing tool like Microsoft Excel.
NetworkMiner is capable of exporting to CSV, Excel formats, XML, CASE and JSON-LD. NetworkMiner Professional offers advanced features like extracting audio data from VoIP calls, as well as OSINT lookups of file hashes, IP addresses, domain names and website URLs. All of these features are aimed at network and security professionals, so using them requires a fair amount of technical knowledge as well as organizational knowledge and understanding of the systems that you are running these tools against.
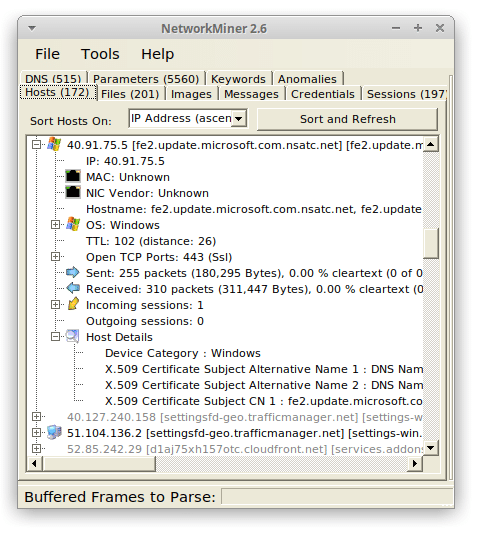
NetworkMiner runs on Windows and Linux and is a capable and very handy network sniffer. It gives you simple data such as banner information, software version numbers, sessions, host-names, open ports on a host, and much more without putting traffic onto the network that it is monitoring. This is good for masking the activity of these tests as you often do not want your test machine putting data onto the network if you are running monitoring and alerting on the system.
Who is it recommended for?
We recommend NetworkMiner for its exceptional forensics capabilities, making it an essential tool for security professionals and incident responders. Law enforcement agencies can benefit from NetworkMiner’s forensic network analysis capabilities during cybercrime investigations.
While the tool offers user-friendly features, a solid understanding of network protocols, packet analysis, and forensics concepts is essential to effectively interpret the captured network traffic and maximize its potential for security and forensic investigations.
If you would like to try out NetworkMiner then you can download the free version from here. NetworkMiner starts at $900 for the professional version, while the free version can be downloaded directly from the NetworkMiner website.
Conclusion
There are plenty of capturing tools available for you to try out, whether you are a security professional, network engineer or developer, there is an option out there for you.
PRTG and ManageEngine have well rounded applications that do more than you would expect from a sniffing tool. SolarWinds also offers a comprehensive solution with Network Performance monitor. It allows you to capture packets and analyze network traffic at the same time. It offers alerting, monitoring and logging in an easy to use interface that is quick to setup and start using. The other tools that we have looked at all perform well as sniffing tools but if you are looking for advanced alerting and monitoring features then you would be better served looking at the first two apps that we looked at today.