
For those who wish to acquire a monitoring tool for their system, that can facilitate interaction among many data sources while delivering top results, then Grafana is a good product to consider. After all, getting the best results from digital infrastructures requires constant monitoring.
With this in mind, it should be stressed that Grafana has gained global popularity as a leading monitoring tool that can ensure that web app logs are properly stored and managed while enabling admins to track their performance. As a result, its services are not restricted to visualizing data only.
With Grafana, users can develop complex monitoring dashboards while sharing them with others. This comprehensive guide will provide deep insight into how Grafana works and other alternatives that users can consider. Let’s dive in!
What is Grafana?

Grafana is an open-source web metrics and IT systems monitoring tool. With Grafana, users can visualize the performance of their digital resources in a single dashboard. This can gather the metrics from different sources while displaying the data in a detailed format.
Grafana is an open-source Graphite dashboard composer, which makes it possible to develop innovative techniques for imaging time-series metrics. Simply put, Grafana can transform metrics into graphs and this can be done in real-time. However, this is done well and the results obtained are informational and desirable.
Through the dashboard, users can directly understand and interpret data. Besides this, data is presented in formats that ensure that it can be easily understood through tables, charts, and heat maps, among others.
Grafana is a flexible tool that ensures that users can access graphs and charts, which can help with better understanding and interpretation.
Three editions of Grafana are available to users. These include Grafana Enterprise Stack, Community Edition, and Grafana Cloud. Grafana can also be used alongside many databases, including Influx DB, ElasticSearch, and MySQL.
Grafana is used by many big organizations, including PayPal and JP Morgan, thanks to its scaling capabilities. Grafana also enables users to develop custom plugins since it is open-source. Team members can also monitor events with the use of Grafana dashboards.
Besides this, the product is designed with various toolsets, including load testing, visualization, paging, and many more. These make it much easier for developers to track, analyze, and display different scenarios.
Key Features of Grafana
Multiple panels can be arranged in a single grid by the Grafana dashboard. This makes it easier for developers to see and understand results from multiple sources simultaneously. Some of the essential features of the Grafana monitoring tool are presented as follows:
- Dashboard Templating Grafana makes it possible for users to customize and develop a dashboard that can be reused for various purposes, thanks to its open-source tool.
- Automatic Setup Grafana comes with an option that allows the automation of the whole setup process through scripts. This is a major advantage for administrators, especially when setup should be done quickly. I ran provisioning features also ensure that scaling can be hassle-free without the need to repeat the creation of dashboards during the process.
- Data Correlations This is one of the top features that Grafana possesses. It ensures that data can be correlated whenever an issue arises. This also makes it possible for users to manually gather data from external sources. This ensures that anomalies can be easily spotted and observed through more than a single metric. This also makes it possible for users to manually gather data from external sources.
- Custom Plugins Grafana supports the use of multiple plugins, which may contribute to extending Grafana while facilitating the integration with software visualization. Plugins are needed in the creation of timestamps.
- Kiosk Mode and Playlists This feature ensures that users can display Grafana dashboards on their TV and select anyone from the list as required. The view-only kiosk mode cloaks all the elements of the UI.
- Notifications Grafana comes with a feature that quickly alerts users whenever there is a threat or an unexpected situation. Then, the monitoring team members can be notified with the use of communication channels, including Slack.
- Authentication This is another essential tool that is associated with the Grafana monitoring tool. It can allow OAuth and LDAP authentications. These features allow admins to quickly map users to organizations while giving teams in the internal systems dashboard access.
- SQL Data Sources Users can make use of this feature to convert all SQL databases into metric data.
- Permissions This feature allows organizations to hide certain information from team members even though they share dashboards. Users can build teams while setting permissions based on different areas.
The Grafana dashboard makes it possible to track, examine, and provide accurate insights very fast. Besides this, the Grafana dashboard can also allow multiple visualization functions, such as charts, geo maps, and graphs, among others. This makes it simple for users to acquaint themselves with their data metrics.
What Users Love About Grafana
Many advantages come with the use of Grafana. Some of these are introduced as follows:
- It comes with no stress and is easy to use.
- Scaling is possible with Hosted Grafana. As a result, the tool can be used in any infrastructure design or architecture.
- Users can develop, edit, save, and search dashboards. This provides complete details of the metrics that are sourced from a given part of an IT infrastructure.
- Changing column spans and row heights on Grafana is easy. Besides this, drag-and-drop panels can rearrange in any way. This makes it a flexible tool that any dashboard designer can be happy to work with.
What Can Be Improved on Grafana
Certain aspects of the monitoring tool can be enhanced. Some of these include:
- Certain limitations on the dashboard. Certain restrictions are facilitated by the dashboard design. Besides this, the panel organization and filtering may not offer enough flexibility.
- Grafana relies on some systems for data collection. In other words, Grafana cannot collect data independently. Rather, Grafana makes use of data from external systems.
- It does not allow certain data type visualizations since it only supports time-series data.
Grafana Price
Grafana has two versions: On-premises, Self-managed and Cloud-hosted. Here’s everything you need to know:
The free forever access version of Grafana is available for three active users: 50GB logs, 10k active metrics, and 50GB traces. This offer is associated with a 14-day trial Pro version that provides complete access.
The Advanced and Enterprise versions of Grafana are associated with various features and resources.
Furthermore, the Grafana cloud also allows full-stack monitoring while enabling admins to gather, visualize, store, and provide alerts on data. This SaaS plan is designed with distributed systems techniques where automatic upgrades are possible and constant support.
Alternatives to Grafana
Even though Grafana has proven to be an effective monitoring tool adopted by numerous large-scale industries, many users might feel compelled to seek alternatives to Grafana for various reasons. As a result, it is only right to introduce some of the other monitoring tools that can be considered.
1. Dynatrace
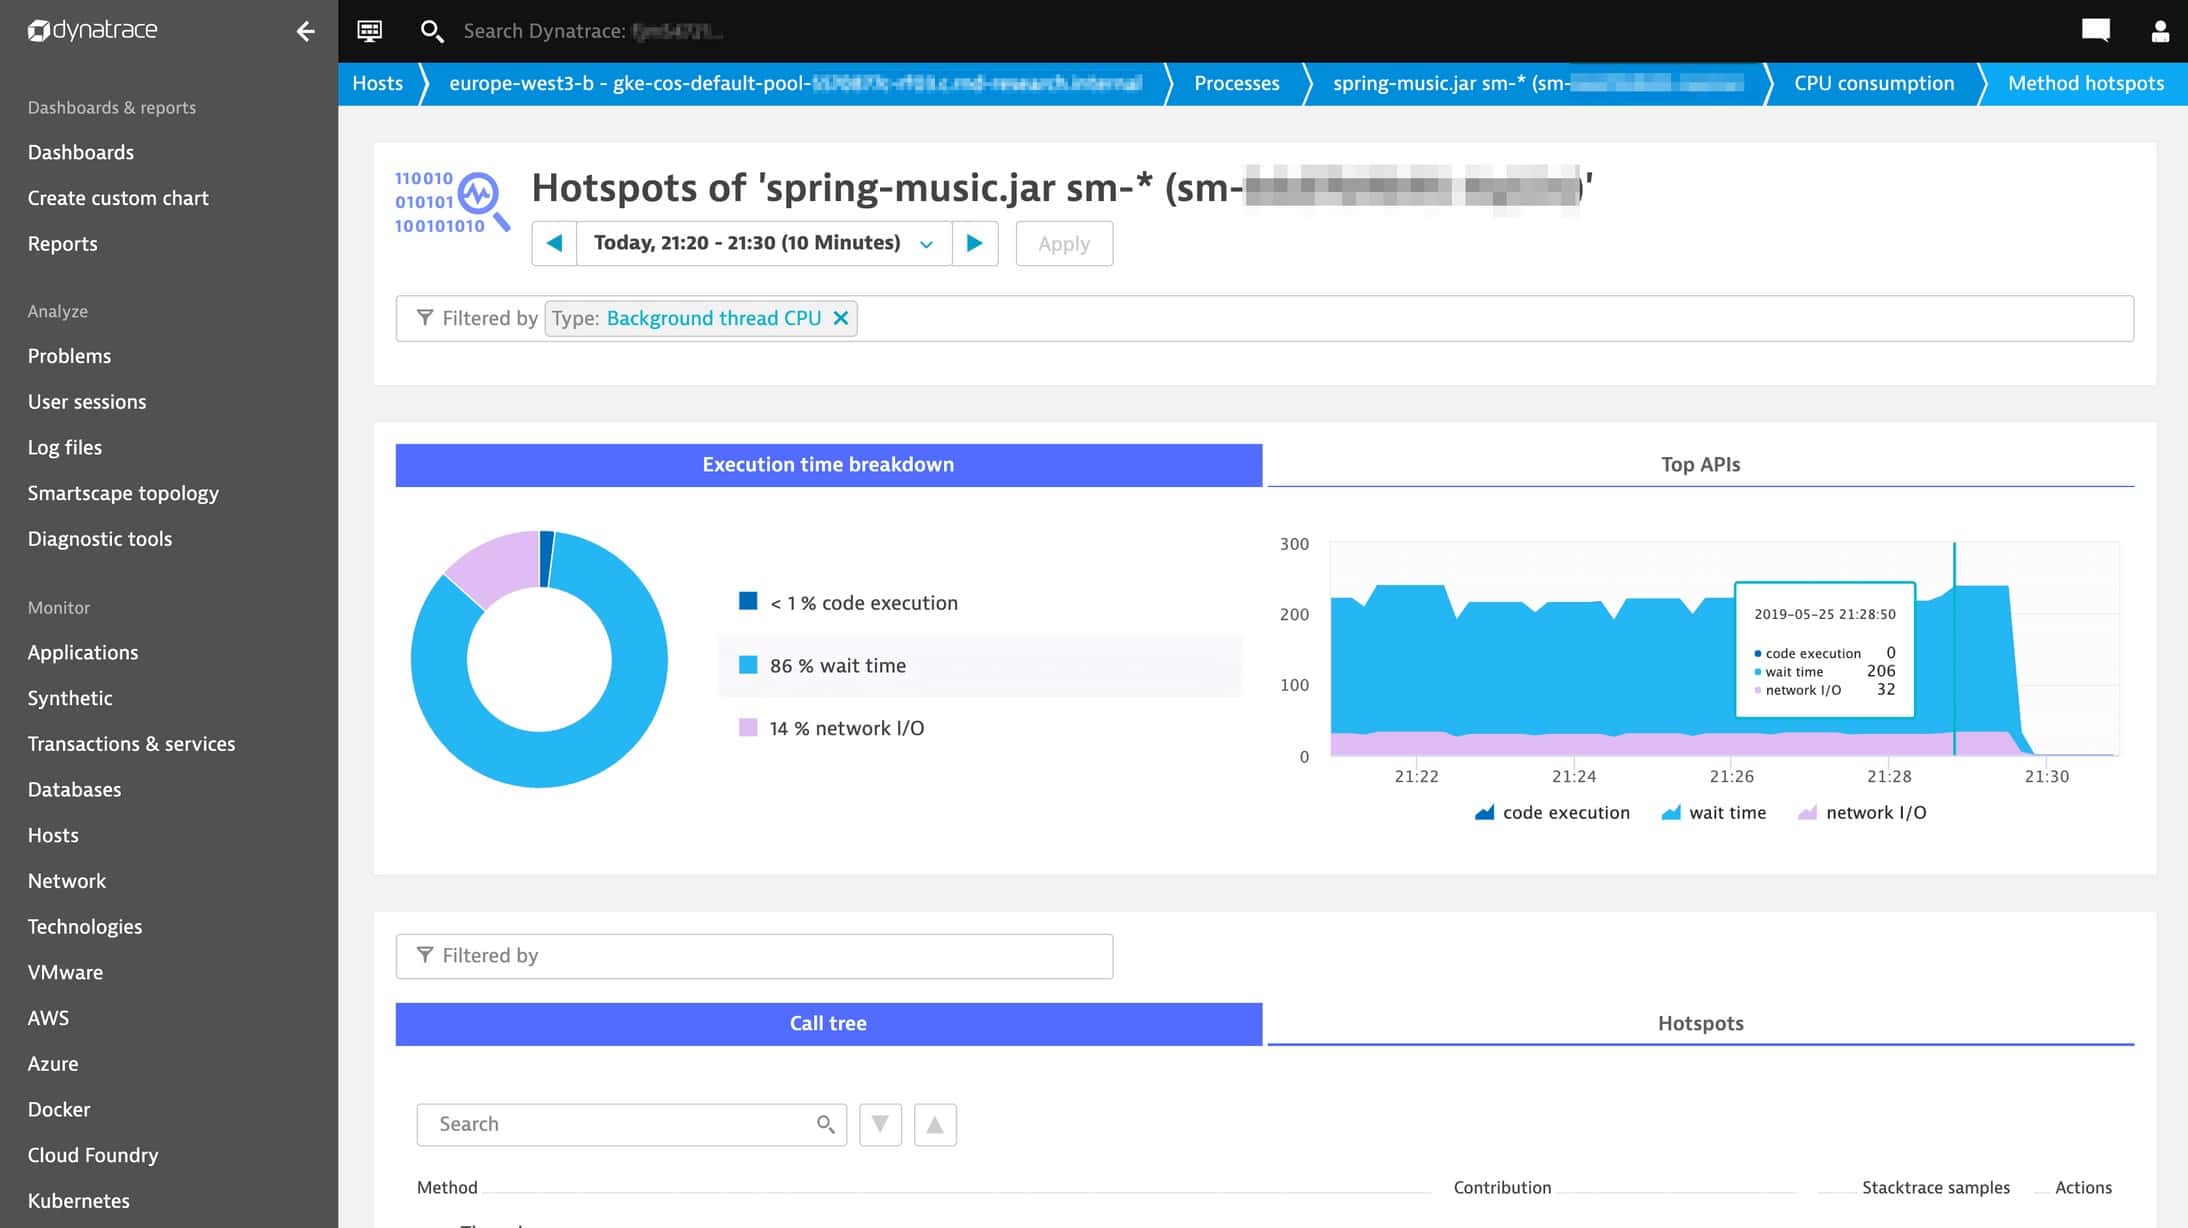
Dynatrace is a modern AI technology that helps companies keep track of thousands of servers using a simple interface. Dynatrace Ruxit includes monitoring tools, which have various functionalities that can cover an entire application stack.
Dynatrace Ruxit is an efficient tool that can provide effective monitoring tools and operations management for all users, including startups, mid-sized companies, and large organizations. Dynatrace can remove complexities and ensure easy analysis through:
- Application performance monitoring for Java, Node.js, and .NET
- Real user monitoring (browser-based performance monitoring)
- Server and process monitoring for Windows and Linux
Pros:
- Comes with Artificial Intelligence analysis and baselining
It is an all-in-one solution.
No need for data sampling
Cons:
- The pricing model can be an issue since the cost can be too high.
2. Tableau
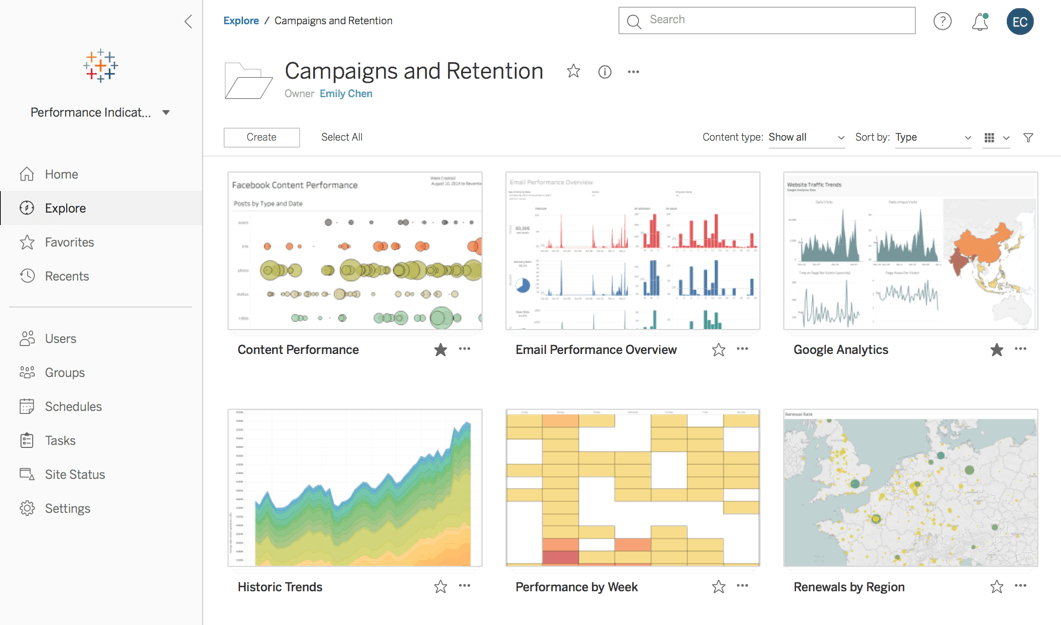
Tableau is an effective option for users looking for monitoring tools that provide an end-to-end experience. This product supports the use of AI-driven analytics that ensures its integration with other existing technologies. It allows users to add a session to the content management policy. This helps to store or delete content.
This tool is easy to understand and use. It also facilitates many types of visualization options. Furthermore, the monitoring tool comes with drag-and-drop features, which support the creation of interactive visuals. Apart from this, the tool also allows data blending, complex computations, and dashboard options. This helps in offering accurate details, which helps in making better decisions.
Pros:
- Tableau is a product that provides various ways of filtering data to detect high-impact areas. The server is also capable of supporting many panels.
- Tableau is a remarkable platform for achieving centralized data analysis and management.
Cons:
- Support service leaves much to be desired and can be improved significantly.