
Cacti is one of the most popular open-source network monitoring tools. Cacti allows you to monitor various metrics and look at them from its user-friendly, modern dashboard. Although it has a relatively steep learning curve, many businesses have chosen to make Cacti their network monitoring solution of choice.
Here is our list of the best Cacti alternatives:
- Site24x7 Network Monitoring – FREE TRIAL This cloud-based service includes a device discovery and mapping feature that forms the basis for ongoing device status monitoring and asset inventory management. Start a 30-day free trial.
- ManageEngine Netflow Analyzer – FREE TRIAL A dedicated bandwidth monitoring solution that is extremely simple to get up and running. Get a 30-day free trial.
- ManageEngine OpManager – FREE TRIAL A monitoring package for physical and virtual networks and servers. Available for installation on Windows Server or Linux or as a service AWS or Azure. Get a 30-day free trial.
- Paessler PRTG – FREE TRIAL An excellent solution that allows you to pick and choose what sensors you want to use. This gives it a very focused approach to monitoring. Get a 30-day free trial.
- SolarWinds Network Performance Monitor Another powerful network monitoring solutions on the market, if you have the funds for it.
- Nagios Potentially the most popular open-source monitoring tool on the market, and for a good reason. It features a variety of integrations you can commit to by simply getting one of its many user-created plugins. In addition, it comes with superb network monitoring capabilities and Netflow support.
- Zabbix An enterprise-level monitoring software used by tech giants like DELL that is provided entirely for free.
- LibreNMS An excellent monitoring solution exclusive to Linux with great horizontal scalability.
- M/Monit One of the simplest Cacti alternatives maintains a modern look.
- Netdata One of the most flexible monitoring solutions on the market run on VMs, containers, and IoT devices.
- MRTG A tool that will run on most OS and provides you with its entire Perl-based source code.
Today, we’ll be looking at some of the best alternatives to Cacti on the market. We’ll be focusing mainly on open-source or free solutions; however, we’ll include some of the best-paid options if you decide to take your monitoring to the next level.
The Best Cacti Alternatives
1. Site24x7 Network Monitoring – FREE TRIAL
Site24x7 Network Monitoring is offered by a cloud platform that provides SaaS plans with combinations of modules. The full plan is called Site24x7 Infrastructure and it includes server and service monitoring as well as network monitoring for wireless and wireless networks. This package also provides network traffic analysis. The whole system offers a cloud-based console, which can be accessed through any standard Web browser. The service reaches out to each protected network through an on-site agent.
The Network Monitoring service uses the Simple Network Management Protocol (SNMP), which provides a device discovery feature, and inventory creation service, and a Layer 2 topology mapping system. All of these system documentation services provide the basis for ongoing network device monitoring.
Main Features
- Network discovery and mapping
- Device monitoring with SNMP
- Traffic analysis with NetFlow, IPFIX, sFlow, J-Flow, CFlow, AppFlow, and NetStream
- Also provides server and middleware monitors
- Alerts for automated monitoring
- Root cause analysis
Why do we recommend it?
Site24x7 Network Monitoring played a crucial role in resolving our network performance issues by offering cloud-based device discovery and mapping. During an incident, the tool quickly helped us identify and address a core switch that was experiencing intermittent failures, causing network disruptions. Its real-time analysis and alerting saved us valuable time and resources in troubleshooting network disruptions.
All of the monitoring features in the Site24x7 Infrastructure package include performance thresholds, which trigger alerts if issues arise. The package also processes SNMP Trap messages into alerts. All alerts can be forwarded to key technicians via email or SMS.
The package also provides a Network Configuration Management module. This enables you to analyze device settings, which can include security features. You can then store the ideal configuration and let the system repeatedly check each device, comparing its configuration with the stored image. If the device has been changed unexpectedly, that could indicate a hacker attack and the Site24x7 system immediately restores the authorized settings.
While the Network Monitoring service keeps an eye on devices, the Network Traffic Monitoring unit identifies network devices that are under stress. This helps you implement traffic shaping measures to eradicate bottlenecks while getting the best value out of your equipment.
Who is it recommended for?
Site24x7 Network Monitoring is recommended for businesses of all sizes, particularly those seeking a cloud-based solution with a focus on efficient device discovery, comprehensive traffic analysis, and the flexibility to monitor their network assets from anywhere.
Small to large enterprises can benefit from its scalable and user-friendly approach to network monitoring. For example, it’s a great solution for hotels and resorts that rely on stable network connectivity for guest services and internal operations.
You can assess the Site24x7 Infrastructure system with its network monitoring unit with a 30-day free trial.
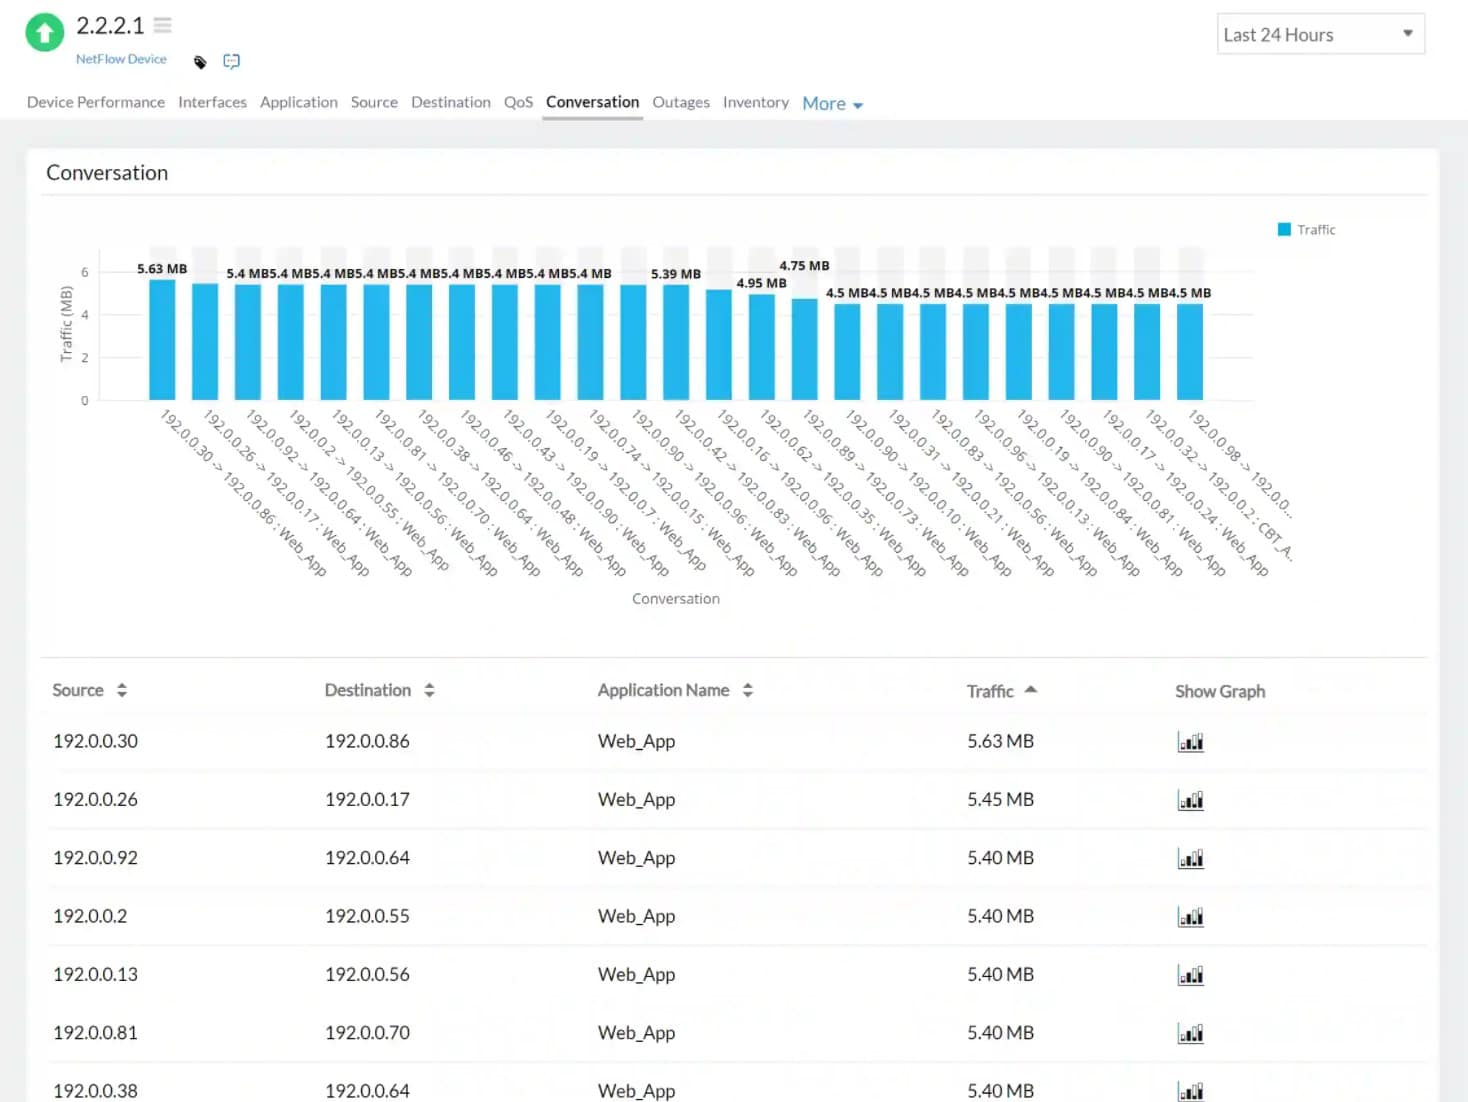
2. ManageEngine Netflow Analyzer – FREE TRIAL
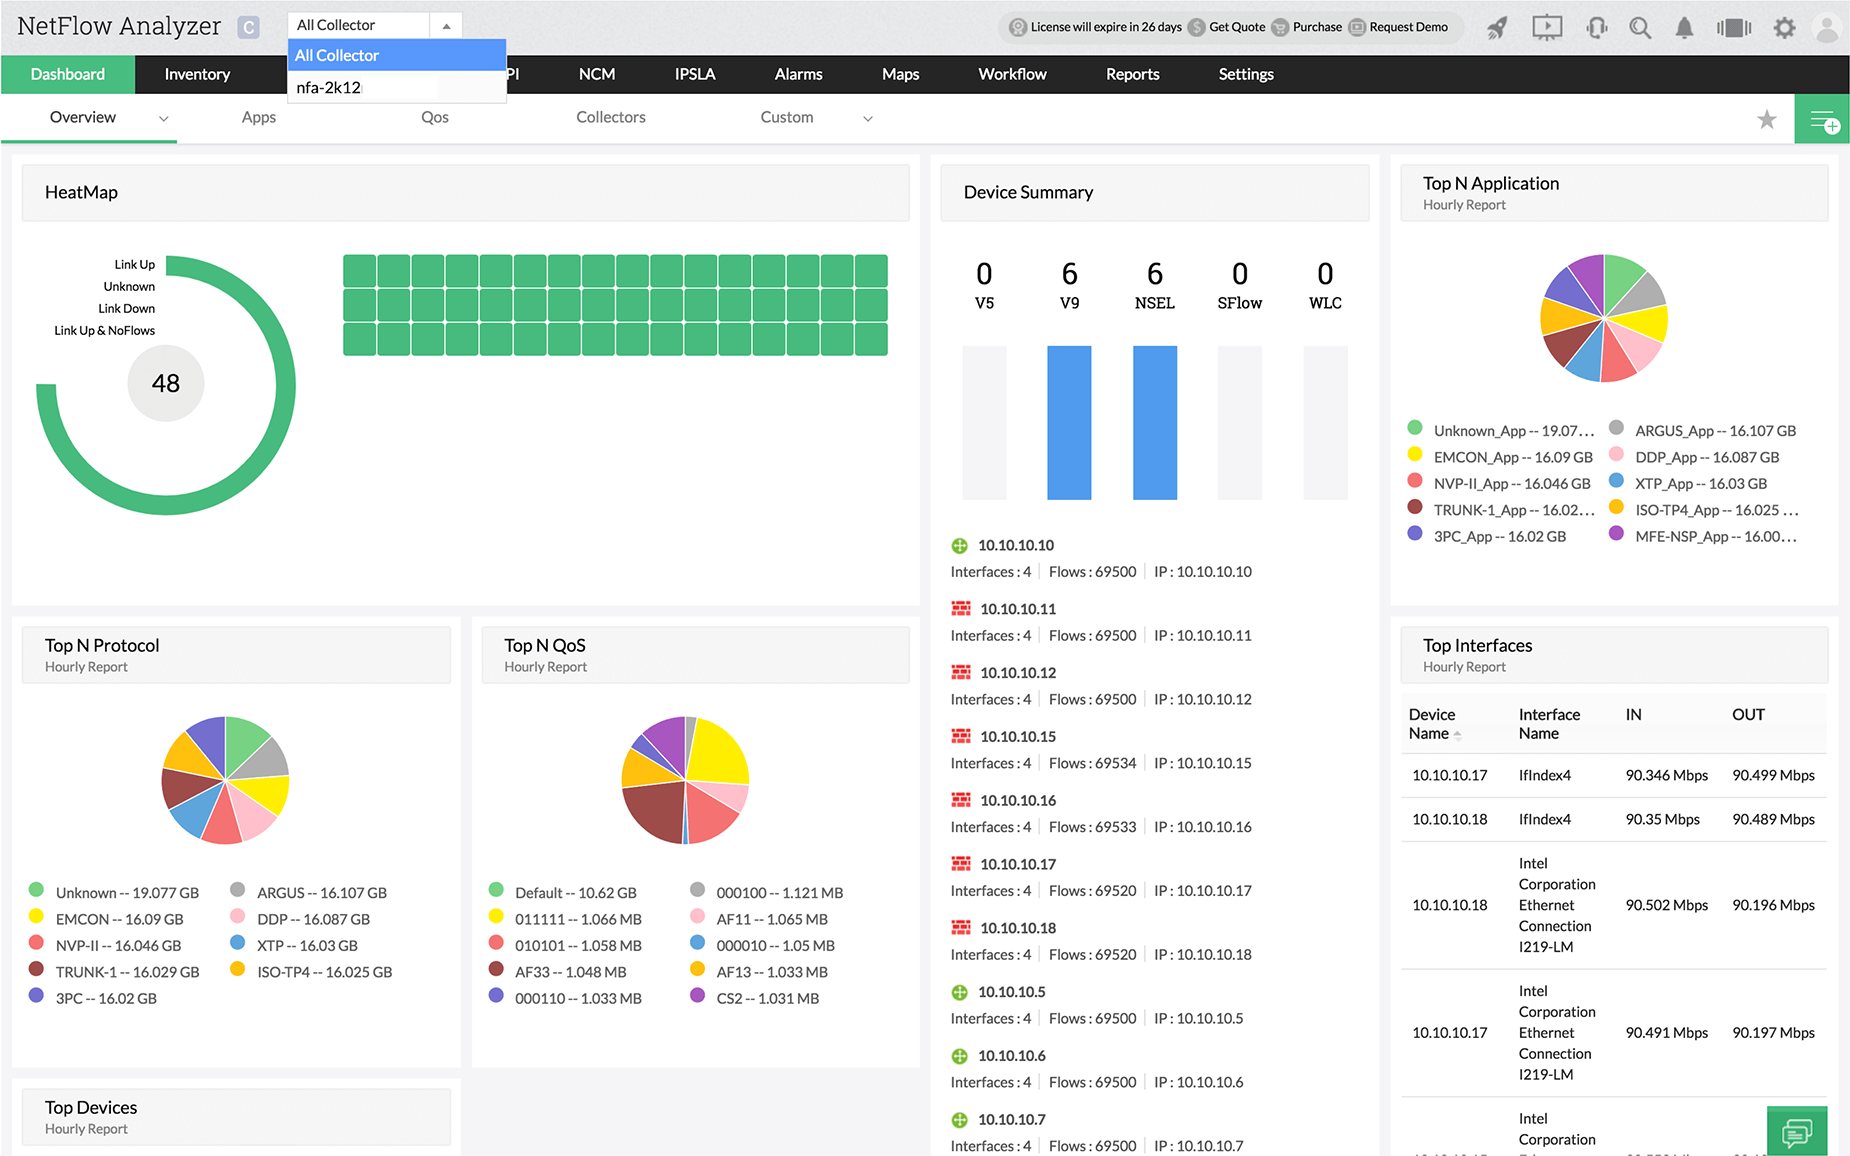
The ManageEngine Netflow Analyzer provides you with various analysis and control features to enhance your monitoring experience. You will be provided with flow-based traffic monitoring, as well as in-depth traffic analysis features.
The tool takes advantage of net-flow technologies to get a real-time look at your network’s bandwidth performance. As a dedicated bandwidth monitoring tool, it doesn’t have the plethora of features most of the other tools on this list have. Still, if you were using Cacti just for bandwidth monitoring, it’ll provide you with everything you need.
Main Features
- Simple to use and install
- Dedicated bandwidth monitoring solution
- Finds nonstandard applications that are taking too much of your bandwidth
- Provides detailed reports
- Excellent aid for network forensics
Why do we recommend it?
While we were testing it, the ManageEngine Netflow Analyzer played a critical role in addressing a persistent network congestion problem we had. By dissecting the flow data, it uncovered a recurring pattern of network traffic bottlenecks and its source. This insight enabled us to prioritize bandwidth allocation and implement traffic-shaping policies, effectively eliminating congestion issues.
The Netflow Analyzer will gather data, analyze it, and then provide you a report on who is using your bandwidth and for what. This can be a great help in optimizing network flow monitoring, traffic analysis, and network forensics.
Who is it recommended for?
It’s well-suited for those interested in network forensics to investigate and resolve network incidents efficiently.
For instance, companies can use it to detect when video conferencing applications are consuming excessive bandwidth, allowing them to allocate more resources for these services and optimize the overall network performance, ensuring a seamless remote work experience for employees.
Pricing: It has a paid version that costs $595 for a lifetime license and offers a 30-day free trial.
3. ManageEngine OpManager – FREE TRIAL
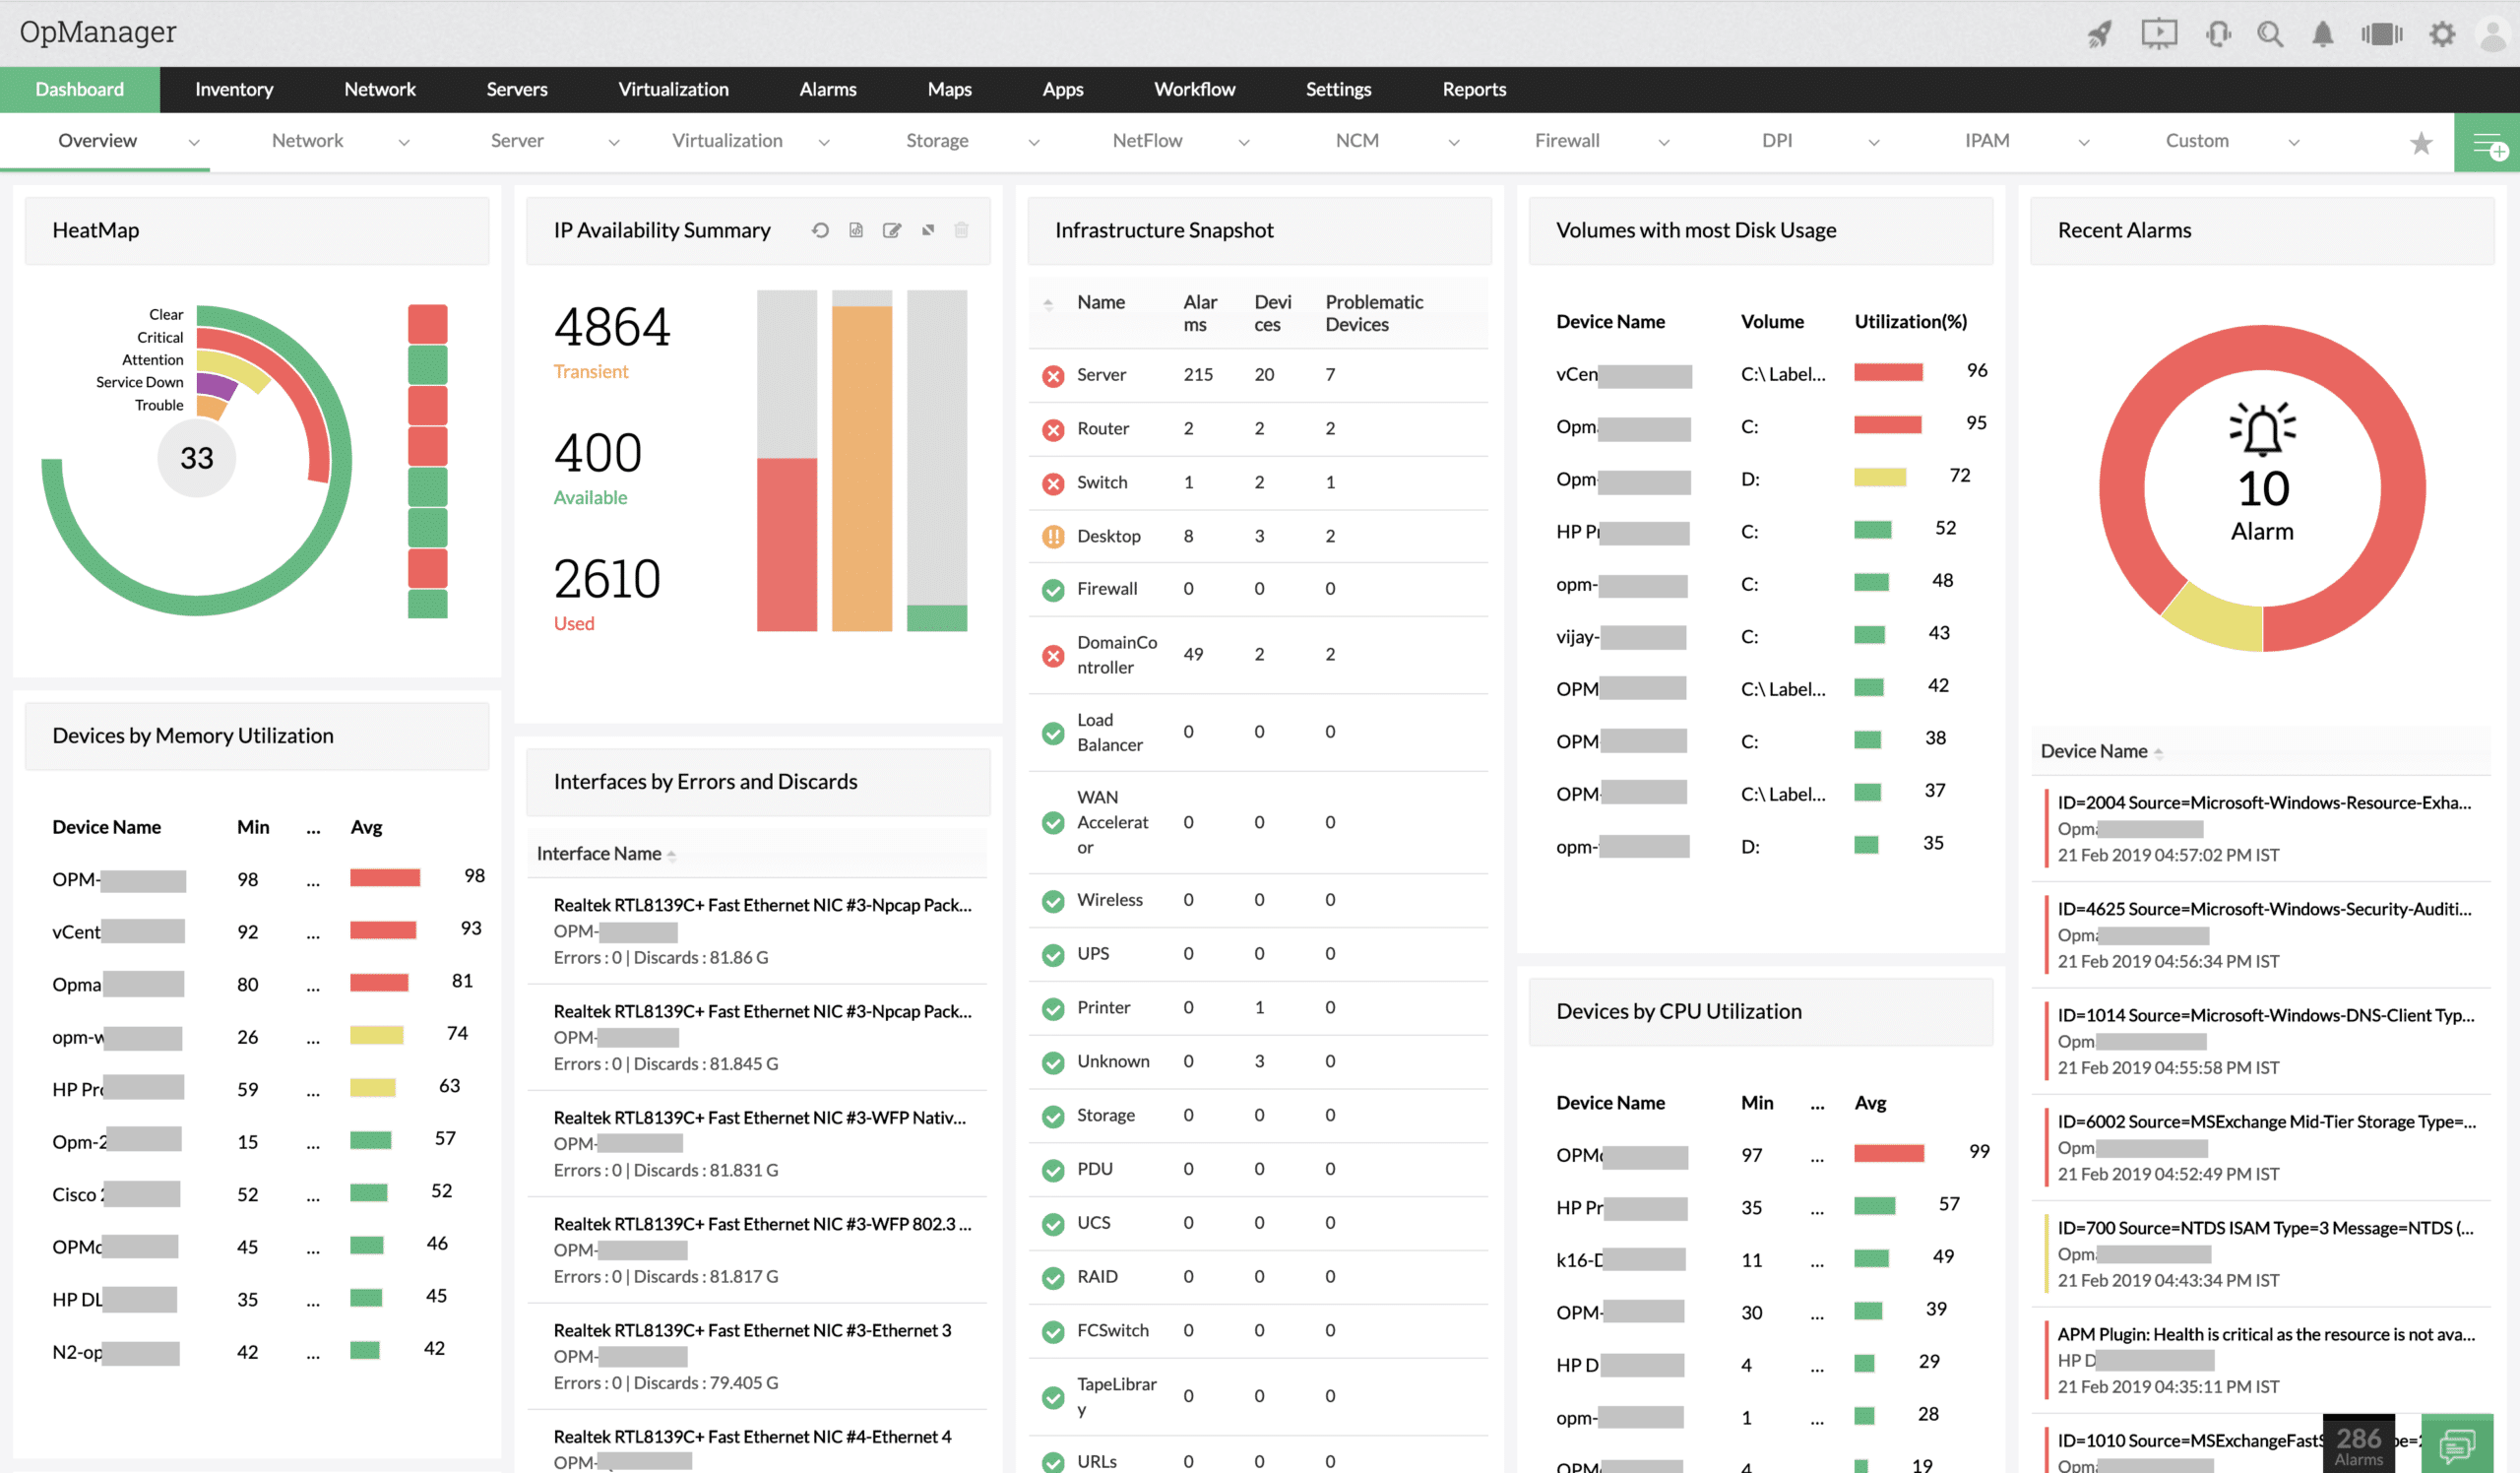
ManageEngine OpManager is a network monitoring system that extends its capabilities to monitoring physical and virtual servers. It can also monitor virtual networks and internet connections between sites and cloud services. This is an automated monitoring package that scans the network for connected devices and creates an inventory. The tool also provides a network topology map. Both the inventory and the map are kept up to date by rescanning.
This is a full package of network administration tools that includes utilities for manual troubleshooting as well as automated monitoring. These utilities include Ping and TraceRoute. Server support systems include process monitoring and storage server supervision.
Main Features:
- Automatic creation of a network inventory and topology map
- Constantly updated device details
- SNMP-based status polling
- Alerts for system or performance problems
- Troubleshooting tools
- VoIP quality of service measurements
Why do we recommend it?
ManageEngine OpManager proved invaluable in addressing a critical network downtime issue we encountered. The automated monitoring system swiftly detected a failing network device we weren’t aware of, initiated an automatic restart, and alerted our team, ensuring rapid recovery, and ultimately safeguarding our business continuity.
This package is able to monitor virtual systems as well as physical networks and servers. It can monitor Hyper-V, VMware, Citrix, and Nutanix virtualizations, VLANs, and SD-WANs. The package includes measurements for VoIP quality of service. The service can also gather and analyze Syslog messages.
Who is it recommended for?
ManageEngine OpManager is ideal for IT administrators and network managers responsible for overseeing and maintaining complex network infrastructures in medium to large enterprises.
Organizations seeking to manage diverse network infrastructure from different vendors can use this tool for SNMP-based status polling and real-time monitoring. It’s particularly valuable for businesses that rely on Voice over IP (VoIP) and need to measure and ensure the quality of their VoIP services.
Pricing: There is a free edition of OpManager but that will only monitor three devices. Three paid editions ensure that OpManager is suitable for all sizes of businesses from SMBs to multinationals. ManageEngine offers OpManager on a 30-day free trial.
4. Paessler PRTG – FREE TRIAL
The Paessler PRTG is another extremely popular monitoring software. Its main selling point is its modular model, letting you only pay attention to and purchase the sensors you need. The free version has all of the features of the paid version, just on a smaller scale.
This is another tool that gives you access to a robust alerts system. It also helps you find issues that Cacti might not. For example, it can help you find problems when large file transfers occur and when users are complaining your software or website are unresponsive or slow.
Main Features
- A sensor-based system that lets you track and pay for exactly what you need
- Extensive network monitoring features
- Extremely robust alerts system
- Sleek, modern UI
- Cloud monitoring capabilities
- Great scalability
Why do we recommend it?
We used Paessler PRTG to resolve a network performance issue where sudden congestion led to frequent user complaints about slow application responsiveness. By monitoring and analyzing the network in real time, PRTG pinpointed the exact source of the congestion – a large file transfer during business hours. This allowed us to implement network optimization measures, ensuring smooth operations and improved user satisfaction.
The Paessler PRTG looks at the traffic data from your networking devices and shows you exactly where your bandwidth is being used, in addition to flagging overuse. You can look at these factors from its central dashboard or generate reports to talk with your team.
The PRTG uses a combination of NetFlow, WMI, and SNMP to look at the health of your network infrastructure and bandwidth. This makes it an extremely reliable tool with a low chance of false positives.
Who is it recommended for?
PRTG offers scalability, making it suitable for businesses with growing network infrastructure that need a monitoring solution that can expand with their needs.
For example, a growing e-commerce company faces scalability challenges as its customer base expands rapidly. Paessler PRTG allows them to continuously monitor their network performance, adapt to increased traffic, and efficiently allocate resources, ensuring a seamless shopping experience for customers during peak demand periods.
Pricing: PRTG is accessible up to 50 sensors and becomes a paid tool from then on, starting at $1750. It also offers a 30 day free trial for as many sensors as you want.
5. SolarWinds Network Performance Monitor – FREE TRIAL
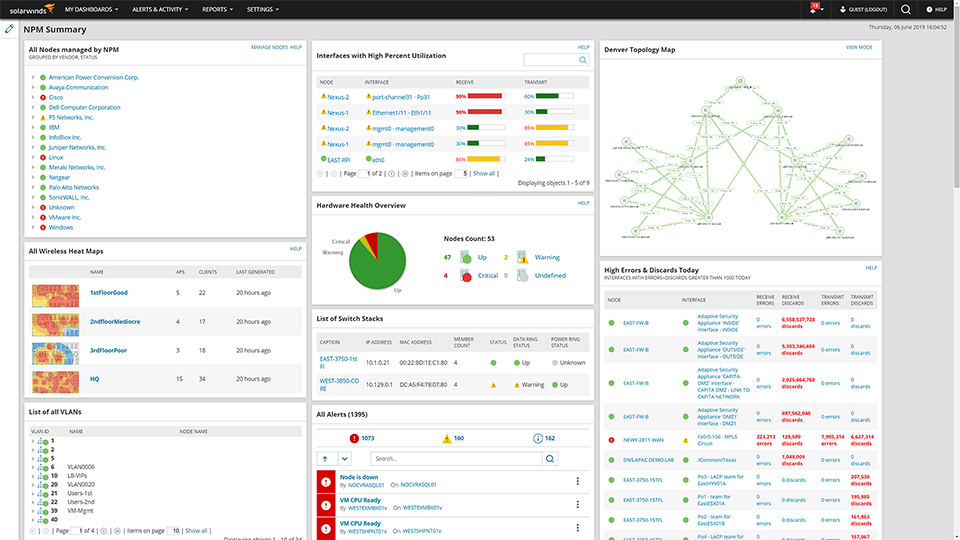
The SolarWinds Network Performance Monitor is a paid tool, the best of the best. It’s a network monitoring solution to help you find, diagnose, and resolve network performance issues. The tool is mainly focused on maintaining the health of the devices within your network.
Main Features
- Multi-vendor monitoring
- An incredibly innovative approach to its scalability, enabling enterprise-sized networks to scale up seamlessly
- Critical path visualization options
- Excellent alerts system you can fully customize
- Intuitive, modern dashboard you can customize to fit your needs
- Autodiscovery features and automatic network topology map creation
Key distinctions
While competitors like PRTG also offer autodiscovery features, SolarWinds Network Performance Monitor stands out due to its user-friendly interface and exceptional autodiscovery topology mapping.
Why do we recommend it?
SolarWinds Network Performance Monitor helped us by detecting a spike in bandwidth usage during peak hours. By customizing alerts, we received real-time notifications whenever bandwidth usage exceeded a certain threshold. This allowed us to identify an application consuming excessive bandwidth during those hours. We promptly optimized the application’s settings, alleviating network congestion and ensuring smooth operations, ultimately improving our network’s performance and user experience.
The tool uses SNMP monitoring to get to your network’s most crucial metrics. Its autodiscovery features are also great for creating a topology map of your network. With both an on-prem and cloud deployment, you can custom fit the NPM to your needs.
The SolarWinds Network Performance Monitor installs on Windows server 2012 R2, 2019, and 2016. Furthermore, it can integrate with the rest of the SolarWinds suite and the Orion platform if you have it installed.
Who is it recommended for?
SolarWinds Network Performance Monitor is recommended for medium to large enterprises seeking a scalable and customizable network monitoring solution. It’s an ideal choice for organizations that require real-time network health monitoring, comprehensive network management, and the flexibility to deploy in hybrid environments.
An organization with branch offices in multiple countries can benefit from SolarWinds Network Performance Monitor by using its network topology mapping and real-time monitoring to detect network issues across locations. This enables the IT team to proactively address connectivity problems, ensuring seamless communication between branches and improving overall operational efficiency.
Pricing: It’s priced on a per-node basis and varies based on your data volume. In addition, it has both perpetual and subscription-based pricing. The SolarWinds NPM comes with a 30-day free trial.
6. Nagios
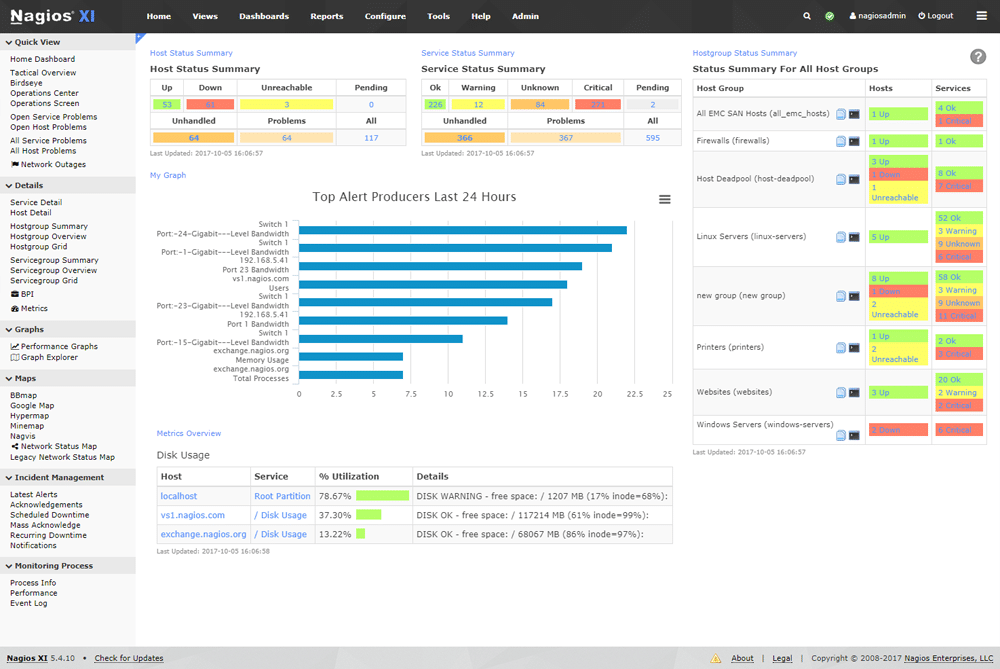
Nagios, formerly Nagios Core, is one of the most popular open-source monitoring solutions on the market. It provides complete bandwidth monitoring using SNMP.
Nagios is straightforward to set up using its switch and router monitoring wizard and allows you to look at a variety of different metrics from its centralized dashboard. The tool is also extremely economical for resource use, as it uses the Core 4 monitoring engine, giving you a high level of performance while being relatively low-consumption.
Main Features
- Multi-user access capabilities
- Excellent event handlers let you automatically restart any failed apps
- Selective access capabilities let you choose who sees what
- A massive online community with over 1 million active users
- Excellent integrations suite
- Extremely scalable, significantly more so than Cacti
Why do we recommend it?
Nagios proved its worth when we utilized it to address a critical security concern. By continuously monitoring our network for unusual activity and unauthorized access attempts, it promptly alerted us to a potential breach. This early detection allowed us to take immediate action to secure our network and protect sensitive data, preventing a major security incident.
Nagios integrates seamlessly with a variety of third-party applications. Its free plugin system lets you combine it with Slack, email, PagerDuty, and many other applications.
In terms of Network Monitoring, Nagios far exceeds Cacti. Although Cacti has some network monitoring functionalities, it is best integrated with Datadog or RRDtool. However, Nagios can be combined with more network monitoring solutions, making it superior in this regard. Nagios also features Netflow support, which Cacti lacks.
Another advantage of Nagios is its alert system. While Cacti might help you spot a problem, you’ll have to notice it yourself. On the other hand, Nagios will alert you regardless of how far away from the dashboard you are.
Who is it recommended for?
Nagios is highly recommended for businesses with complex network environments and a need for robust network monitoring. It excels in network incident detection and response, helping businesses proactively address server failures or security threats.
Companies like large financial institutions can use Nagios to maintain the security and performance of their critical systems. The tool’s early detection of unusual network activity allows the organization to thwart a potential cyberattack, preventing unauthorized access to sensitive financial data and safeguarding the integrity of its services.
Pricing: Nagios is free for small environments with seven or fewer nodes and hosts. Its paid version starts at $1995 for the license and is priced per user. There is also a variety of free training options for Nagios available online. Both of Nagios’ paid versions include a free trial.
7. Zabbix
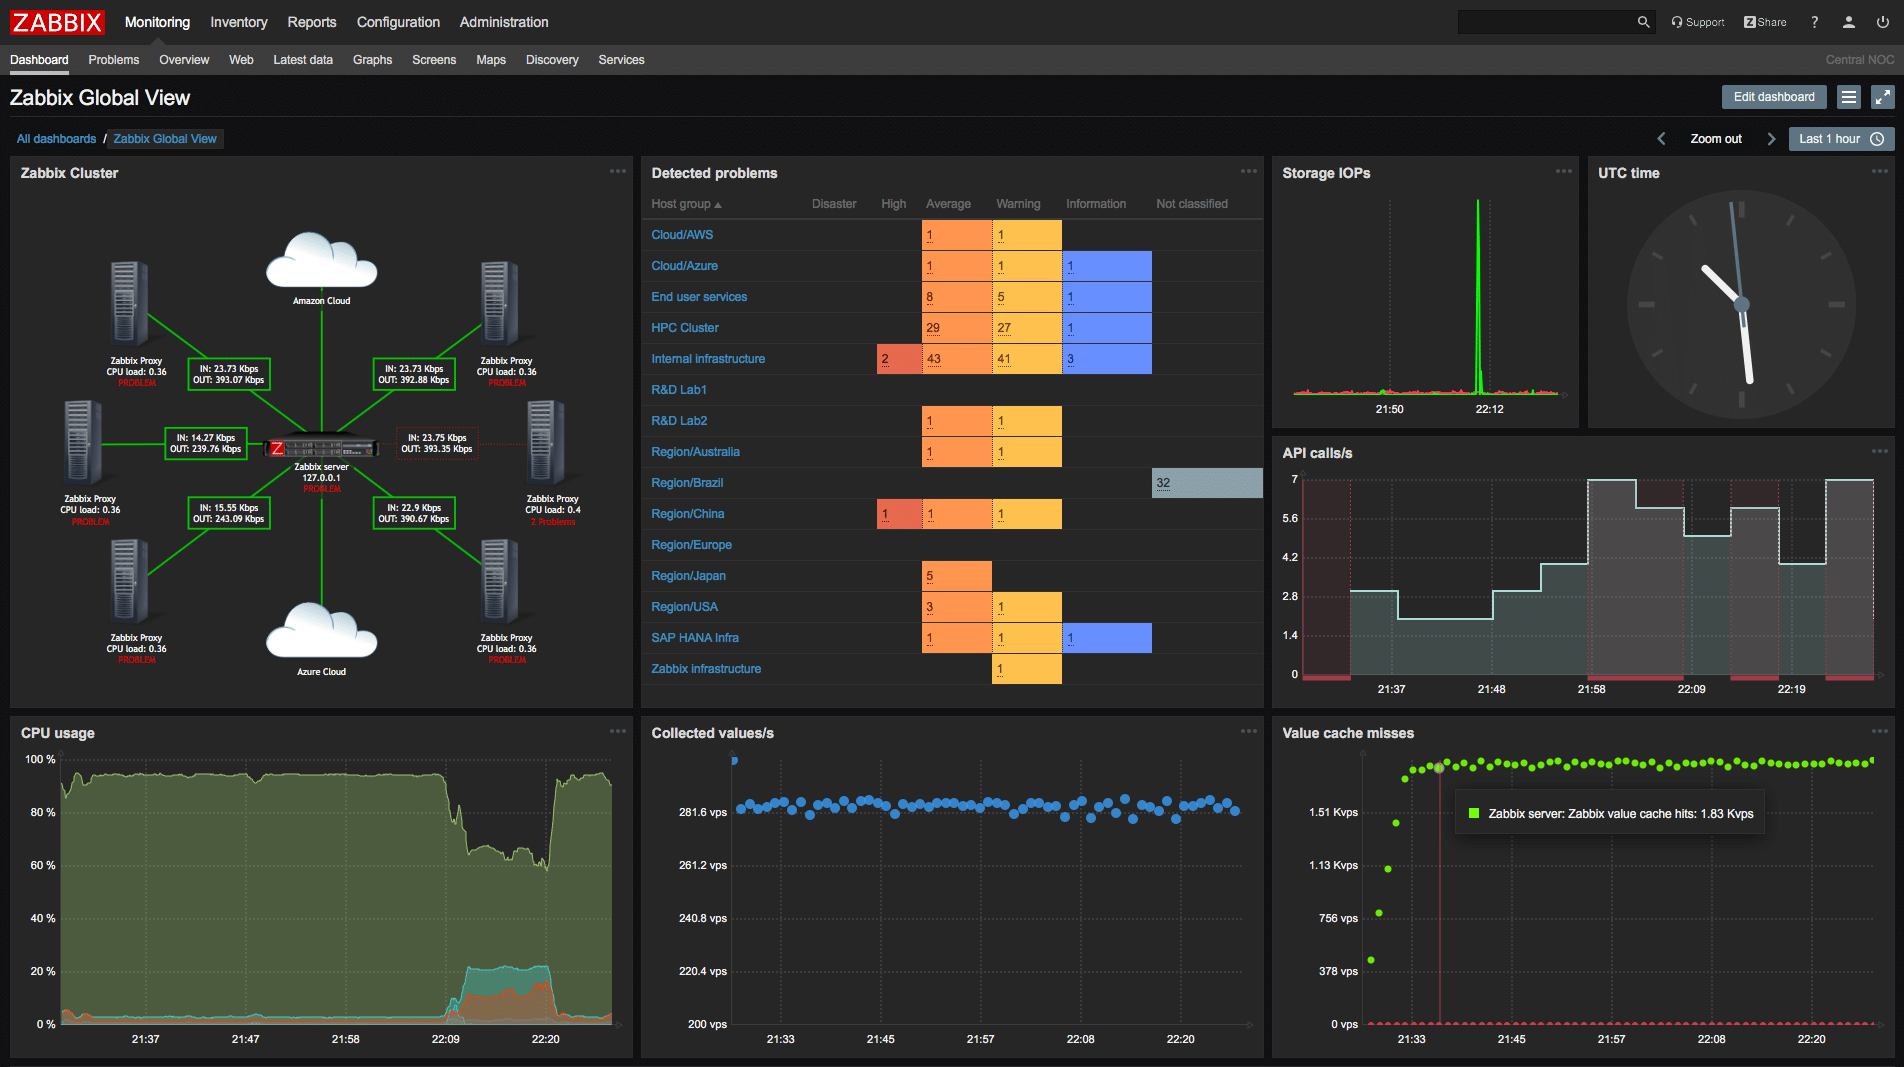
Zabbix is an enterprise-level monitoring software capable of monitoring everything from your web apps’ performance to your servers, network equipment, CPU and memory utilization, packet loss rates, and databases. The tool has gotten massive traction, with companies like DELL and Salesforce using it extensively.
The tool works on a server-agent basis, meaning you have to install the Zabbix agent on a server to have it monitored by the Zabbix server. It also supports all of the most popular operating systems, including Windows, Linux, macOS, Free and Open BSD, Solaris, etc.
Main Features:
- Entirely free and open-source
- You can monitor Java application servers directly through JMX
- VM monitoring capabilities
- Self-protected from brute force attacks
- Extremely easy to create custom scrips for, as you can use Ruby, Python, PHP, Java, or a variety of other languages
- Has a suite of integrations and plugins available
- Online training available
Key distinctions
Like LibreNMS, Zabbix is completely free. However, it distinguishes itself with an abundance of valuable resources, such as the comprehensive Zabbix YouTube channel featuring tutorial videos, a rich collection of free templates on Zabbix Share, extensive online documentation, and a supportive Zabbix forum. Zabbix further streamlines deployment with its intuitive templates.
Why do we recommend it?
Zabbix’s comprehensive monitoring capabilities helped us address a recurring problem with server performance degradation. By tracking key performance metrics in real-time, Zabbix allowed us to identify resource-intensive processes, optimize server configurations, and significantly reduce incidents of slow response times which is key to an overall great user experience.
Zabbix allows you to monitor all of your network’s performance metrics and incidents. You can look at your network performance, including bandwidth usage, packet loss rate, high CPU or memory utilization, and more.
The tool features a variety of templates that work right out of the box and allow you to monitor a variety of different devices. In addition to this, it gathers all of the data it receives so you can look at historical performance.
Zabbix’s predictive features let it predict network downtimes, as well as data usage based on a variety of factors.
Who is it recommended for?
Zabbix is recommended for IT professionals and organizations that require enterprise-level monitoring capabilities for diverse systems and network infrastructure.
A data center provider can use Zabbix’s capabilities to optimize its server infrastructure. By monitoring server health and resource utilization, it identifies servers operating at suboptimal levels and redistributes workloads, resulting in reduced energy consumption and operational cost savings, while maintaining high server performance and stability.
Pricing: The tool is entirely free and open-source, with no limits or restrictions on what you can use it for. The company only asks that you purchase something from them if you’re using Zabbix commercially (although you don’t have to).
8. LibreNMS
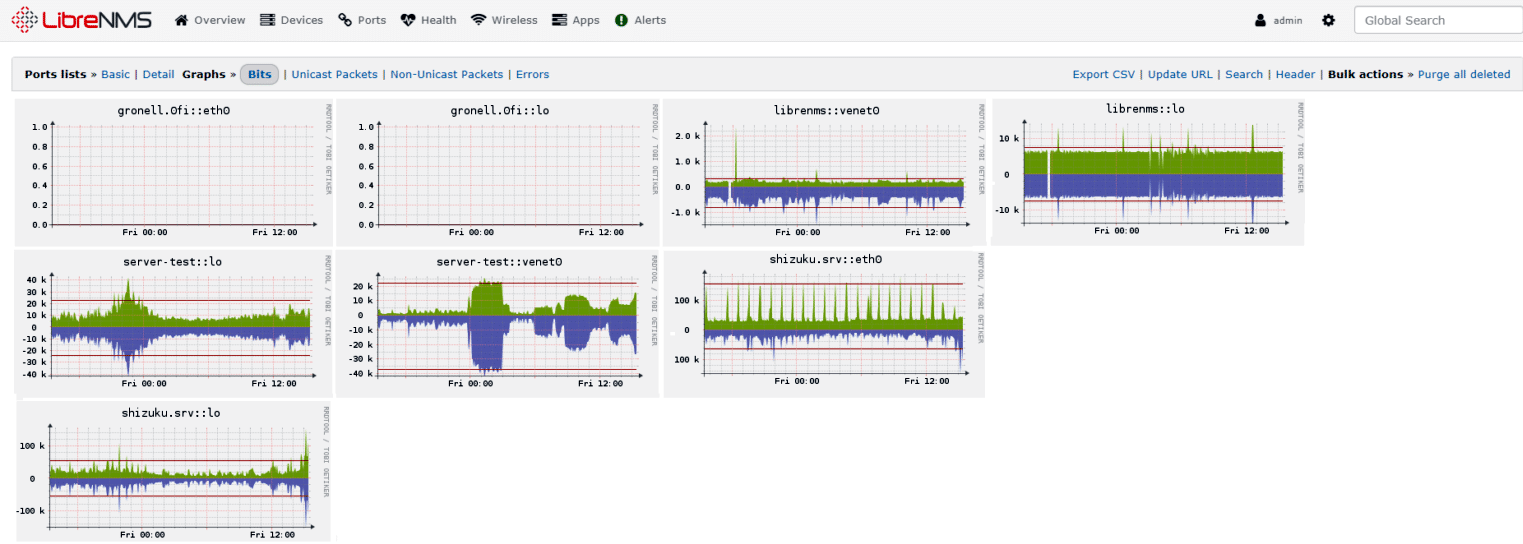
LibreNMS is a fully-fledged network monitoring system supporting various device types and vendors, including Linux, Foundry, Cisco, and many others. As a result, it’s one of the most accessible tools on this list to use straight out of the box. In addition, its autodiscovery features help you spend as little time as possible setting it up.
Main Features
- Extremely flexible alerts system
- The entire API of LibreNMS can retrieve, manage, and graph large amounts of data quickly
- Can create bandwidth bills based on data usage
- Horizontal scaling is an option when your business gets larger
- Integrates with RANCID, collected, SmokePing, Oxidized, and various other solutions
- A variety of authentication methods available
- Web UI that can be used on mobile too
Why do we recommend it?
LibreNMS was instrumental in addressing an issue related to our Linux server resource utilization. By monitoring the servers in real time, we identified processes consuming excessive CPU and memory, allowing us to fine-tune server configurations, resolve resource bottlenecks, and ensure optimal server performance for our Linux-based applications.
The tool is capable of both bandwidth monitoring and location-based mapping. LibreNMS can be locally hosted on most Linux distributions, in addition to having an open, accessible API. There are also Android and iOS apps.
The tool features a highly flexible alerts system capable of sending notifications to email, Slack, IRC, and various other platforms when it detects an issue.
The tool is entirely free and open-source, with no purchases available.
Who is it recommended for?
It’s an excellent choice for both small to medium-sized businesses and larger enterprises seeking an open-source, Linux-friendly network monitoring solution.
For example, a manufacturing company can manage its Linux-based network infrastructure with LibreNMS, optimizing server performance, and thereby reducing IT-related costs.
While it’s not a strict requirement, having some IT expertise or experience can be beneficial when using LibreNMS. The tool offers advanced network monitoring capabilities that sometimes require a certain level of technical knowledge to configure and manage effectively.
9. M/Monit
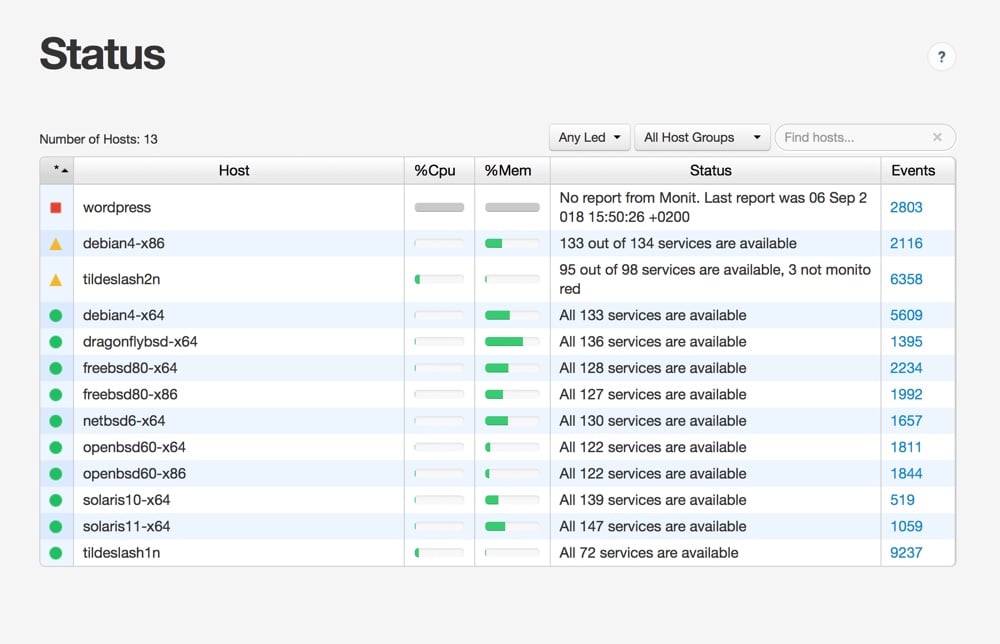
M/Monit is a Unix and Linux supervision tool. It covers various monitoring processes and does it in a way specialized for these operating systems.
The tool will run on any given POSIX system and takes between 10 and 15 RAM, depending on how many hosts you need it to monitor. It will work with databases based on SQLLite 3.x, PostgreSQL 8.4 or newer, and MySQL 5.x or more contemporary.
Main Features
- Straightforward and easy setup
- Excellent graphing capabilities
- Mobile application available
- You can manage and monitor both background and daemon processes
- Errors can be set up to get handled automatically, helping you achieve a higher app uptime
Why do we recommend it?
We put M/Monit through its paces and it addressed a critical concern related to the management and stability of background processes in our Unix and Linux environments. Because it was automatically monitoring and managing background processes and daemon applications, it reduced manual intervention, and its automatic process recovery features significantly improved our application availability and reduced potential downtime.
If one of your processes dies, M/Monit can automatically restart it. Furthermore, if you run into a troublesome situation, the tool features automatic repair and maintenance features to ensure maximum uptime for your business.
The setup process for M/Monit is straightforward, which, in addition to its simple UI, makes it one of the most precise tools to start using. The tool can also look at trends in the data to make predictions for the future.
Who is it recommended for?
Businesses like e-commerce platforms can utilize M/Monit to maintain the reliability of their Unix and Linux-based servers. The tool automatically manages background processes, ensuring seamless server operations even during high-traffic periods, thus delivering a consistent shopping experience to customers and preventing potential revenue losses due to downtime.
M/Monit is recommended for IT professionals and system administrators familiar with Unix and Linux systems, as it simplifies process supervision and provides automatic error handling and recovery. However, its user-friendly interface also makes it accessible to individuals with moderate technical expertise.
10. Netdata
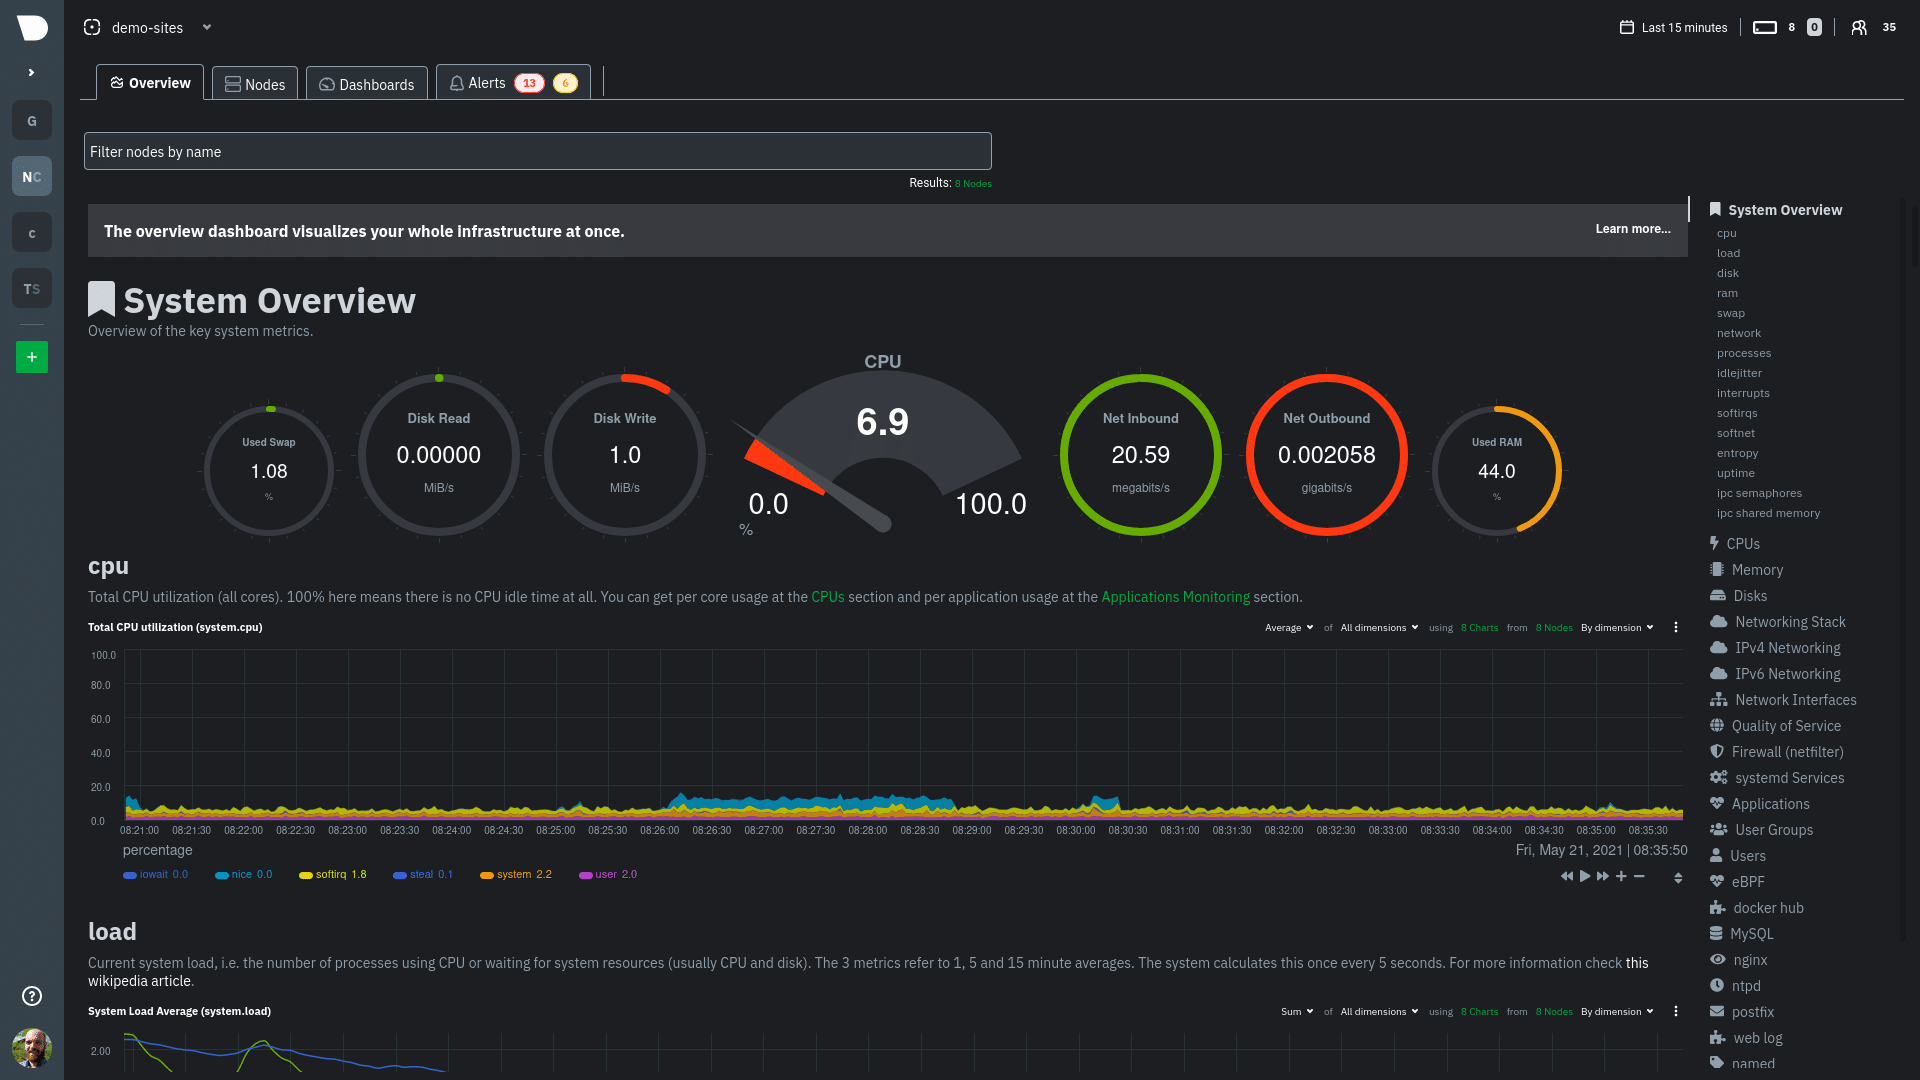
Netdata gives you access to sublime real-time health and performance monitoring for all your systems. The Netdata GitHub community has made its growth abundantly clear throughout its last six years of active development.
The tool is fast and very efficient when it comes to resource use. It’s made to be run on all systems without issue. It will instantly recognize slowdowns or issues within your infrastructure using the thousands of metrics it monitors. Furthermore, the tool offers excellent visualization capabilities and an alert system.
Main Features
- Per-second data collection
- High-res metrics
- Automatic detection and monitoring of your services and apps
- Capable of monitoring thousands of metrics on each node
- Excellent presentation within the dashboard
- Advanced alerts system
- Custom database system
Why do we recommend it?
Throughout its deployment, Netdata was instrumental in addressing our server security issues. By continuously monitoring system metrics and instantly detecting unusual network traffic patterns, it enabled us to identify and block a potential intrusion before it could compromise our data and systems, helping our overall cybersecurity status.
It’s a highly flexible tool, open-source, free, and capable of running on VMs, containers, IoT devices, and physical devices. The tool also saves all of your current metrics to RAM and spills historical ones to your disk so you can store them long-term.
Who is it recommended for?
Netdata is recommended for a wide range of organizations and businesses, regardless of size, that need real-time performance monitoring for their IT infrastructure. It can benefit industry sectors, including technology companies, financial institutions, healthcare providers, e-commerce platforms, and many more, thanks to its flexibility and ability to cater to diverse network environments.
A logistics company can integrate Netdata to enhance the efficiency of its inventory management system. By monitoring server health and resource usage in real-time, they can ensure seamless operations and minimize disruptions in the supply chain, ultimately reducing costs and improving customer satisfaction with timely deliveries.
11. MRTG
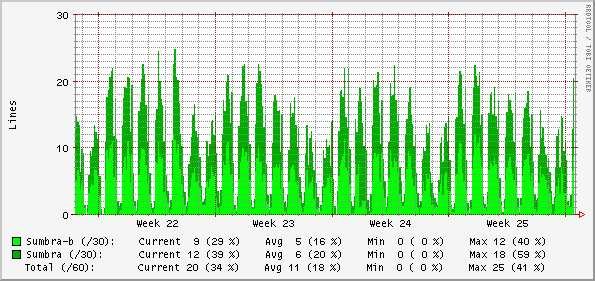
MRTG or Multi Router Traffic Grapher is a graphing tool that can graph various data metrics, including the performance of your network devices.
The tool monitors the load on all of your network links and can create HTML pages with PING images to give you a live visualization.
Main Features
- Detects router interfaces by more factors than their interface number, including IP, description, Ethernet address, etc.
- Extremely simple to configure and set up
- You get its entire source code
Why do we recommend it?
MRTG proved its worth when our team was tasked with the challenge of managing network resources for a gaming event with high data demands. By graphing real-time traffic data, we were able to ensure uninterrupted gameplay and smooth online experiences for thousands of gamers, preventing potential lag and frustration, and delivering a successful gaming event.
This tool was written in Perl and comes with its source code. It’ll operate on pretty much any UNIX platform, as well as Windows NT. The tool is licensed under the GNU GPL, giving you free rein to do whatever you want with it.
The MRTG is easy to configure and set up, with most automatic processes. In addition, the tool can create visual representations of your traffic in the last week, five weeks, or last year.
Who is it recommended for?
MRTG is an excellent choice for businesses of all sizes, from agile startups to established enterprises, and is especially favored by network enthusiasts and professionals.
Its simplicity makes it a valuable companion for those who appreciate clear, insightful network traffic data and organizations seeking a hassle-free solution for optimizing their network performance.
Due to its versatility, companies such as those in the hospitality industry managing a chain of hotels can use MRTG to optimize their guest Wi-Fi services. Monitoring network traffic patterns ensures reliable and high-speed internet access for guests, enhancing the overall guest experience and earning positive reviews, ultimately leading to increased bookings and customer loyalty.
Closing Words
All of these tools provide an excellent alternative for Cacti, with some simply eclipsing its functionalities and others doing specific portions better. As always, when picking a tool, the most crucial factor to consider is your needs.
Depending on what your business was looking to get out of Cacti and your personal preferences, our number 7 tool might be your number 2. With that being said, we’ve made an effort to ensure the top few picks are ones that you can’t go wrong with, even if you were looking to replace almost all of Cacti’s functionalities completely.
What is your favorite Cacti alternative?
Which one of Cacti’s features is most important to you?
Let us know in the comments below!