
It’s not far-fetched to say that nothing in this world carries as much crucial information as today’s databases do. But, unfortunately, a small mistake within a database can leave you stranded without some of your essential data.
Here is our list of the best database monitoring tools:
- Site24x7 Infrastructure – EDITOR’S CHOICE This package of monitoring systems is delivered from that cloud and has a library of plug-ins. Get a 30-day free trial.
- Paessler PRTG – FREE TRIAL This package includes monitoring services for networks, servers, and applications, and it includes a range of database performance tracking tools. Monitor SQL Server, Oracle, MySQL, MariaDB, and PostgreSQL, as well as supporting technologies. Available as a SaaS platform or for installation on Windows Server. Get a 30-day free trial.
- ManageEngine Applications Manager – FREE TRIAL A great tool with a lengthy free trial, held back by its lack of intuitiveness. Get a 30-day free trial.
- ManageEngine EventLog Analyzer – FREE TRIAL A hassle-free database monitoring tool that provides all the information you need to maintain its security and performance. Start a 30-day free trial.
- SolarWinds Database Performance Analyzer for SQL Server Root-cause analysis lets you find out the source of your database problems.
- Datadog Database Monitoring Excellent tool that offers over 400 different pre-configurations you can use.
Because of this, you should enlist quality database monitoring tools to help you manage this. Although it’s pretty difficult to monitor everything you need to at all times, database monitoring tools can leave you with one less thing to keep track of.
The Best Database Monitoring Tools
Our Criteria
The larger your server gets, the more CPU power and memory you’ll need to take advantage of to process your data correctly. Because of this, using a tool is the only viable way to conduct database monitoring. In addition, with SQL servers becoming a mainstay of business practices, SQL server monitoring has become a crucial part of network security.
With that being said, what should you be looking for in a database monitoring tool? Our review of the best database tracking tools out there is based on the following factors:
- How good the tool is at attaching to database instances originating from multiple DBMS
- The quality of its SQL query troubleshooting
- How well-optimized is it
- The ease of use of its UI
- The quality of its alert systems in case a resource shortage or performance fault is found
- How easily can it get to procedures with authentication
- Whether or not it has a free trial – you want to know what you’re getting before you commit to buying
1. Site24x7 Infrastructure – FREE TRIAL
The Site24x7 Infrastructure plan provides network and services monitoring. It can be expanded by plug-ins, and there is one available for SQL Server monitoring. This system is an add-on to the main Server Monitoring part of the Site24x7 system, and it adds extra screens and sensors.
Main Features
- Part of a full system monitoring package
- Database performance tracking
- No overhead
- Remote monitoring via an agent
- Cloud-based system
Why do we recommend it?
Site24x7 Infrastructure, with its cloud-based network and services monitoring, impressed us with its ability to extend monitoring through plug-ins, including SQL Server monitoring. The tool’s focus on minimizing overhead while providing comprehensive database performance tracking stood out during testing. Its agent-based remote monitoring, cloud compatibility, and a 30-day free trial made it a practical choice for a full system monitoring package.
The SQL Server monitoring tool tracks activity within each database instance. The system’s main methodology for examining database performance is to scan through database logs. The tool looks for memory and file I/O, and it also counts and times transactions as they execute. This analysis identifies slow-running queries, and it can also highlight resource shortages.
The system’s log-based strategy means that it doesn’t weigh down the database by running queries inside the instance. Thus, the monitoring system can deliver live activity reports and performance analysis for capacity planning without any overhead.
While the SQL Server plug-in is watching over your databases, other sections of the plan are measuring the performance of servers and networks, so if response times drop, you immediately know exactly which element of your infrastructure is at fault.
Who is it recommended for?
Site24x7 Infrastructure is recommended for businesses looking for a comprehensive system monitoring package with a focus on minimizing overhead. Suitable for SMBs, the tool’s ability to track database performance, support multiple DBMSs, and offer cloud-based monitoring makes it ideal for businesses of varying sizes. The 30-day free trial allows users to explore its capabilities before committing.
Pros:
- Plans are sized to be affordable to SMBs
- MySQL, SQL Server, PostgreSQL, Oracle, MongoDB, and many more DBMSs
- Full stack monitoring in every plan
Cons:
- Extra capacity for larger businesses can rack up the price very quickly
You can get a 30-day free trial of Site24x7 Infrastructure.
EDITOR'S CHOICE
Site24x7 Infrastructure is a cloud-based package that offers full-stack observability for on-premises systems. This package includes database monitoring that is implemented through a library of integrations. Select a plug-in for the DBMS that you operate to get extra probes and screens added to the package. This system means that buyers don’t get a console that is crowded with screens that relate to technologies that they don’t have. This service looks at database instance performance and activity rather than query optimization. It gathers information on throughput and resource usage and also provides facilities for capacity planning. As well as providing extensions to monitor relational databases, the integrations library has modules for Redis, NoSQL systems, and bog data management services. The Site24x7 system will simultaneously monitor networks and servers, so you can investigate whether performance problems actually do originate with your database or if supporting infrastructure is at fault.
Download: Get a 30-day free trial
Official Site: site24x7.com/infrastructure-monitoring.html
OS: Cloud based
2. Paessler PRTG – FREE TRIAL
Paessler PRTG is a package of monitoring systems, and the buyer decides which of them to activate. The bundle includes a number of database monitoring services. The package includes individual sensors for different DBMSs. You only need to activate the probes for the technologies that you actually have, so the dashboard isn’t cluttered with irrelevant screens. Each individual screen can be customized by deciding which metrics should be shown and how they should be represented.
Main Features
- Customizable system
- Monitoring for SQL Server, MySQL, MariaDB, PostgreSQL, and Oracle databases
- Can monitor multiple DBMSs simultaneously
- Included server monitoring
- Database size summary
- Traffic light color-coded status display
- Alerts for capacity exhaustion
The database monitoring system allows a system administrator to automate service availability tracking. It isn’t a DBA tool and doesn’t give access to the database. So, you wouldn’t use this tool for database management – just monitoring.
This database monitoring tool can be deployed in conjunction with network and server monitoring services. You can also simultaneously monitor the applications that access your databases. This provides a full-stack monitoring package.
Every monitor that you activate includes a series of performance or capacity usage thresholds. These will trigger alerts when crossed. As all of the monitoring tools include these thresholds, you will get notified first by the monitor for the service that is in error. With this mechanism, PRTG provides root cause analysis.
The database monitoring screens also give access to the logs for the monitored databases. This is a useful shortcut and means that you don’t need to leave the database monitoring screen to access logs.
Paessler offers PRTG as a SaaS platform. You can also choose to download the package and run it on Windows Server. In each case, you would open the dashboard and look through the sensors on offer. The console will only show those activated sensors and you only pay for the number of sensors that you want to use.
If you only need 100 sensors, you never have to pay for the PRTG system. That isn’t a free trial, it is a permanently free version.
Pros:
- Deployment options between SaaS and on-premises
- Simultaneous monitoring for different DBMSs
- Full stack monitoring
- Root cause analysis
- Graphs and dials for data representation
Cons:
- Won’t run on Linux or macOS
Paessler offers the full PRTG package with all sensors activated for a 30-day free trial.
3. ManageEngine Applications Manager – FREE TRIAL
The Applications Manager system from ManageEngine sports database monitoring as part of its package. It also covers many other bases, so if you’re looking for a multi-tool of sorts, perhaps the ManageEngine Applications Manager is the tool for you.
Main Features
- Both on-premise and cloud installations are supported
- Interdependence issues between apps are easily tracked, letting you better grasp how your database performance affects your business as a whole
- Log monitoring capabilities
- Automatic detection of databases, hardware, and devices
- Long free trial
Why do we recommend it?
ManageEngine Applications Manager, encompassing database monitoring and a variety of other functionalities, stood out for its support for both on-premise and cloud installations. During testing, it efficiently identified interdependence issues, revealing how database performance impacts business operations.
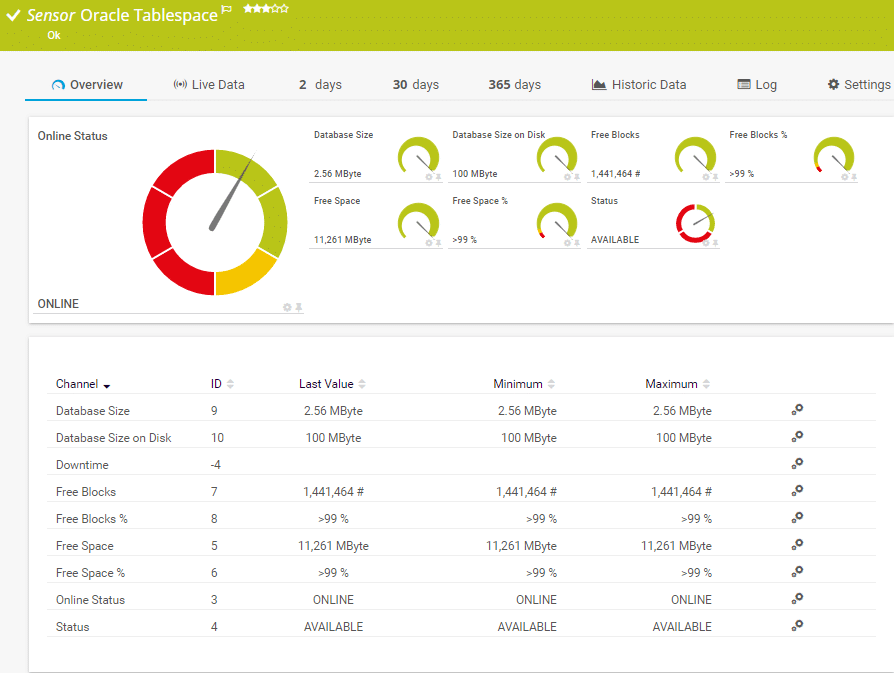
The tool contains specialized procedures specifically made to monitor relational databases like Sybase, MySQL, Oracle, and others. Furthermore, the tool also includes NoSQL databases like MongoDB, Cassandra, Oracle NoSQL, and a variety of others.
This tool keeps watch over metrics for every specific database and keeps track of your apps that depend on the databases, such as web servers. It also pays attention to any suspicious activity in how the interactions between these two categories play out.
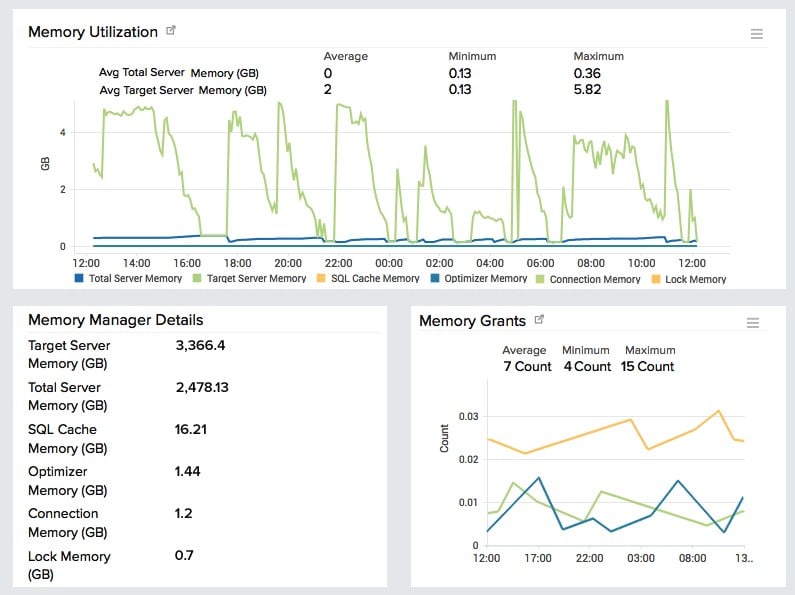
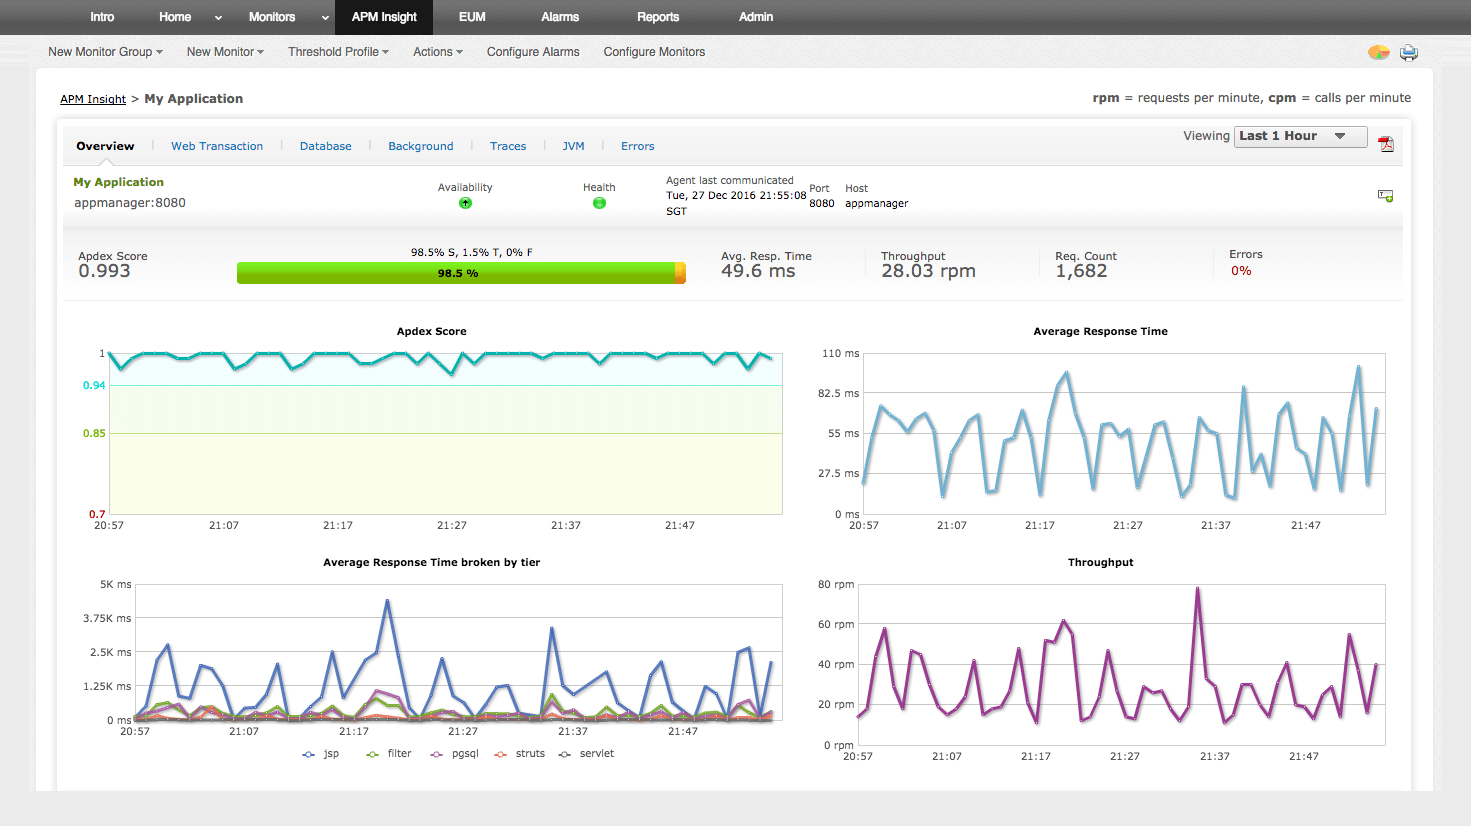
The tab-based dashboard helps you mitigate the time spent going in and out of the program to look at different categories. At a glance, you’ll be able to see live response times as well as general statistics for all of your databases. This helps you get the metrics for a particular DBMS or even a specific instance. The tool also provides you a lot of information on your SQL performance.
Who is it recommended for?
ManageEngine Applications Manager supports Windows Servers and Linux and is recommended for businesses looking for a multi-tool solution with support for both on-premise and cloud installations. Suitable for experienced users, the tool’s coverage of SQL, NoSQL, and Big Data systems caters to diverse database monitoring needs. The transparent purchase plan and a month-long free trial offer an opportunity for in-depth exploration.
Pros:
- Application discovery
- Application dependency mapping
- SQL, NoSQL, and Big Data systems
Cons:
- No SaaS option, although it is available as a service on your AWS or Azure account
ManageEngine Applications Manager is available on a 30-day free trial.
4. ManageEngine EventLog Analyzer – FREE TRIAL
ManageEngine EventLog Analyzer is a comprehensive database monitoring tool that supports Microsoft SQL, MySQL, Oracle, and IBM DB2 databases. It gathers and analyzes logs from databases to identify issues and send alerts accordingly. Its extensive reporting and compliance are helpful as well.
Main Features:
- Securely collects logs from different databases for analysis.
- Standardizes and stores the logs safely in a central location.
- Monitors changes to tables, user permissions, server logons, and other security-related metrics.
- Sends real-time alerts on security events.
- Detects external threats to databases.
- Ensures compliance with data privacy regulations.
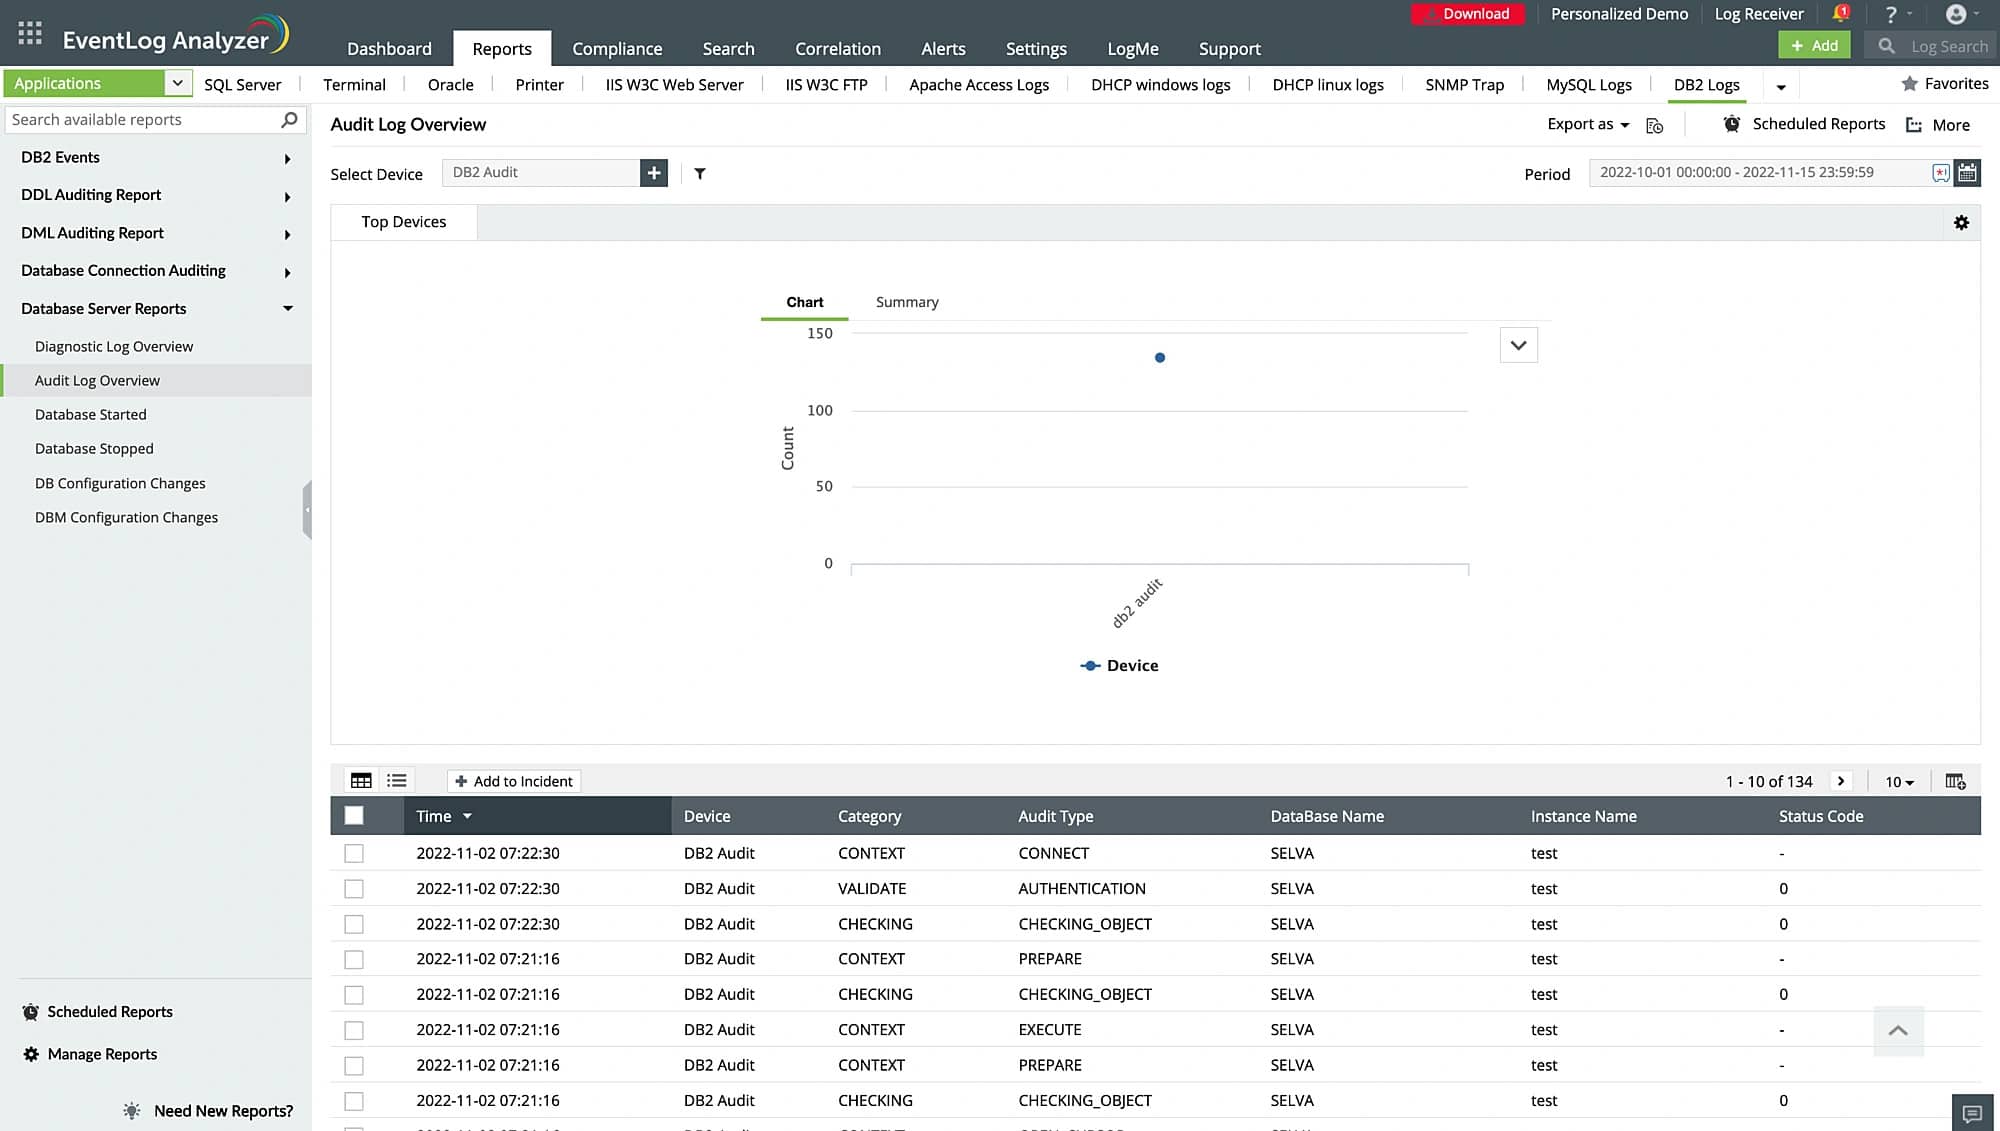
This unified database monitoring tool acts as a centralized platform for collecting, managing, storing, and monitoring database logs. With this analysis, you can monitor changes to the database server, unauthorized access, and other signs that can indicate a potential external or insider threat. The results of the analysis are displayed on a user-friendly and easy-to-understand dashboard for quick understanding. Based on this data, you can take appropriate action to reduce the impact of attacks.
Another notable aspect of this tool is its real-time alerts on critical events that enable you to allocate resources accordingly. Its prebuilt reporting templates also support auditing and compliance. Specifically, it ensures compliance with standards, like GDPR, GLBA, FISMA, PCI DSS, SOX, CCPA, and more.
Download a 30-day free trial to get started.
5. SolarWinds Database Performance Analyzer for SQL Server
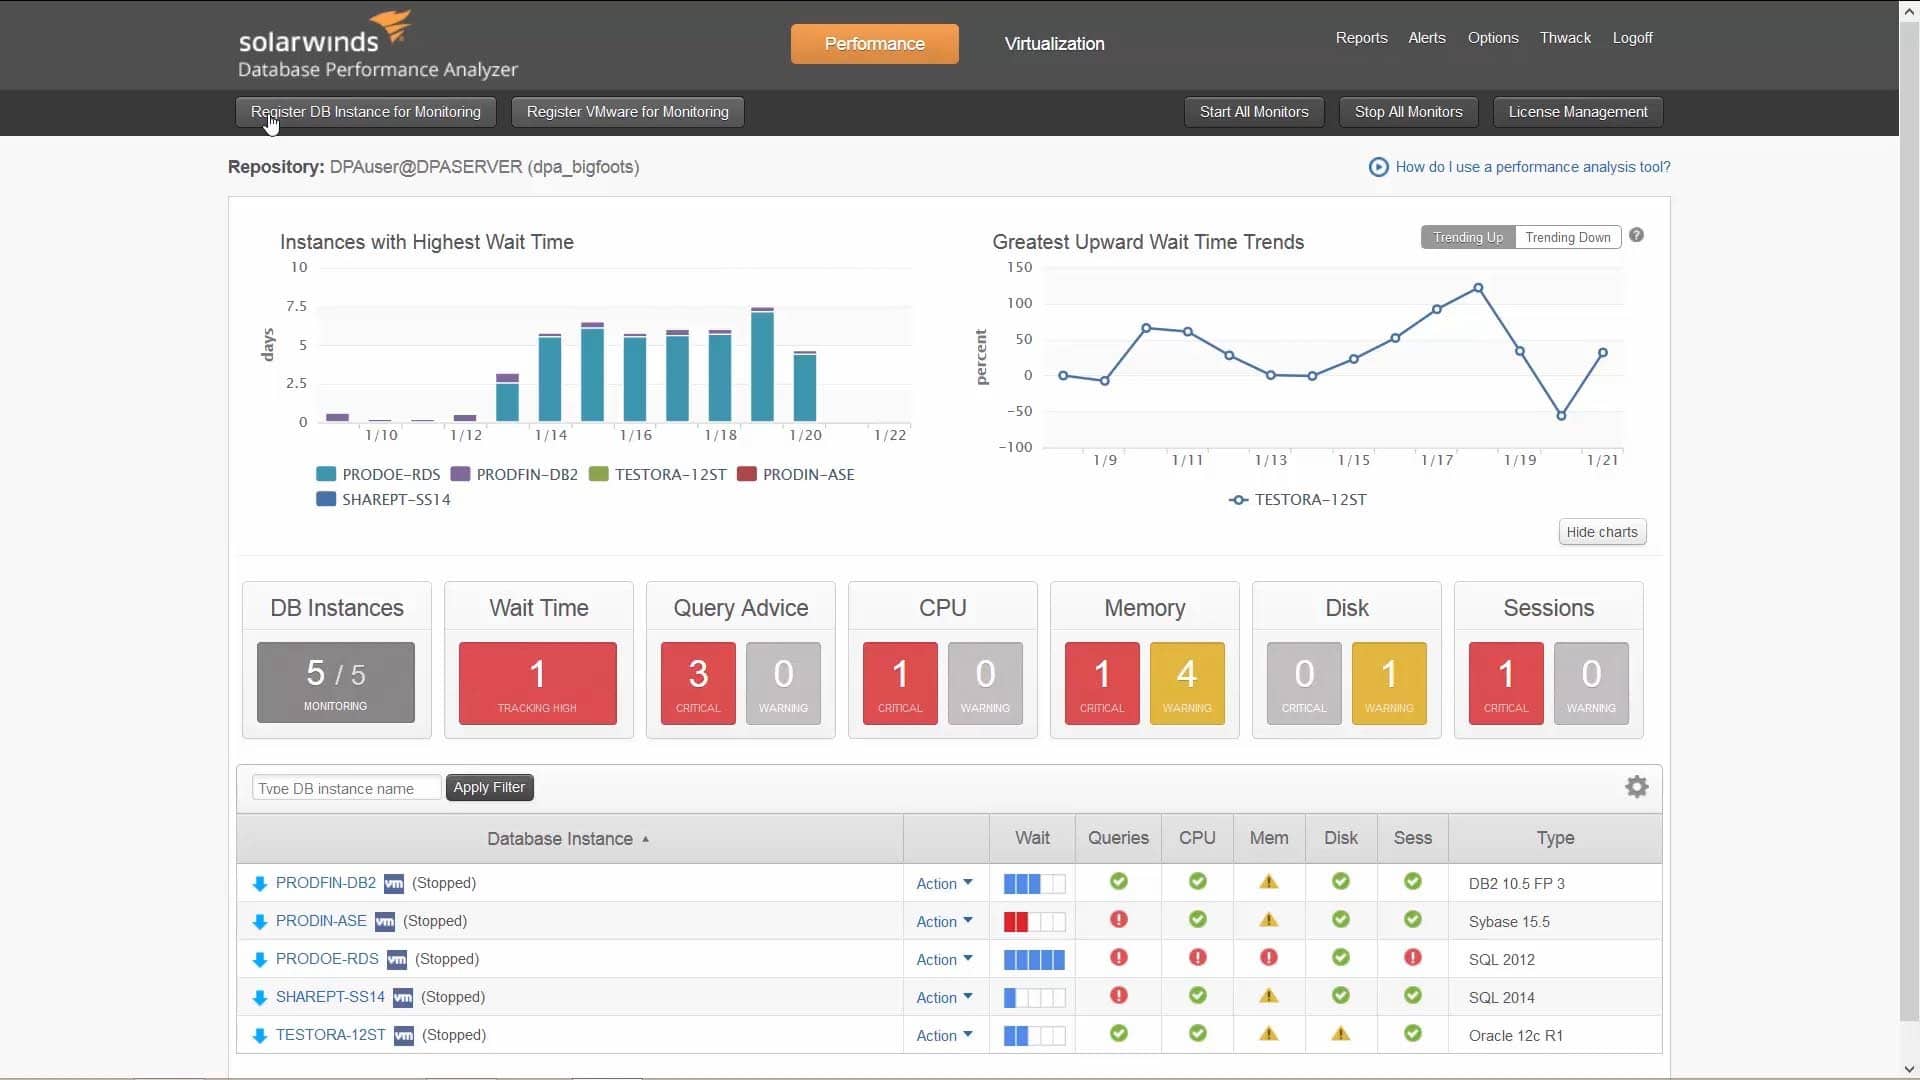
Made by a giant in the cybersecurity industry, it’s no surprise that the SolarWinds Database Performance Analyzer is a fantastic tool for network admins to improve their ability to react to network issues in real time. It allows you to keep track of your server’s performance through its intuitive dashboard. Furthermore, you can see its available disk space, CPU memory, and the status of all queries present.
Main Features
- Excellent, intuitive GUI
- Real-time monitoring with a variety of alert systems that are trivial to integrate with your other cybersecurity solutions
- Its threshold monitoring utility helps your team stay proactive and address issues before they start putting a number on performance
- Lots of customization lets it stay versatile and valuable regardless of how far you want to scale it
- In-depth root cause analysis helps you stay as efficient as possible
- Supports both cloud-based and on-premises installation
- It boasts various features like its index and query tuning advisors that help you get an excellent tool right out of the box without needing to hassle yourself with setting up
Why do we recommend it?
During our extensive testing of SolarWinds Database Performance Analyzer, it proved to be a powerhouse for network admins. The intuitive GUI provided real-time monitoring of server performance, including crucial aspects like available disk space, CPU memory, and query statuses. What set it apart was its exceptional root-cause analysis, allowing us to delve deep into database metrics and even inspect the pure code when needed.
If the tool detects a potentially malicious device, it’ll flag it with yellow color as a warning, and it’ll fag it with red if SolarWinds determines the threat to be of critical importance. You can also look at various trends in your server health using its excellent graphical representation capabilities.
Its root cause analysis capabilities let you monitor your databases in much more depth, as the tool permits multi-level permissions as well as group-based policies. An excellent part of this is that it steps away from database metrics when needed and gives you a look at the pure code.
SolarWinds supports various operating systems, ranging from Windows, Linux, and UNIX to AWS launch and Azure Marketplace. Because of this, there’s often little reason not to at least give it a try.
Who is it recommended for?
SolarWinds Database Performance Analyzer is recommended for network admins and businesses of all sizes, offering versatility and valuable insights. Its user-friendly interface caters to beginners, while the root-cause analysis makes it suitable for advanced users seeking in-depth database monitoring. The tool’s scalability and compatibility with different operating systems make it an excellent choice for small, medium, and large enterprises. With that being said, it’s a bit expensive, with its lowest price sitting at almost $2000. And while it offers a 2-week free trial, we feel that a month would let its potential users get a firmer grasp on the tool.
Pros:
- Correlates database activity with server resource availability
- Response time metrics
- Query evaluation for performance
- Performance predictions
- Database object optimization
Cons:
- No SaaS option, although you can install it on your AWS or Azure account
SolarWinds Database Performance Analyzer is available on a 14-day free trial.
6. Datadog Database Monitoring
Datadog is a well-known company in the world of cybersecurity for making quality tools cram-packed with features. Datadog database monitoring tool is no exception to this. It takes an innovative approach to use machine learning to figure out the default performance profiles for your apps and public network. This lets it automate its alert threshold and makes sure that it doesn’t spam you with needless notifications when everything’s running correctly.
Main Features
- Excellent graphical representation options that let you monitor a variety of metrics
- Endless customization with the dashboard
- Being a cloud-based tool, you can use Datadog Database Monitoring from anywhere in the world
- It features over 400 different integrations, meaning
Why do we recommend it?
Datadog’s Database Monitoring tool, known for its machine learning approach to set default performance profiles, impressed us with its graphical representation options and extensive customization. With over 400 integrations, it showcased adaptability for various DBMSs.
Even though Datadog automatically sets its alert thresholds, you can change and adjust them at will, as well as set up custom conditions to trigger alerts. You can do this either manually or by combining multiple performance checks through their easy-to-use tool.
Datadog is excellent when used in a larger team. This is because it offers various visualizations that can be used to gain a lot of insight into where any issues might be coming from if you’ve got the workforce.
Being cloud-based, Datadog is one of those tools that can help you with your database monitoring remotely. Additionally, centralizing your monitoring services can be a great boon for many enterprises dealing with issues due to splitting their workload between many locations.
When it comes to visualization and performance reporting, Datadog is excellent at collecting and presenting the information you need intuitively. You can also send these materials through Slack, making communicating with shareholders a breeze. It also supports integration with a variety of other programs.
Who is it recommended for?
Datadog Database Monitoring is recommended for teams seeking advanced features and customization options in a cloud-based environment. It’s suitable for businesses with specific needs, such as marketing agencies dealing with diverse client data and analytics. Its ability to integrate with various DBMS further adds flexibility.
While not the most beginner-friendly, Datadog caters to users looking for a tool with machine-learning capabilities and extensive visualization options.
Pros:
- Part of the Infrastructure Monitoring package
- Extensions for SQL Server, MySQL, Oracle, SAP HANA, plus many other DBMSs
- Cloud and on-premises databases
Cons:
- No on-premises version
Closing Words
When selecting the best database monitoring tool for your business, you can’t go wrong when picking any of these four entries. You must be able to identify the needs of your enterprise and act accordingly. No matter how powerful a tool is, if you’re not getting the most out of it, you’ll find it lacking.
Do you have any experience with the tools on this list? Did we miss your favorite database monitoring tool? Let us know in the comments below!