
Every electronic device emits heat as a part of its regular function. However, there’s a limit to how much heat each device can handle before it gets damaged or malfunctions. Monitoring the temperature of your devices ensures that you don’t face overheating issues or accidentally decrease the longevity of your digital devices.
CPU temperature monitors help you monitor the temperature of the CPUs within all of your devices from one location. Doing this lets you find out quickly if a piece of hardware is facing overheating issues and lets you fix it before your devices get damaged.
Here’s our list of the best temperature monitoring tools:
- Atera – EDITOR’S CHOICE A remote monitoring and management platform that follows CPU and hardware temperatures in real time, using alerts and analytics to help stop overheating and protect system performance over time. Get a 30-day free trial.
- ManageEngine OpManager – FREE TRIAL This software package provides automated monitoring for network devices and servers and includes a screen for server temperature and fan activity. Runs on Windows Server, Linux, AWS, and Azure. Get a 30-day free trial.
- Site24x7 – FREE TRIAL A monitoring platform that covers networks, endpoints, cloud services, applications, and web assets, while also including CPU temperature tracking within its hardware monitoring functions. Access a 30-day free trial.
- Paessler CPU Monitoring with PRTG – FREE TRIAL The Paessler PRTG is a sensor-based system that lets you choose what features you need and pay for. Start a 30-day free trial.
- Open Hardware Monitor The best free tool, OHM, is open-source and has a massive community ready to help you.
- HWMonitor A great free tool for SMBs that want a tool that requires low technical knowledge while still providing all of the necessary features.
- Core Temp A tool that supports monitoring via phone and has a variety of addons
- HWiNFO A detail-oriented tool that can help you get to some of the more rarely reported metrics
- Speecy An excellent tool for historical temperature analysis
- SolarWinds CPU Monitor A part of the excellent SolarWinds Engineer’s Toolset.
Overheating can cause a device to crash, which takes time and money to fix, which leads to many firms using temperature monitoring tools to ensure their devices are always running at optimum temperatures.
Our Criteria for selecting a temperature monitoring tool:
We’ve based our criteria on how severely each of these factors impacts the regular function of your devices. We’ve looked through dozens of tools to see what kind of features are most valued among consumers. These include, but are not limited to:
- Dashboards including temp. Readings on a per-core basis
- Motherboard temperature indicators
- Temperature thresholds combined with the ability to set your alerts
- The ability to monitor fan speeds
- The power or lack thereof to monitor CPUs further than just temperature
- Showing CPU clock speed
- You are having a free trial, so you don’t need to commit to purchasing a tool you don’t need
- The value the tool gives compared to how much it costs
- The scalability of the tool
So, without further ado, let’s get into it.
The Best Temperature Monitoring Tools
1. Atera – FREE TRIAL
Atera is a cloud-based tool giving you all of the tools required for an MSP or managed service provider. Of course, this includes their RMM or Remote Monitoring and Management module.
Main Features
- Cloud-based monitoring tool
- Explicitly geared towards MSP, helping you provide temperature monitoring as part of your offers
- Excellent UI and visuals offer an intuitive look at your devices
- Monitors a variety of different factors at all times
- It’s a subscription service, which helps keep it affordable for SMBs
Why do we recommend it?
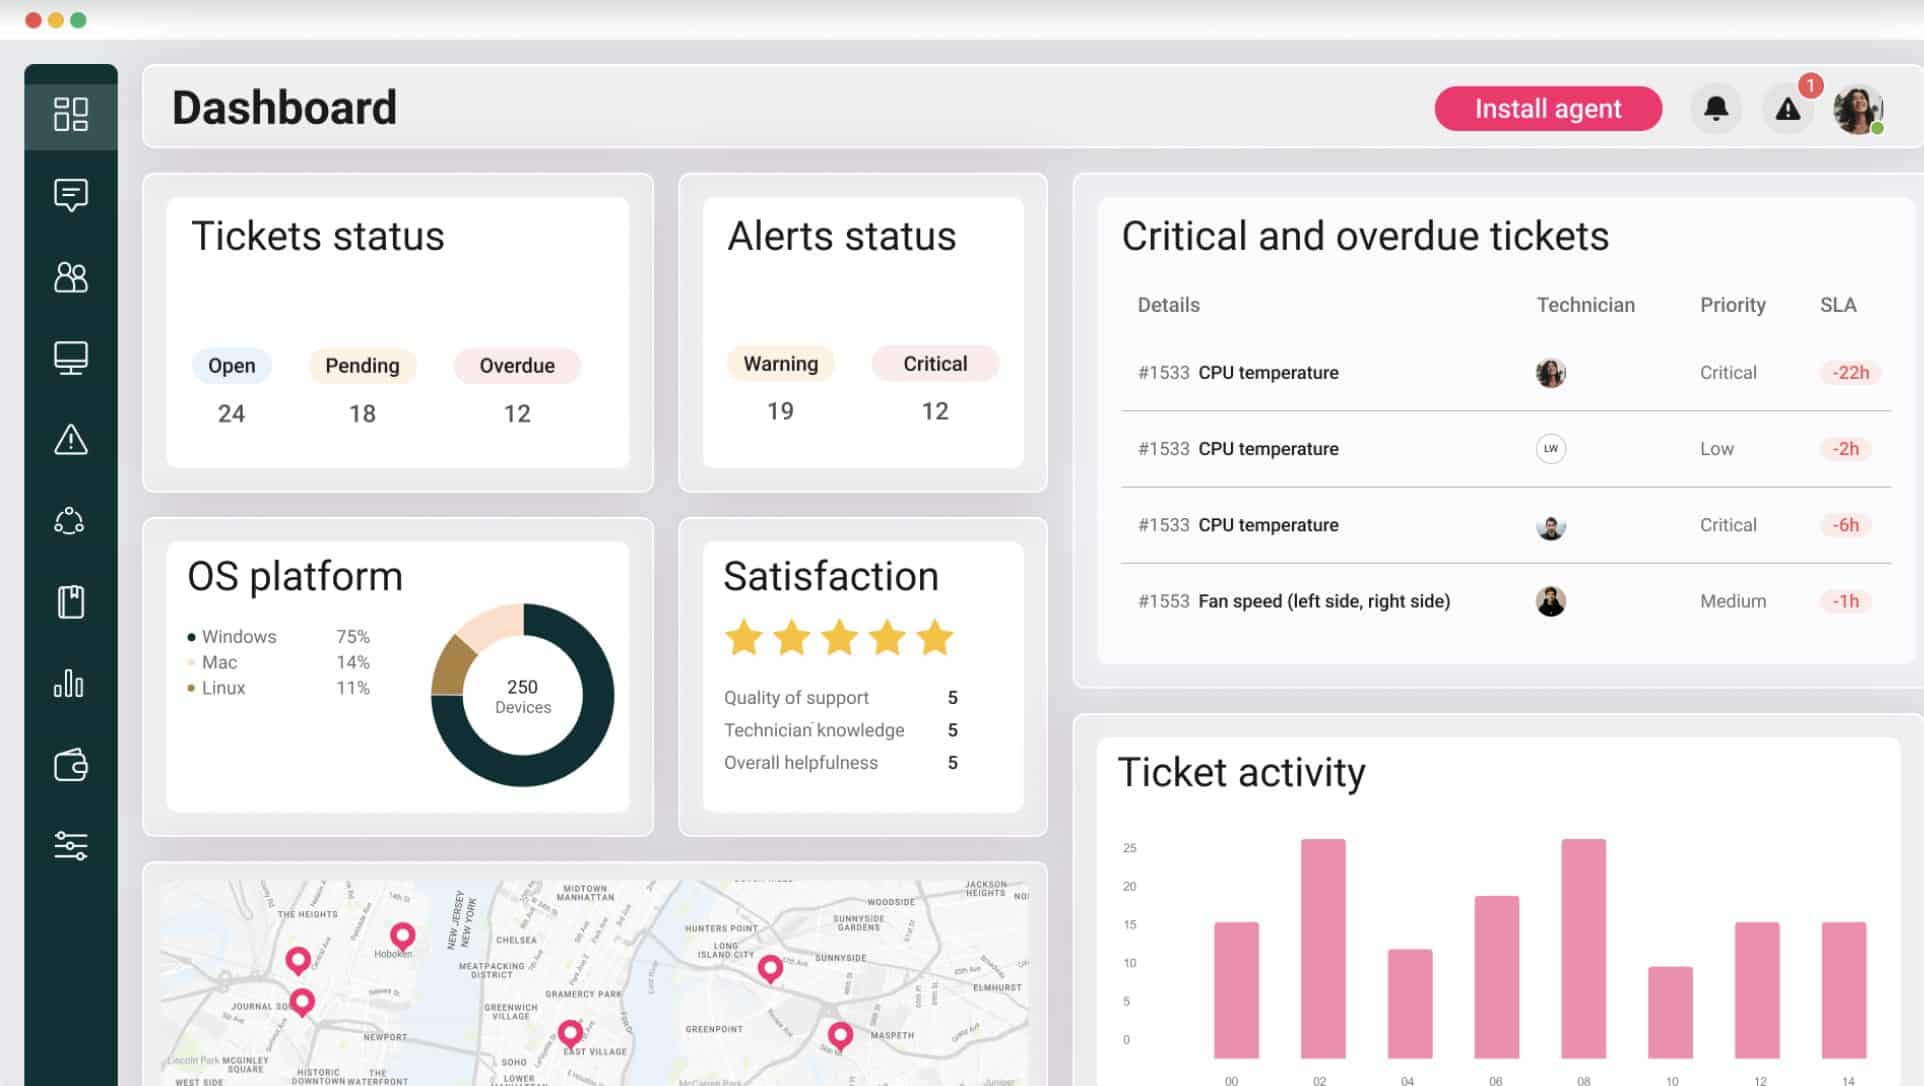
In our assessment, Atera stood out as a cloud-based tool designed for Managed Service Providers (MSPs), offering comprehensive Remote Monitoring and Management (RMM) capabilities. The tool’s dashboard provided a detailed look at system metrics, including CPU temperature, fan performance, and memory utilization. Atera’s subscription model and cloud-based architecture make it an affordable option for SMBs, while its emphasis on MSPs aligns with businesses offering managed services.
Atera’s dashboard gives you a comprehensive look at the system, and it uses alerts to notify you if something goes awry. The dashboard also has a summary screen so that you can look at the most important metrics first.
There’s a lot of different metrics that Atera follows, including the performance data of all CPUs, such as their utilization, capacity, and temperature. The tool will also show you memory utilization, fan performance, and other factors.
Who is it recommended for?
Atera is recommended for Managed Service Providers (MSPs) seeking a cloud-based RMM solution with temperature monitoring capabilities. Its subscription model, intuitive dashboard, and focus on MSP needs make it suitable for businesses providing managed services. Atera’s ability to monitor various metrics and its emphasis on real-time data visualization contribute to its effectiveness in supporting MSPs in delivering optimal services to clients.
EDITOR'S CHOICE
Atera is our top choice for temperature monitoring because it gives IT teams a broader platform than a standalone heat-checking tool. It tracks CPU and hardware temperatures live alongside other system data, making it easier to catch rising heat before it turns into hardware failure or service disruption. Automated alerts help technicians react quickly when readings move past safe limits, while dashboards and historical analytics make longer-term temperature patterns easier to understand. Because the platform is cloud-based, teams can respond remotely, and temperature monitoring sits alongside patching, security monitoring, and wider performance tracking in the same service.
Download: Get a 30-day FREE Trial
Official Site: https://www.atera.com/signup/
OS: Cloud-based
2. ManageEngine OpManager – FREE TRIAL
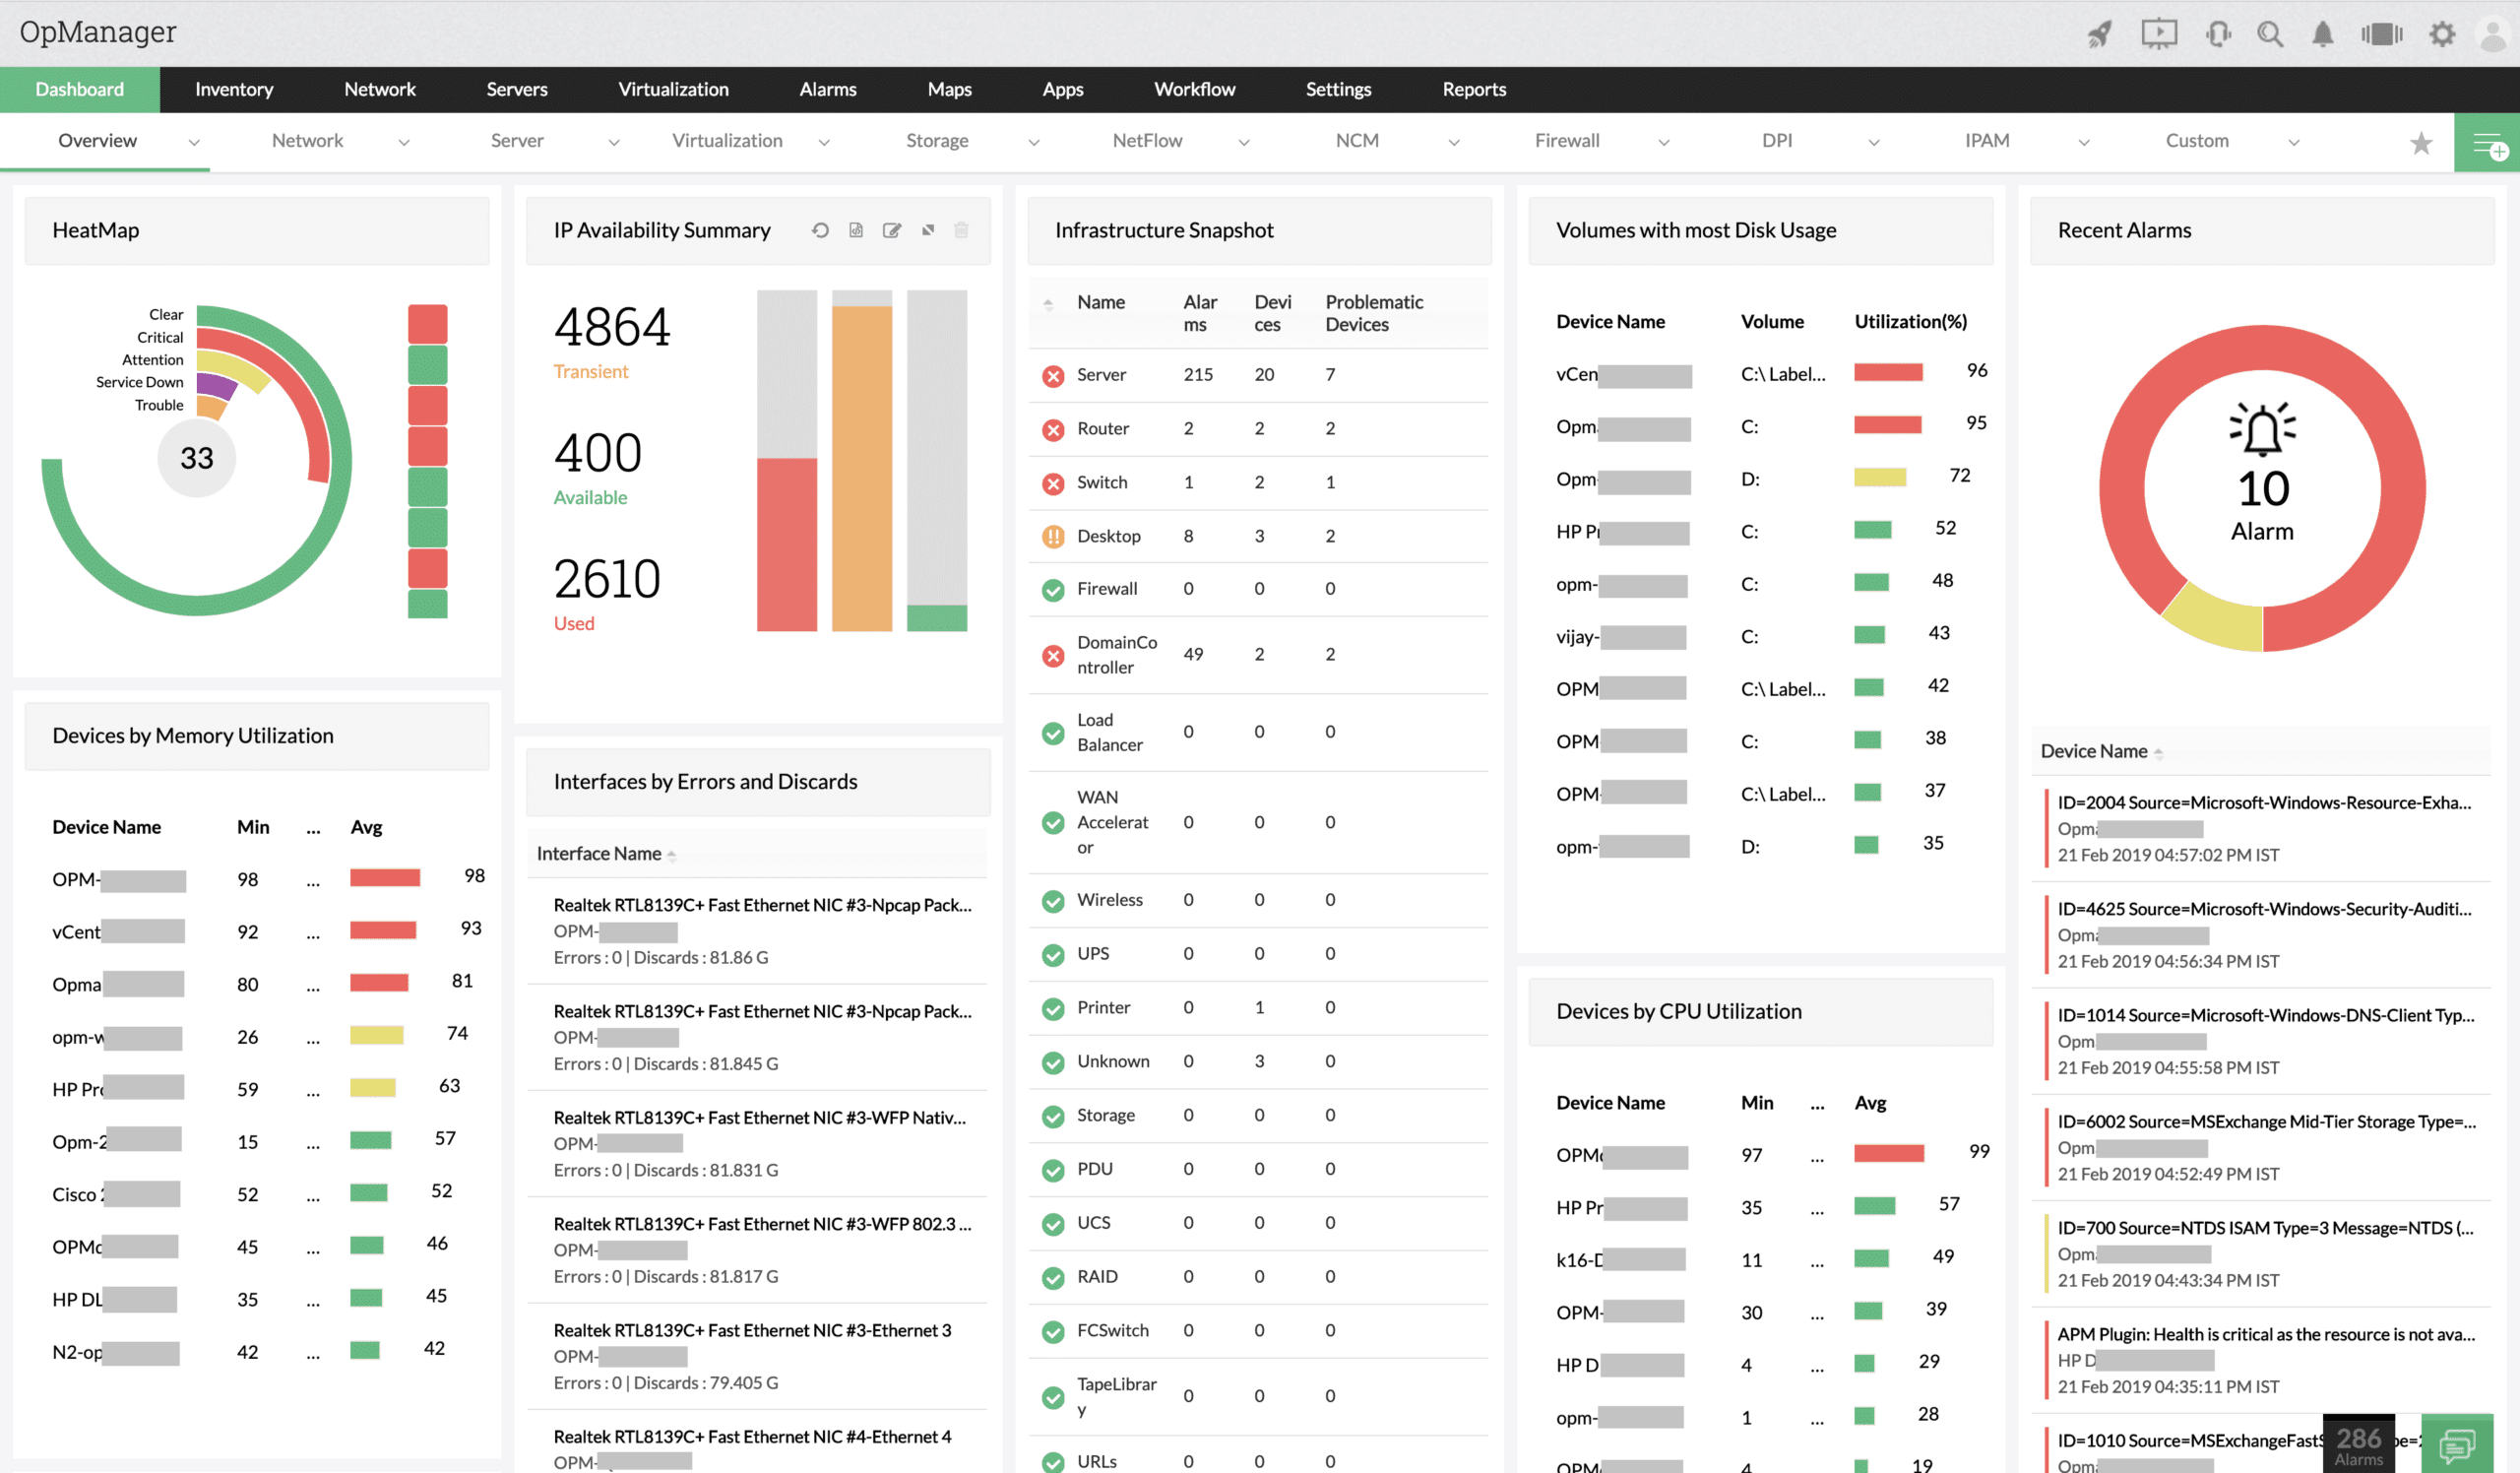
ManageEngine OpManager is an automated monitoring system that covers network devices and servers. The server monitoring service includes tracking for the physical properties of the computers under management, such as fan activity, CPU temperature, processor clock speed, power supply rating, and battery life.
Main Features
- Customizable screens
- Processor speed and temperature
- Fan speed and status
- Power supply and battery statuses
- Data exportable to PDF or spreadsheet
Why do we recommend it?
Through our testing, ManageEngine OpManager emerged as a robust automated monitoring system, excelling in network and server monitoring. Its dedicated server temperature and fan activity screen, coupled with customizable features, provided a comprehensive solution for hardware monitoring. During our trial, it demonstrated efficiency in tracking physical properties, including CPU temperature, offering detailed insights into potential overheating issues. The live status tracking, available on Windows Server, Linux, AWS, and Azure, showcased its versatility and reliability.
The OpManager system is a software package that installs on Windows Server or Linux. It is also available as a service on AWS Marketplace and Azure Marketplace. The dashboard for the system provides live status tracking for network devices, using the Simple Network Management Protocol and you can get an app so you can access the dashboard from an Android or iOS mobile device.
Who is it recommended for?
ManageEngine OpManager is recommended for businesses seeking automated monitoring of network devices and servers. Its customizable screens, processor speed, and temperature monitoring make it suitable for various industries, from healthcare to finance. The tool’s compatibility with multiple platforms, including cloud services, caters to diverse business environments. OpManager is well-suited for medium to large enterprises requiring a scalable solution with a 30-day free trial option.
3. Site24x7 – FREE TRIAL
Site24x7 provides CPU monitoring with live visibility into processor behavior across system hardware. In addition to utilization and load, the service tracks temperature so administrators can see when thermal pressure is building and respond before it degrades performance or stability. The dashboard keeps those measurements easy to review across the monitored environment.
The package also extends beyond CPU metrics. Site24x7 follows memory use, disk capacity, and network traffic across on-premises and hybrid environments, which means temperature readings can be judged in the context of wider system behavior rather than in isolation.
Custom alerting is built in as well, so teams can be notified as soon as monitored values move past defined thresholds and can act before the issue spreads.
Main Features
- Shows live CPU usage, temperature, and related performance metrics
- Sends threshold-based alerts through email, SMS, and integrations
- Builds reports for reviewing CPU behavior over time
- Uses a dashboard designed for straightforward monitoring and management
- Applies AI-based forecasting from historical trends
- Flags unusual CPU behavior with adaptive thresholds
Alongside CPU monitoring, Site24x7 also provides website uptime checks, application performance monitoring, and network monitoring, making it possible to manage several parts of the environment from one service.
The platform also integrates with third-party applications and services, helping teams maintain a broader operational view while monitoring processor health. You can examine the package through a 30-day free trial.
4. Paessler CPU Monitoring with PRTG – FREE TRIAL
The Paessler PRTG is an all-in-one solution covering network, server, and app monitoring. There’s a variety of different ways of covering temperature monitoring in PRTG. However, one of its most significant selling points is its revolutionary sensor-based design. This lets you only pay for the sensors you use rather than having to pay for an entire tool.
Main Features
- Pay for only the sensors you need
- Extremely scalable, not only can the tool scale up without any growing pains, but it also makes it extremely easy to do
- You can make it, so it monitors just temperature, but also efficiently and quickly expand its scope
- A variety of pre-configured sensors you can use
- You can create your sensors to suit your desires
- CPU load monitoring is supported for devices lacking thermometers
Why do we recommend it?
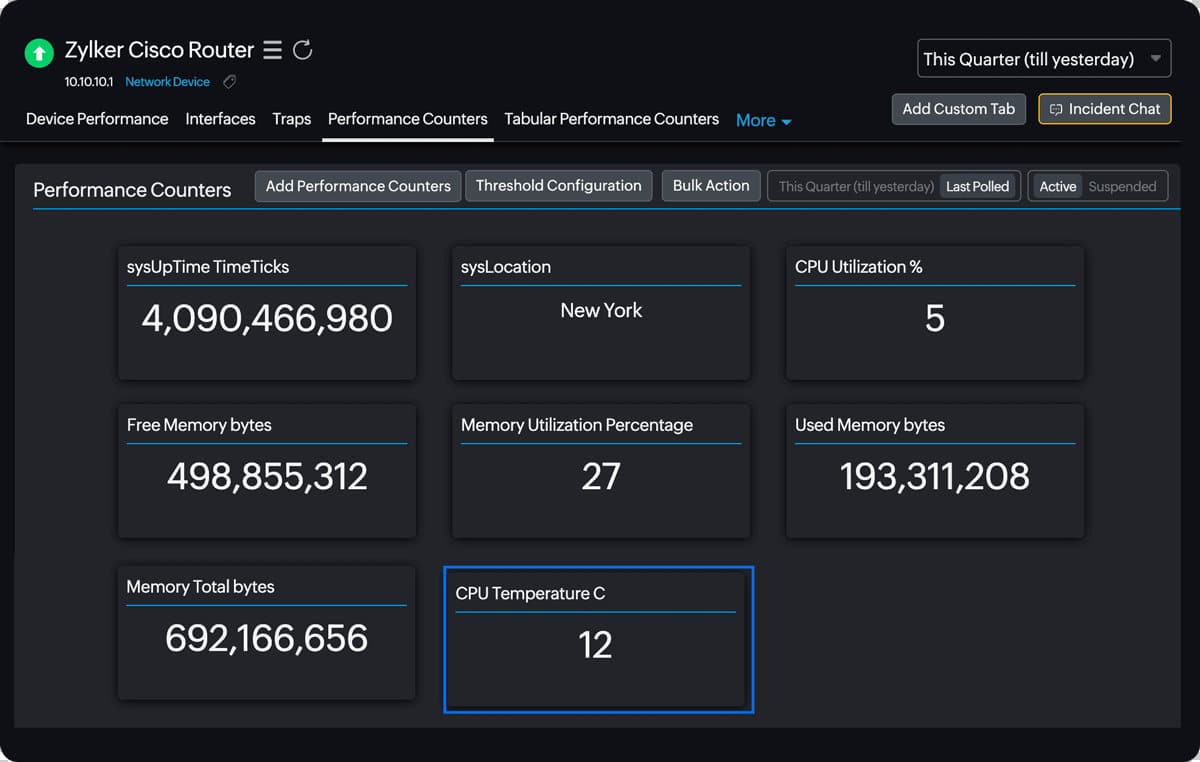
In our testing, Paessler PRTG demonstrated versatility with its sensor-based system, allowing us to choose specific features and pay accordingly. The nine sensors dedicated to temperature monitoring, along with support for CPU load monitoring even in devices lacking thermometers, offered a tailored approach to hardware monitoring. While the tool’s interface may require some time to master, its scalability and ability to efficiently expand the monitoring scope were evident during our trial.
The PRTG has various sensors that can help you monitor the temperature of servers and other devices within your network. If your hardware supports it, the most efficient one is SNMP, but don’t be dissuaded even if it doesn’t.
PRTG comes with monitors that can take advantage of WMI to get Windows Server CPU data. In addition, some sensors help you monitor Linux servers in specific. All in all, the PRTG boasts a whole nine sensors that can gather temperature data. With that being said, if your devices don’t have a thermometer within them, simply monitoring CPU load can often be a suitable substitute.
Who is it recommended for?
Paessler CPU Monitoring with PRTG is recommended for businesses of all sizes looking for a customizable and scalable monitoring solution. Its sensor-based design allows users to pay for only the sensors they need, making it cost-effective and adaptable to varying monitoring requirements. While the tool does have a learning curve, its capabilities suit the needs of IT professionals and network administrators seeking a comprehensive solution for temperature and CPU monitoring.
5. Open Hardware Monitor
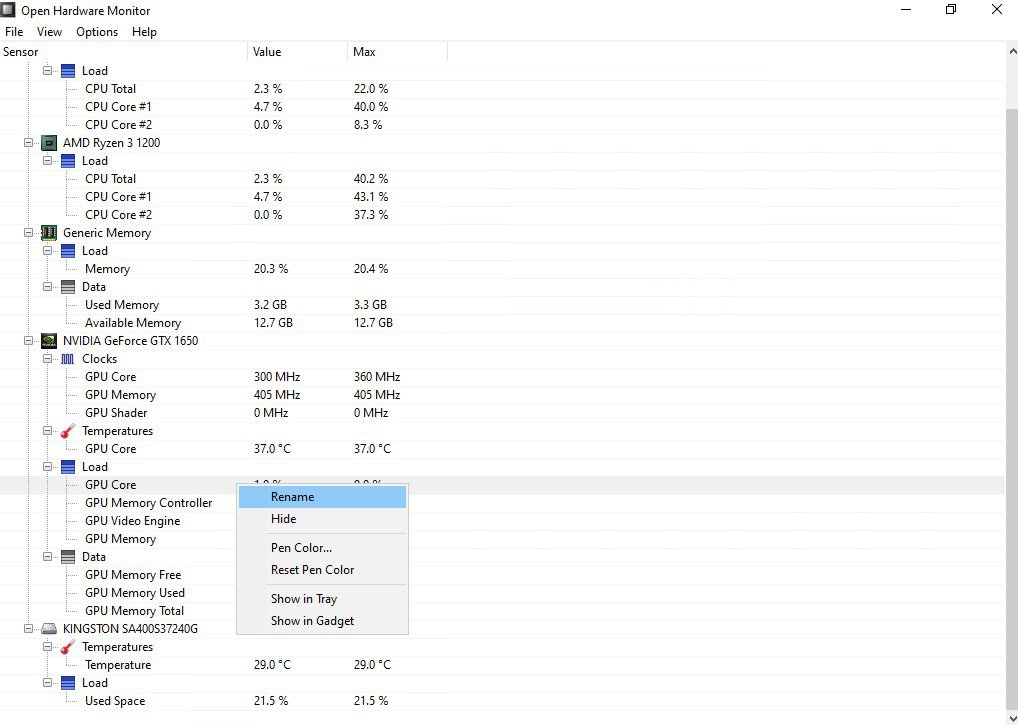
Open Hardware Monitor is a free, open-source hardware monitoring tool that helps you with monitoring your devices’ fan speed, total load, voltage, clock speed, and temperature. OHM supports a variety of different hardware chips, making it an easy fit in many different environments. In addition, its UI will show you the data it’s getting from its sensors as a list, making it easy to sift through them.
Main Features
- OHM is free and open-source
- It has a large community ready to help you with customizing it to your needs
- Ideal for home devices, SMBs, and PC enthusiasts
- Measures a variety of metrics like fan speed, clock speed, and many others
Why do we recommend it?
In our evaluation, Open Hardware Monitor (OHM) stood out as a valuable free and open-source hardware monitoring tool with an engaged community. While it excelled in monitoring metrics like fan speed, voltage, and temperature, its simplicity and suitability for home devices and SMBs were evident. However, limitations in scalability and the absence of a centralized management console make it more suitable for smaller environments.
Who is it recommended for?
Open Hardware Monitor is recommended for home users and SMBs using Windows devices who seek a free and open-source solution for monitoring hardware metrics. Its ease of use and community support make it accessible for individuals and smaller businesses. OHM’s focus on essential metrics aligns well with the needs of users without extensive technical expertise, making it a practical choice for those prioritizing simplicity in monitoring solutions.
6. HWMonitor
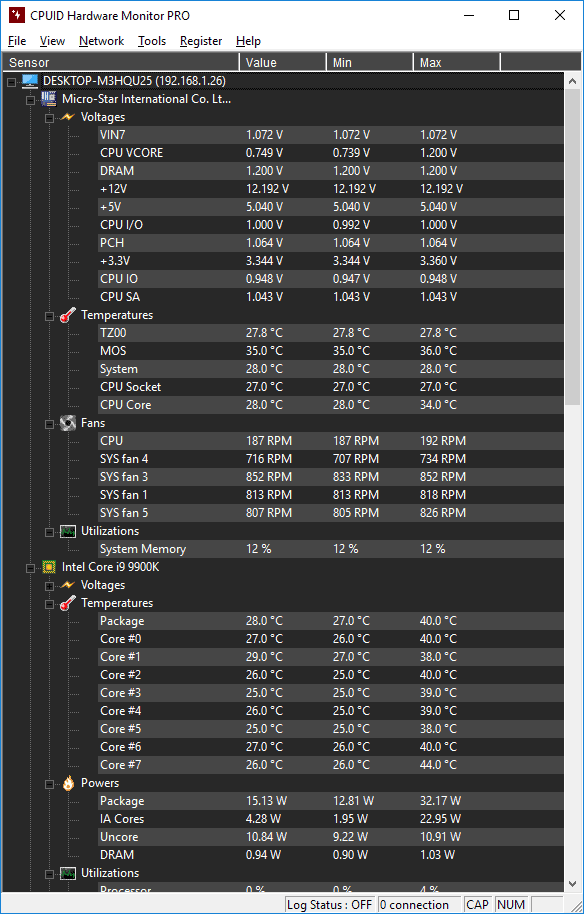
HWMonitor is a monitoring tool to help you monitor your devices’ temperatures, fan speeds, loads, and voltages. HWMonitor will monitor not just the CPU but also the HDD and GPU. The metrics that this tool provides can give you an excellent representation of the state of your device.
Main Features
- The base version of the tool is available entirely free of charge
- It’s a great pick for home networks and SMBs
- Available on Linux and Windows devices
- Monitors a variety of different factors
- The paid version gives you access to different views
Why do we recommend it?
During our assessment, HWMonitor emerged as an excellent free tool for SMBs, providing essential features with low technical knowledge requirements. Its capacity to monitor temperatures, fan speeds, loads, and voltages, covering not just the CPU but also the HDD and GPU, addressed our need for a comprehensive device status overview.
The HWMonitor has a paid version called HWMonitor PRO, priced at $22,10 for ten connections and $38,71 for 20 connections. The paid version provides remote monitoring, multi-device monitoring, and a variety of different perspectives for you to look at your data with.
With that being said, it doesn’t have much in the way of interface customization, so you might have to spend some time sifting through factors you don’t care too much about.
Who is it recommended for?
HWMonitor is recommended for small and medium-sized businesses seeking a free monitoring tool with a focus on simplicity. Its compatibility with Linux and Windows and the ability to monitor various hardware elements cater to users without extensive technical expertise.
The tool’s effectiveness in providing a quick overview of device status makes it suitable for businesses prioritizing ease of use and essential monitoring capabilities.
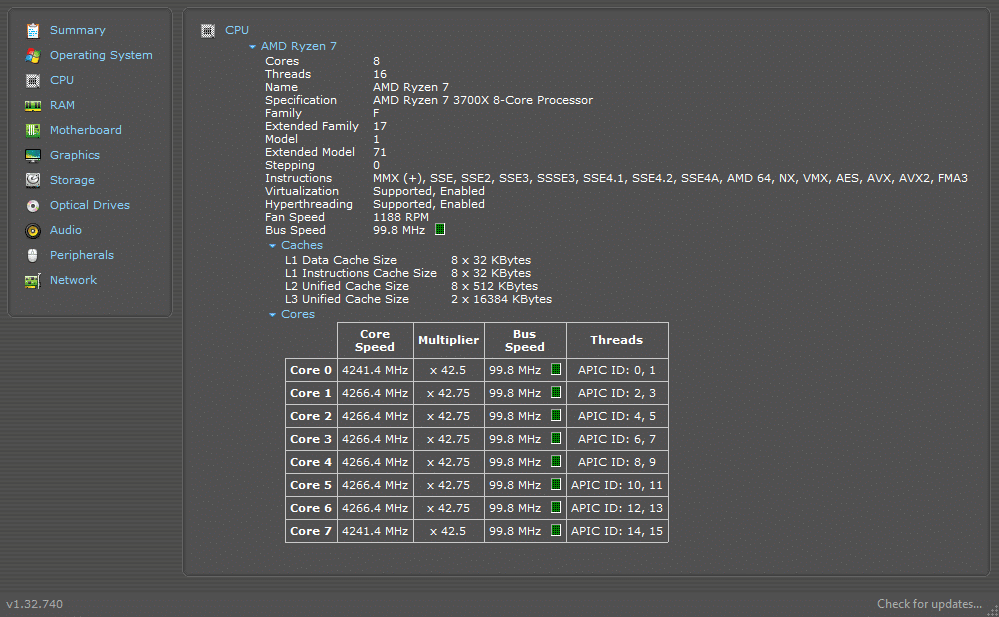
7. Core Temp
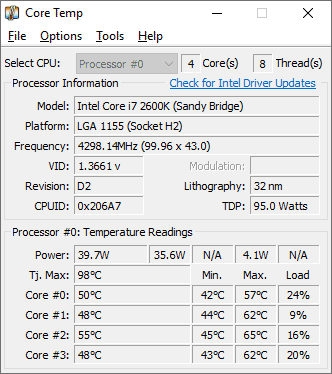
Core Temp is a real-time temperature monitoring tool made for AMD, Intel, and VIA processors. It uses data from the DTS(Digital Thermal Sensor) available in each processing core. Core Temp then collects and shows you the data on an intuitive dashboard.
Main Features
- Support for both Android and iOS phones
- Entirely free of charge for personal use
- Very lightweight and efficient due to its simple interface
Why do we recommend Core Temp?
Core Temp, designed for AMD, Intel, and VIA processors, proved to be a real-time temperature monitoring tool during our evaluation. Its support for real-time monitoring through phone apps and various add-ons for customization addressed our need for flexibility. While lacking in built-in alerting features, Core Temp’s lightweight and efficient interface provided valuable insights into processor temperatures.
There are various add-ons for Core Temp to help you customize it and give it more abilities. The Monitor App addon gives you the ability to monitor devices through your phone, for example.
While those are some powerful pros, Core Temp relies on add-ons to get any visuals at all. The tool is also devoid of any alerting features.
Who is it recommended for?
Core Temp is recommended for individuals and enthusiasts seeking a free, lightweight solution for real-time temperature monitoring. Its compatibility with AMD, Intel, and VIA processors, along with support for phone monitoring, caters to users prioritizing simplicity and flexibility. The tool’s efficiency in providing real-time data makes it suitable for personal use without the need for advanced features or extensive customization.
8. HWiNFO
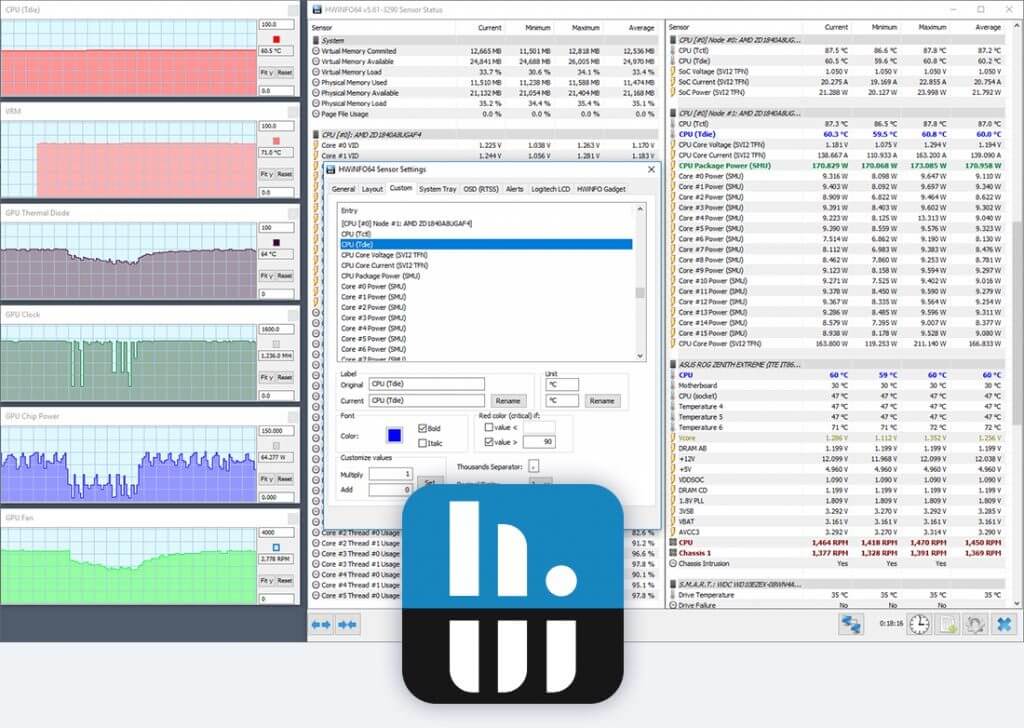
HWiNFO offers you real-time system and temperature monitoring for Windows devices. HWiNFO makes monitoring simple hardware elements such as motherboards, CPUs, HDDs, and such a breeze. It has a straightforward and easy-to-navigate UI while still allowing you to view more in-depth data if you want to.
Main Features
- You can customize simple UI to give you unique metrics like clock speed per CPU core, cache size, and other rarely looked at metrics
- Fully customizable with a variety of addons
- Built-in customization capabilities
Why do we recommend it?
During our evaluation, HWiNFO demonstrated its strength in providing real-time system and temperature monitoring for Windows devices. The tool’s customizable interface, allowing unique metric displays and compatibility with various add-ons, addressed our need for detailed insights. While it may not offer features surpassing the SolarWinds CPU Load Monitor, HWiNFO stands out as a valuable free solution for enterprises, offering in-depth data and customization options.
Its customizable alerts system helps you react to overheating and performance issues on the fly, with add-ons helping you bolster its monitoring capabilities. If you want to specialize in the tool to monitor heat in your devices, you can do that.
Who is it recommended for?
HWiNFO is recommended for enterprises seeking a free and customizable solution for real-time system and temperature monitoring on Windows devices. Its ability to provide detailed metrics, including rarely looked-at factors like clock speed per CPU core, caters to users who require in-depth hardware insights. While it may be less intuitive for non-technical users, HWiNFO’s capabilities make it a valuable tool for those looking to analyze and monitor their devices extensively.
9. Speecy
Speecy is a quick and lightweight tool to provide PC monitoring. It’ll give you a variety of advanced metrics that you can look at. Its paid version provides you with updates and priority support as well.
Main Features
- In-depth reporting gives you highly detailed info about your hardware
- Temperature monitoring in real-time
- You can have the results of a Speecy scan exported as an XML, text file, or snapshot, making it easy to share results
- Its basic version is free.
Why do we recommend it?
Speccy emerged as a quick and lightweight tool for PC monitoring during our testing. Its in-depth reporting and real-time temperature monitoring capabilities, available in both free and paid versions, addressed our need for detailed hardware information. The tool’s historical data analysis through comprehensive logs made it valuable for revisiting past performance metrics and identifying trends.
Speccy is great at revisiting historical data due to the in-depth logs that it takes. You can look at a quick summary of your metrics, or you can delve deep.
Who is it recommended for?
Speccy is recommended for users seeking a quick and lightweight tool for PC monitoring, providing detailed hardware information and real-time temperature monitoring. The tool’s free version, coupled with its ability to export results in various formats, caters to individuals and small businesses. While its visuals and versatility may have limitations, Speccy’s affordability and historical data analysis make it a practical choice for users prioritizing essential monitoring features.
Pricing: The pro version of Speecy is available at $19.95 per year.
10. SolarWinds CPU Monitor
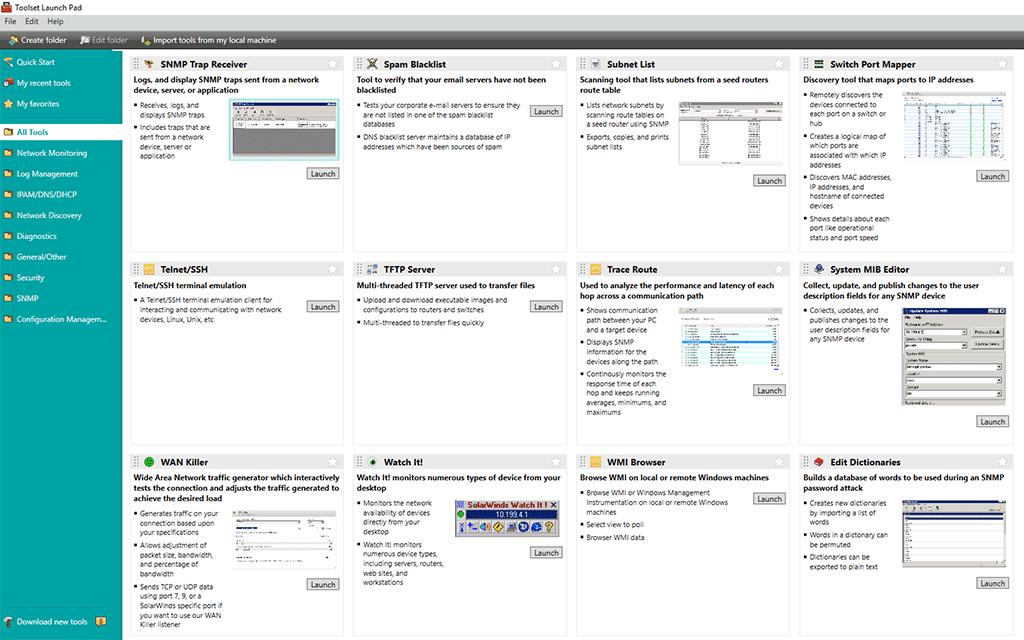
The SolarWinds CPU Monitor is set up as part of their Engineer’s Toolset. This is a set of over 60 different monitoring tools and sys management utilities. This CPU monitor tracks more than just heat in CPUs, and it follows a variety of devices to ensure that their hardware does not get overloaded in any way.
Main Features
- Uses a straightforward yet effective alerts system to help you monitor temperatures more proactively
- Only a part of a more extensive toolset made to help technicians in making their networks more secure
- Automatically finds all devices on your network
- Uses accurate measures of load for any PC, Server, or Server Host
- Made by the reputable SolarWinds company, guaranteeing quality
- Extremely scalable, it will work in all firms from an SMB to a large enterprise
Why do we recommend it?
In our rigorous testing, SolarWinds CPU Monitor, part of the comprehensive Engineer’s Toolset, proved its worth by monitoring devices down to intricate details, offering an intuitive GUI for data presentation. Despite lacking a dedicated heat monitor, its CPU Monitor efficiently tracked CPU usage and other vital statistics, providing a holistic view of potential hardware overloads. The sophisticated alert system ensured proactive issue resolution, preventing device damage and downtime. During our trial, it successfully created an inventory of all network devices, allowing for seamless tracking of CPU usage and related metrics.
Many people have a primary concern when they first look at the SolarWinds because it doesn’t feature a dedicated heat monitor. So, how can a piece of software that doesn’t have a direct temperature metric be the best temperature monitoring software out there?
You see, heat isn’t generated out of anywhere. Overheating only really happens when the devices in question are overloaded, and their functions are being overused. The tool packs a CPU Monitor to track these factors and alert you if it’s overloaded.
At first, the tool will look through your network to create an inventory of all devices within it. Once it has automatically discovered them, all of these devices will be tracked CPU usage CPU monitor’s dashboard. You’ll also see interface statistics and how memory is utilized. This means that all of the parts within a device that can overheat are under constant watch.
There are automatic thresholds set on all performance statuses that will alert you if they’re crossed. Naturally, you can customize these thresholds to whatever values suit your company. Once a factor has crossed the threshold, you’ll be alerted on the dashboard, and anyone whose email/phone you set up to get an alert will get one too. A benefit of this is that you don’t have to pay technicians to sit around and watch the dashboard the whole day. Instead, they only need to be alerted once thresholds are met.
Who is it recommended for?
This tool is recommended for businesses of all sizes, from SMBs to large enterprises, seeking a part of a broader toolset designed to enhance network security. Network administrators and IT professionals can benefit from its scalability and precise monitoring capabilities, ensuring optimal device performance. The tool’s automatic discovery of devices and customizable alert thresholds make it suitable for both beginners and experienced users concerned about device overheating and performance issues.
The CPU Monitor is available from SolarWinds within the Engineer’s Toolset on a 14-day free trial.
Temperature Monitoring FAQ
What Can I Do To See My CPU Temperature?
It’s unlikely that your operating system contains a default way to monitor the temperature. To get to your CPU temperature manually, you’d have to scour through the BIOS. Instead of this, most opt to simply get a temperature monitoring tool, as there are some excellent tools out there(even if you’re looking for freeware)
What Is A Normal CPU Temperature
During very active use, it’s normal for a PC to reach up to 70-75 degrees Celsius. On the other hand, an idle PC should be at around 45 degrees. A high temperature implies that there’s a lot of background tasks running. Alternatively, you might be having issues with your fan.
Why Am I Not Getting A Temperature Reading?
If your temperature monitoring tool isn’t giving you a reading, the most likely cause is that the tool is incompatible with your CPU’s temperature gauge’s output mechanisms. Looking for a different tool that’s compatible is the most common solution.
Is It Possible For Readings To Be Faulty?
Like with all things, it’s always possible for a reading to be inaccurate. This happens when one of the many factors that go into determining the temperature correctly goes wrong. To find these, you should look for illogical outcomes. An example of this is if your CPU isn’t registering any activity, the fan is working, but the monitor says that you’ve got overheating issues.
Wrapping Up
Having temperature monitoring solutions can alleviate many problems with running large server rooms, office spaces, or even home computers. Avoiding a crash is crucial for day-to-day operations, so having a quality tool that will alert you if something goes wrong.
As always, the most crucial factor is your needs. Our number 5 pick might be your first pick if you’re looking for the specific features it offers. However, always keep your needs in mind, and use lists only as a guideline.
Did we miss your favorite temperature monitoring tool?
What is the essential feature to have, in your opinion?