
Getting the best Linux monitoring software and tools for your network is critical in its function. Today, we’ll be looking at all of the best software you can use to manage and monitor a variety of different Linux distros.
Although Windows is the most popular OS for running servers, there’s a good number of Linux servers around the globe. Much like any Windows server, your Linux infrastructure needs to be closely monitored to ensure its timely uptime.
Here’s our list of the best Linux monitoring and software tools:
- Site24x7 – FREE TRIAL A cloud-based solution giving you access to a variety of functionalities in one tool. Access a 30-day free trial.
- ManageEngine OpManager – FREE TRIAL A tool that mostly excels in its simplicity and graphical solutions. Download a 30-day free trial.
- Paessler PRTG Network Monitor – FREE TRIAL A sensor-based solution offering quick overviews and detailed analysis when you need it. Download a 30-day free trial.
- ManageEngine EventLog Analyzer – FREE TRIAL A log analysis tool for Windows, Linux, and cloud systems to support investigation and compliance. Download a 30-day free trial.
- Datadog Linux Monitoring A purely cloud-based tool capable of integrating multiple OS without a hitch.
- Zabbix A free tool with robust analysis and encrypting functionalities.
- Nagios Core An open-source solution offering boundless customization if your team has the skills.
- SolarWinds NetFlow Traffic Analyzer This tool offers a sleek UI, unified traffic view, and advanced root cause detection.
The Best Linux Monitoring Tools
1. Site24x7 Linux Monitoring – FREE TRIAL
Site24x7 is another cloud-based system to monitor your network’s performance. It is a much wider tool, monitoring every IT service that has some user-facing software. So you can monitor your servers, networks, apps, and more. With that being said, the tool does require an on-site agent to be installed as well.
Main Features:
- You can monitor Linux, Windows, and cloud servers simultaneously
- VMWare and Hyper-V monitoring visualizations
- A stack-based visualization of applications showing all of their dependencies and resource use
- Online customizable console
System Requirements:
- 2GHZ Processor
- 8GB RAM
- 80GB HDD
Why do we recommend it?
In our testing, Site24x7 impressed as a cloud-based solution offering comprehensive monitoring for various IT services. The tool’s stack-based visualization of applications and customizable console provided a holistic view of network performance. It solved the challenge of monitoring diverse aspects of the network in one intuitive package.
This tool supports a vast array of Linux distros, as well as some more esoteric OS such as the Raspberry Pi OS. This makes it excellent for hobbyist and semi-professional use.
If you’re looking for a tool that helps you monitor a variety of different aspects of your network in one intuitive package, then Site24x7 might be the tool for you. Its biggest downside is that it can be a bit confusing at times with all of the things on display.
Who is it recommended for?
Site24x7 is recommended for businesses and individuals seeking a versatile tool for monitoring servers, networks, and applications. Its cloud-based nature and support for multiple Linux distros make it suitable for a range of users, from hobbyists to semi-professionals.
Pricing: Site24x7 packages start at just $9 per month. Get started with a 30-day free trial.
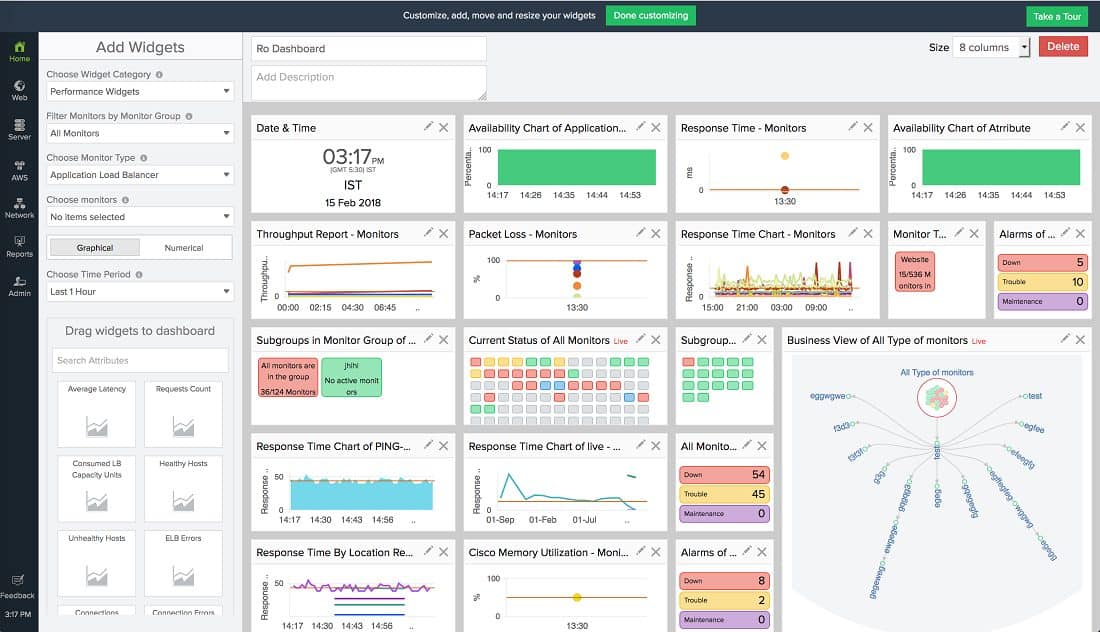
2. ManageEngine OpManager – FREE TRIAL
The ManageEngine OpManager is one of the most popular tools to help you manage Linux Servers and Network devices. Its main standout feature is the excellence of its dashboard and GUI.
Main Features:
- Excellent notification and alarm system
- Clever and intuitive GUI that makes navigating the tool a breeze
- Customizable dashboards that allow you to look at your infrastructure from multiple angles
- Hardware monitoring capacities
- Automatic device discovery, and automatic system discovery on the network
System Requirements:
- Intel Xeon 3.5 GHz 4 cores/8 threads or higher processor
- CPUs with a total combined PassMark score of 7,000 or higher
- 16GB Memory
- 40GB HDD
Why do we recommend it?
OpManager stood out during testing for its excellent dashboard and GUI, simplifying the management of Linux servers and network devices. The tool’s alerting system and 3D Racks view enhanced real-time monitoring. It efficiently addressed the challenge of managing intricate factors in even the most complicated Linux systems, ensuring 24/7 network protection.
You can monitor a variety of intricate factors, and even the most complicated Linux system won’t present a challenge to it. ManageEngine OpManager is a widely known tool for managing your Linux Servers and Network devices from a centralized dashboard!
The OpManager comes with endless features to help you protect and monitor your network 24/7. For example, its intricate Alerting systems will help you get notified of any suspicious activity in real-time. Another unique feature is its 3D Racks view capabilities which help you visualize the circumstances on your system more easily.
Who is it recommended for?
ManageEngine OpManager is recommended for businesses relying on Linux servers and network devices. Its intuitive GUI, customizable dashboards, and hardware monitoring capabilities make it suitable for efficiently managing complex Linux infrastructures. The tool caters to diverse industries, ensuring robust network monitoring.
Pricing: It varies, you can request a personalized demo of the system and/or start a 30-day free trial.
3. Paessler PRTG Network Monitor – FREE TRIAL
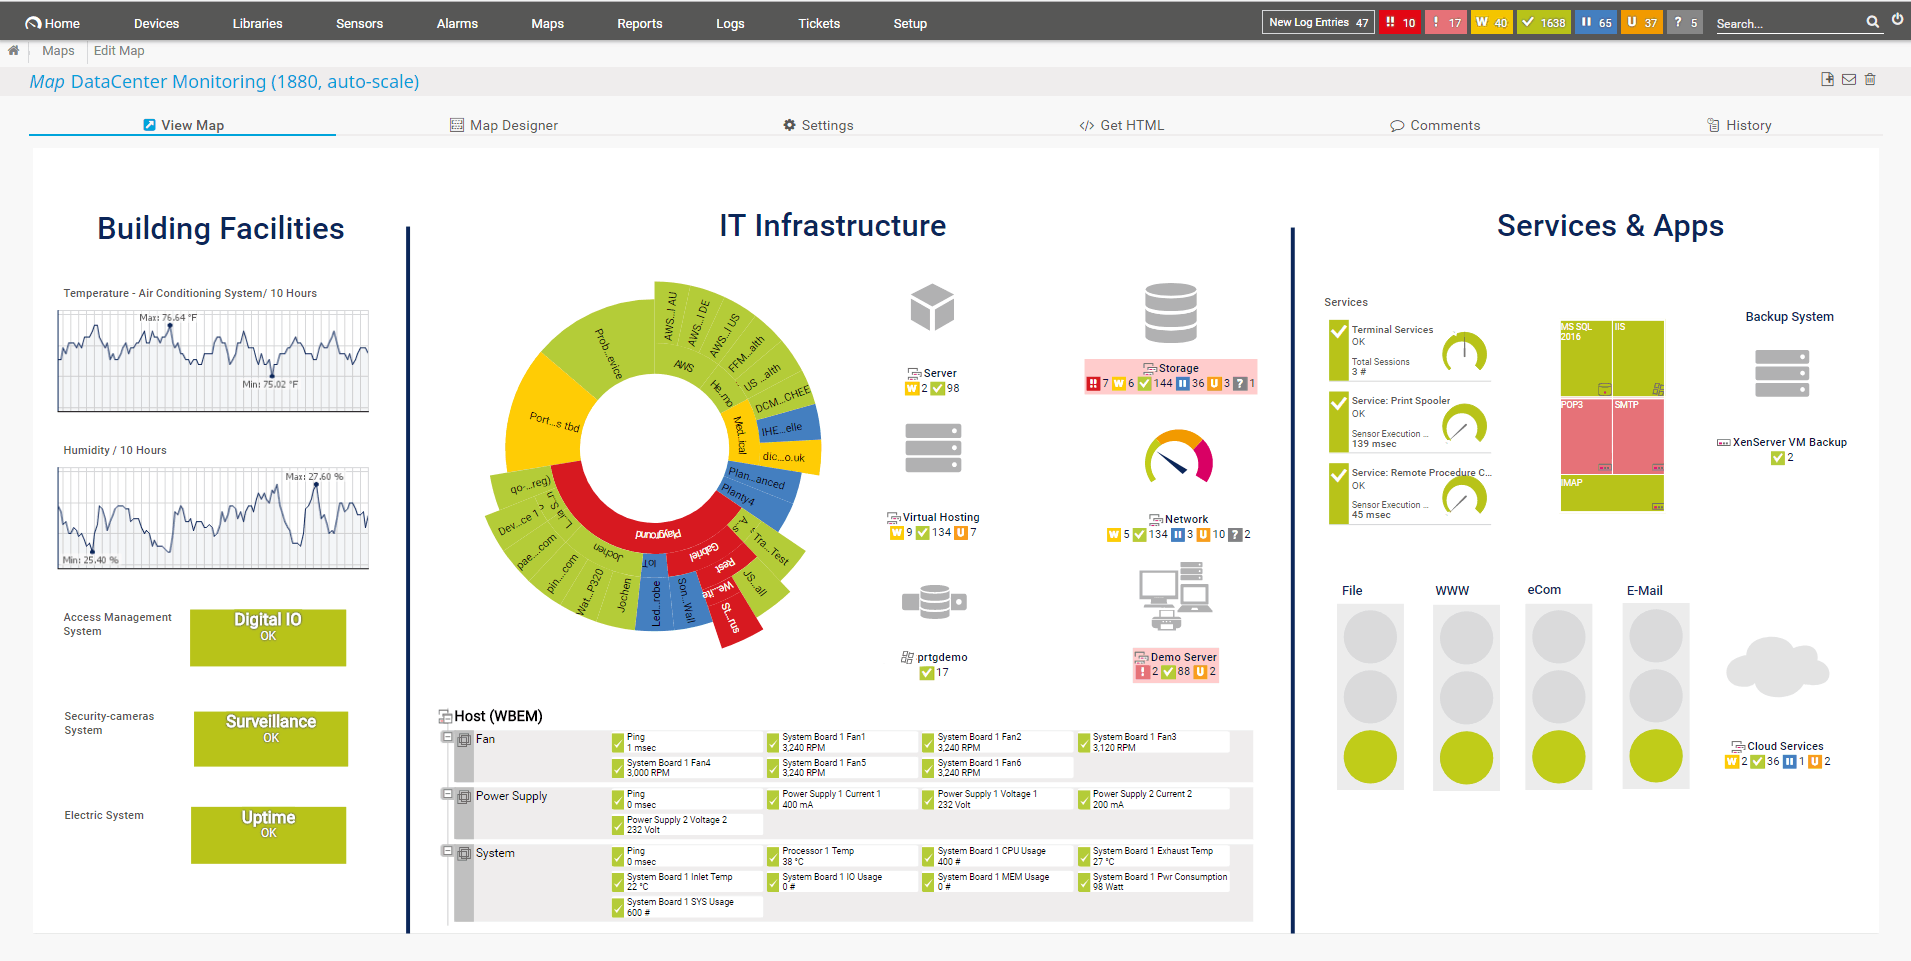
The PRTG Network Monitor made by the Paessler company is a monitoring tool prioritizing stability above all else. It’ll give you both a quick overview of your network in addition to giving you a detailed outlook of your device’s performance if you so desire.
Main Features:
- Helps you quickly look at weak points and imbalances within your network
- Excellent tracking system helping you keep up with unusual traffic and incidents
- Quick and simple to install
- A variety of available languages, excellent for non-English companies
Why do we recommend it?
PRTG Network Monitor, prioritizing stability, offered a quick overview and detailed performance analysis during our testing. Its sensor-based system efficiently monitored Linux systems, including load average, RAM, and HDD space. The tool’s tracking system and language options provided flexibility, solving the challenge of identifying our network’s weak points and imbalances.
The way the PRTG works is rooted in its intricate sensor system. Every sensor pays attention to a specific data type and tracks information about a specific part of your network. The most popular sensors to use for Linux monitoring are as follows:
- The Load Average Sensor: Tasked with monitoring the average load of your system by using SSH and SNMP
- The Meminfo Sensor: Tasked with monitoring the RAM available
- The SNMP Traffic Sensor: Tasked with monitoring device traffic with SNMP
- The Disk Free Sensor: Tasked with looking at the HDD space available
Who is it recommended for?
Paessler PRTG Network Monitor is recommended for businesses prioritizing stability in network monitoring. Its sensor-based approach and customizable language options make it suitable for users requiring a detailed outlook of Linux system performance. The tool’s free version with up to 100 sensors is an attractive option for smaller setups.
Pricing: The price of the PRTG Network Monitor depends on the number of sensors you need. Up to 100 is free of charge, 500 sensors will set you back $1600, going up to $10,500 for 5000 sensors.
There are also two different packages giving you unlimited sensors. The XL1 lets you get unlimited sensors at one core installation for $14,500, while the XL5 does this for five core installations at $60,000.
These prices come with one year of maintenance, with yearly renewals costing you 25% of the price.
This tool also features a 30-day free trial.
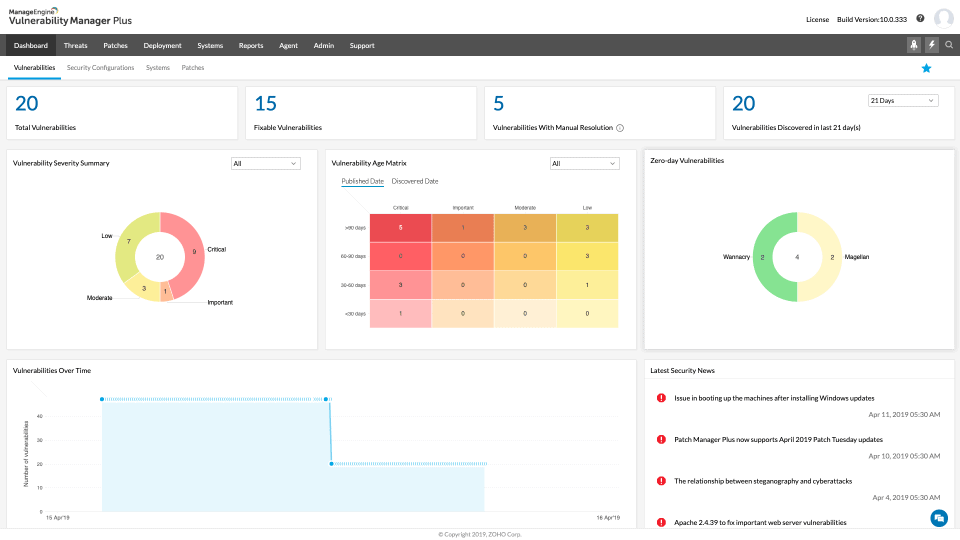
4. ManageEngine EventLog Analyzer – FREE TRIAL
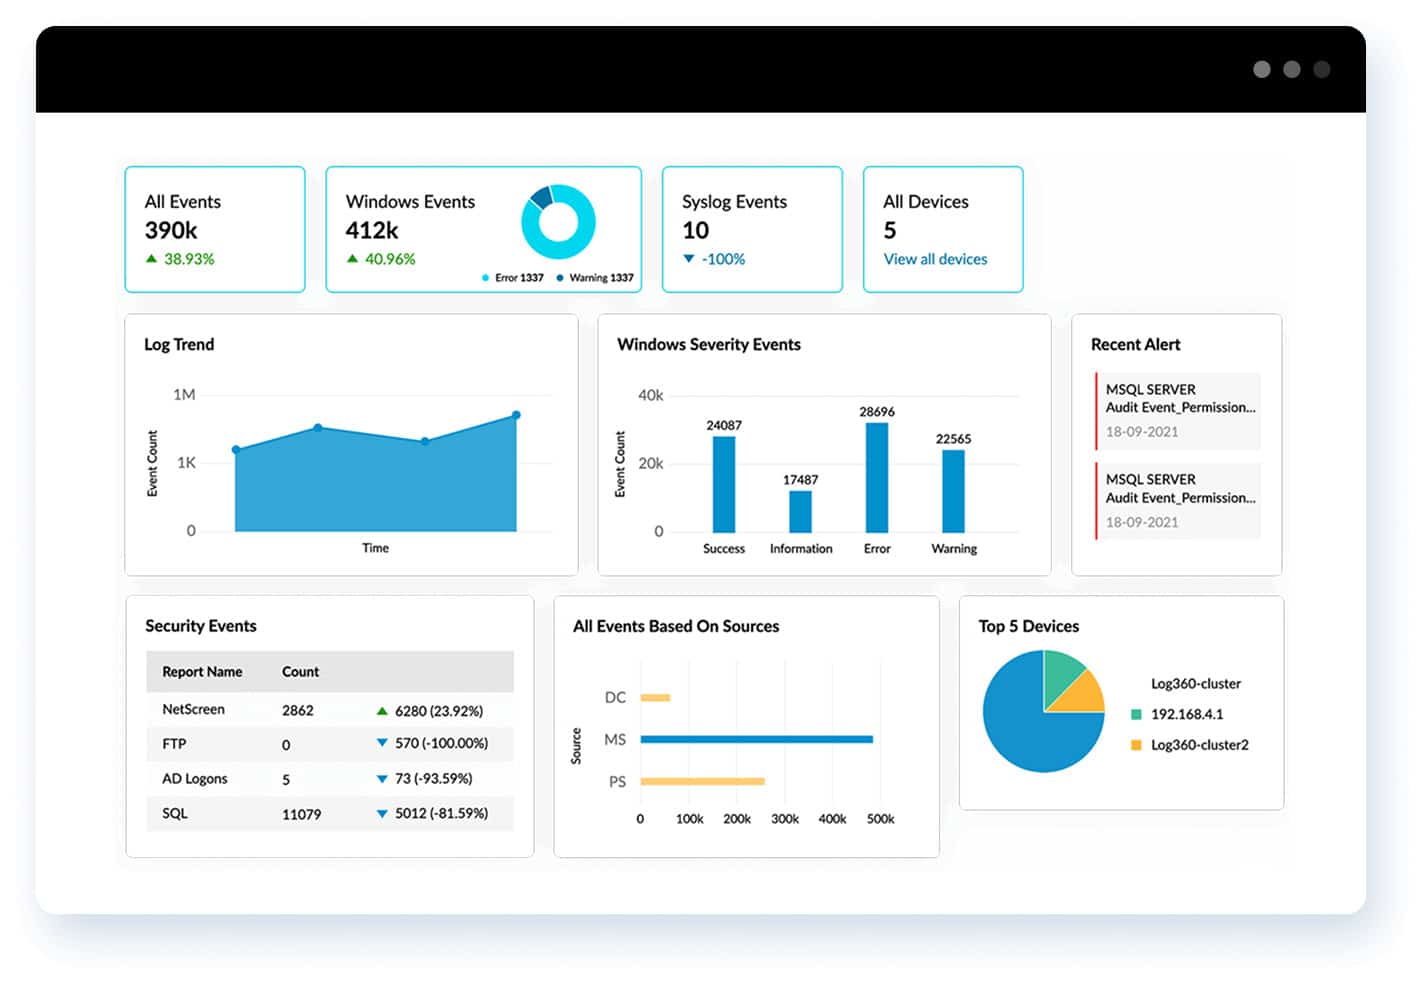
ManageEngine EventLog Analyzer is a log analysis and viewer tool designed for Windows, Linux, and cloud environments. It simplifies log analysis by supporting 700+ log formats right out of the box. As a result, logs from most devices are standardized and analyzed to identify issues in the Linux environments. It even provides actionable insights for fixing the identified issues.
Key Features:
- Comes with intuitive dashboards, alert profiles, and predefined report templates to get started right away.
- Supports more than 700 log formats.
- Offers automated incident response that act as a first line of defense or remediation.
- Ensures compliance with many leading frameworks.
- Enables forensic analysis for further investigations.
Why do we recommend it?
We recommend this tool because it simplifies log analysis and enables you to better understand the state of your Linux systems and networks. Its prebuilt profiles support instant alerting while the results are displayed on intuitive dashboards for easy understanding and taking further action. Its reporting templates help with meeting compliance requirements as well.
It also comes with automated incident response workflows that can take specific actions when triggered by predefined events. With these features, it can safeguard your networks from potential attacks.
Who is it recommended for?
It is recommended for organizations that run on Linux systems, as well as environments that have both Windows and Linux systems. It is helpful for network security teams to quickly understand the root cause of problems for immediate action.
EventLog Analyzer is priced at $795 per year. There is also a free edition that supports up to five log sources.
Download a 30-day free trial.
5. Datadog Linux Monitoring
Datadog is a famous server and application monitoring tool specializing in mapping out the devices supporting a UI including the server operating system.
Main Features:
- Monitoring of virtualization in addition to container activity
- The capability of monitoring the support infrastructure of databases and Web servers
- You can view your network from as high of a level as you want down to an individual server
- Excellent dashboard, albeit it can get a bit cluttered at times
- Drag-and-drop customization for your utilities
- Root cause analysis helps you get to the cause of your problems in record time
- 400+ integrations that help you further personalize your monitoring
- Logfile mining
System Requirements: Datadog is a cloud-based tool, so the system requirements are extremely low.
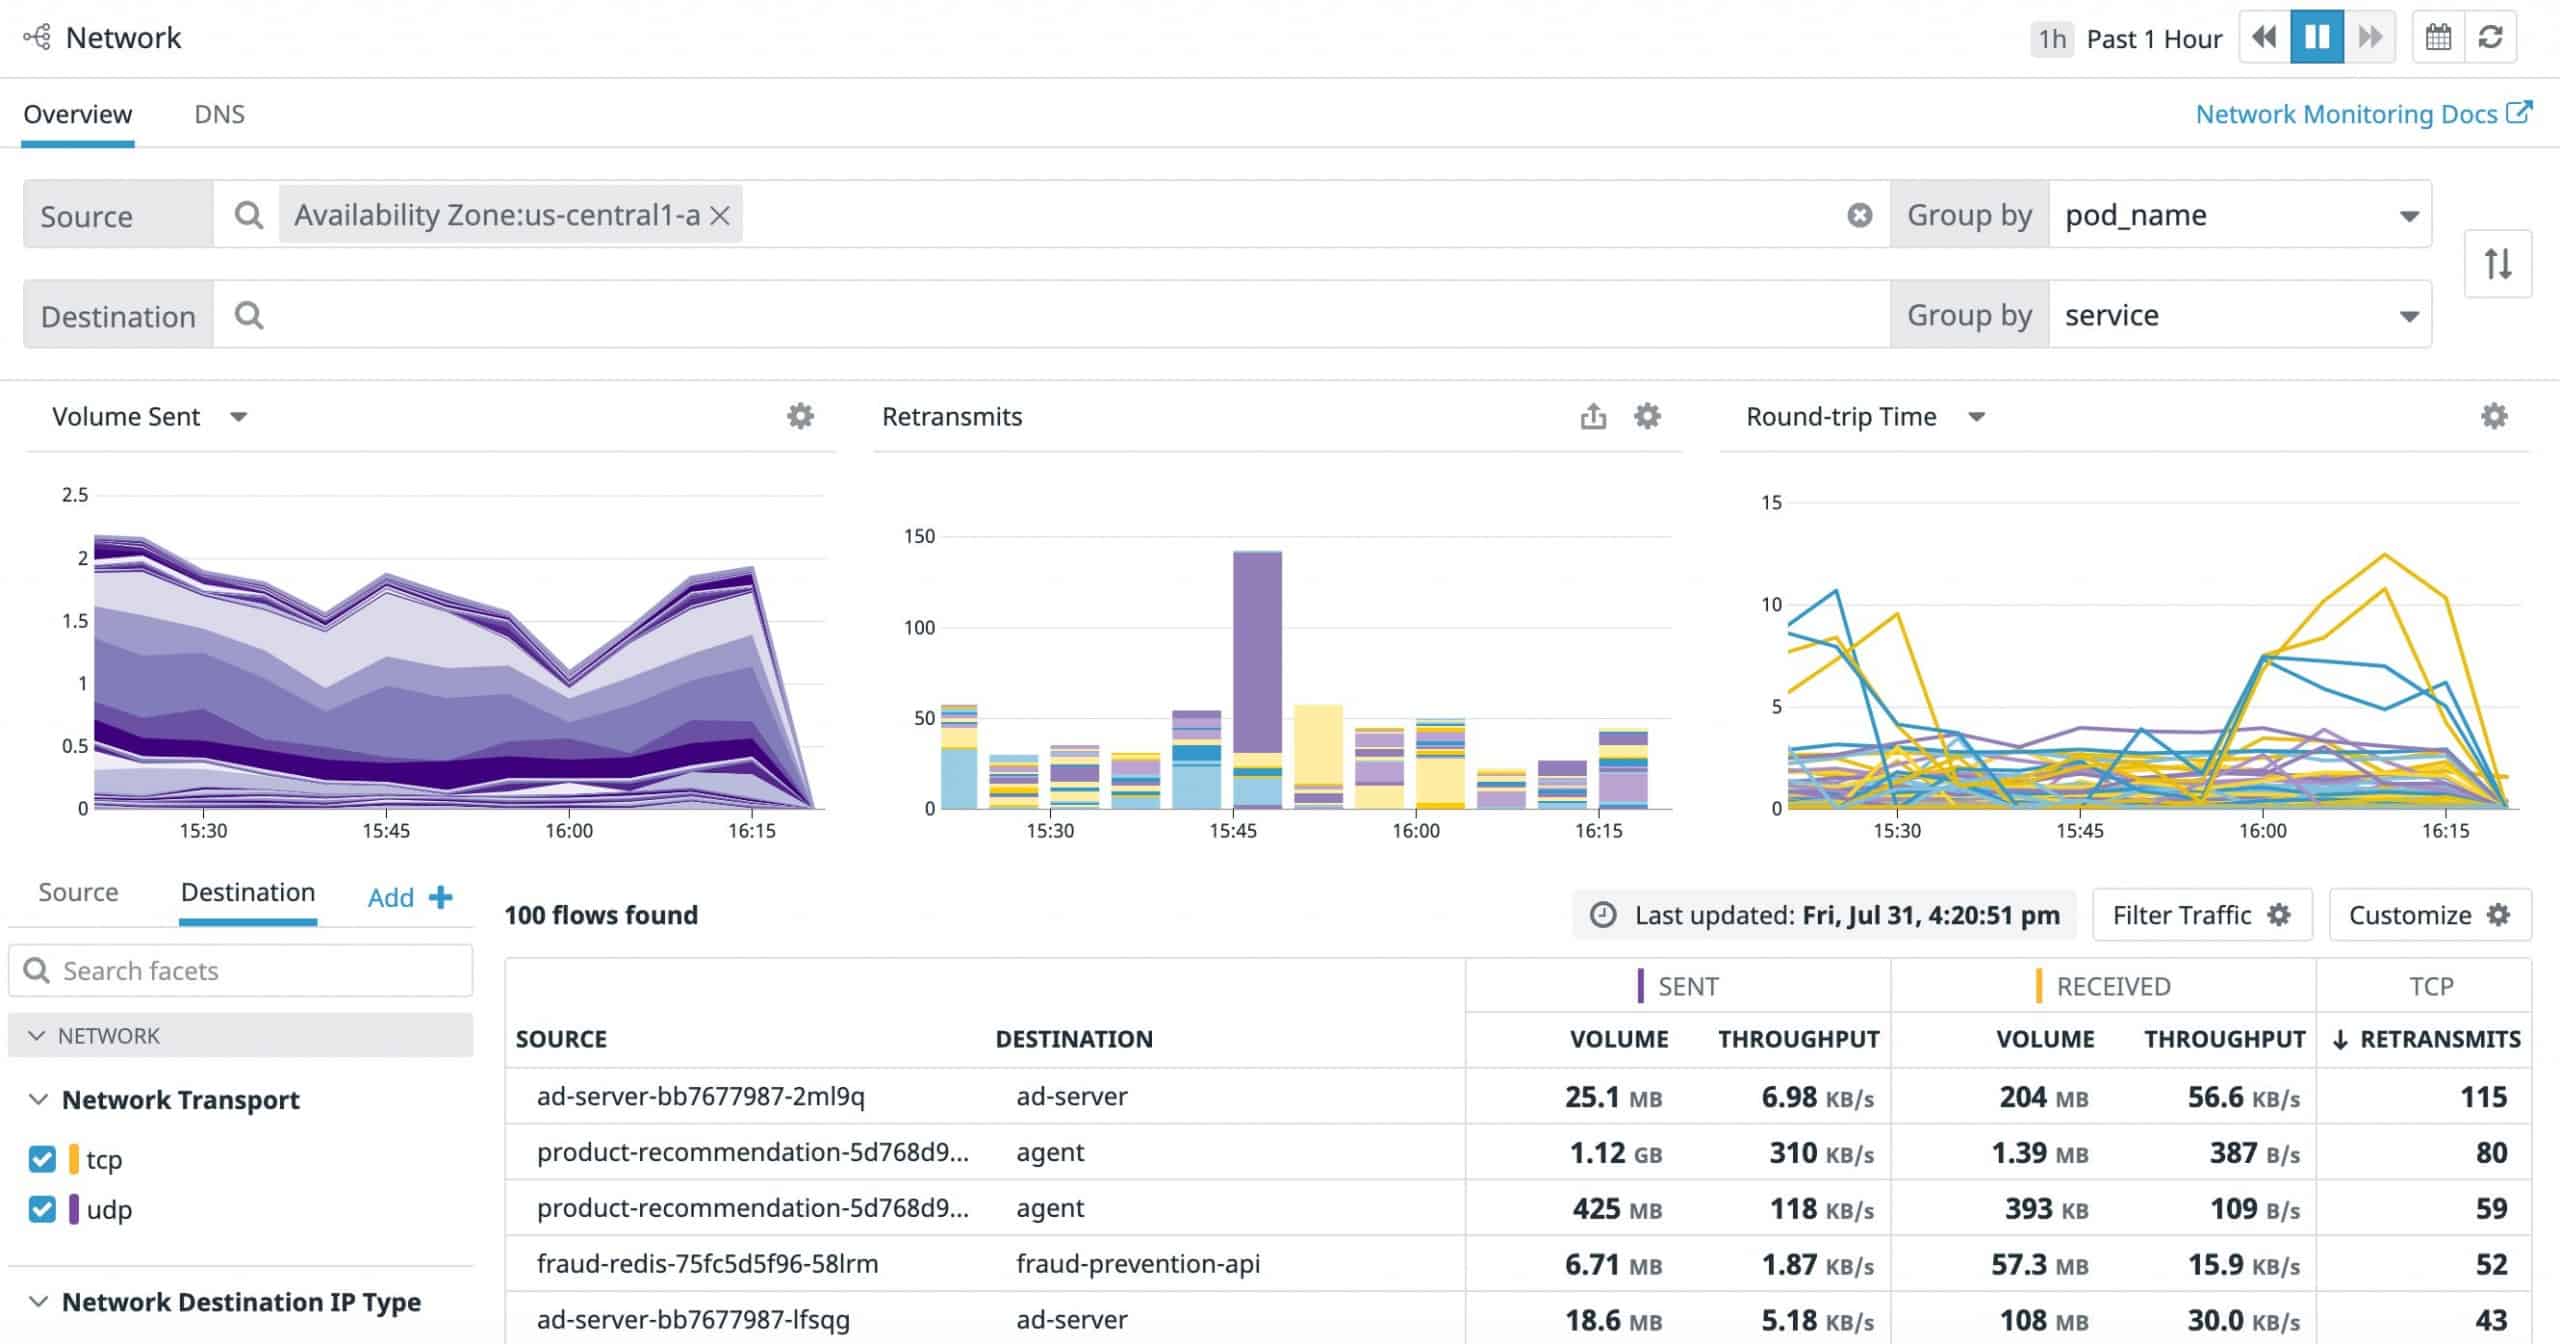
Why do we recommend it?
During our evaluation, Datadog proved to be an excellent cloud-based tool for server and application monitoring. Its capability to integrate multiple operating systems seamlessly, coupled with a user-friendly dashboard, stood out. It addressed the challenge of monitoring diverse server environments, providing root cause analysis for quick issue resolution.
One of its main advantages is being a purely cloud-based system. This leads to its use in a variety of startups around the globe. Another benefit of the cloud infrastructure is the ability to monitor your Linux servers no matter where they are, however, it can still consolidate their monitoring depending on their geographical distribution.
This is also an excellent tool to use if you’re trying to blend multiple OS into one network, as Datadog lets you monitor all of them.
Who is it recommended for?
Datadog is recommended for startups and businesses requiring cloud-based monitoring for servers and applications. Its ability to consolidate monitoring for Linux servers across geographical locations makes it suitable for globally distributed setups. With 400+ integrations, it caters to companies seeking a highly customizable monitoring solution.
Pricing: Datadog offers three distinct pricing options:
- Free: Datadog is free for up to five hosts, and its data retention period in this edition is one day.
- Pro: The Datadog Pro version gives you access to 15 months of data retention, and it’ll set you back $15 a month for each host.
- Enterprise: The Datadog Enterprise version gives you access to AI-based performance thresholds to take your security to the next level, and will set you back $23 a month for each host.
There is also a 14-day free trial.
6. Zabbix
Zabbix is a tool that excels in its scalability. It offers real-time monitoring based on a variety of metrics it analyzes from the devices on your network.
Main Features:
- Excellent third-party integration
- Multi-OS support, you’ll be hard-pressed to find a commonly used Operating System not supported by Zabbix
- You can monitor devices within your network through a firewall or DMZ without a hitch
- Periodic network scans adding new devices to your network map
- Sublime encryption gives you another layer of security and makes Zabbix one of the most secure Linux monitoring tools
- Root cause analysis coupled with the software’s ability to automatically fix some problems means you’ll have more time to focus on the aspects of your network requiring human attention
- Aids with conforming to a variety of industry standards
- Even if your network has issues or fails, Zabbix will keep on collecting data
- It’s completely free, making it a great starting tool for Linux monitoring
System Requirements: Highly dependent on the number of hosts and parameters you want to monitor. However, the baseline is rather low.
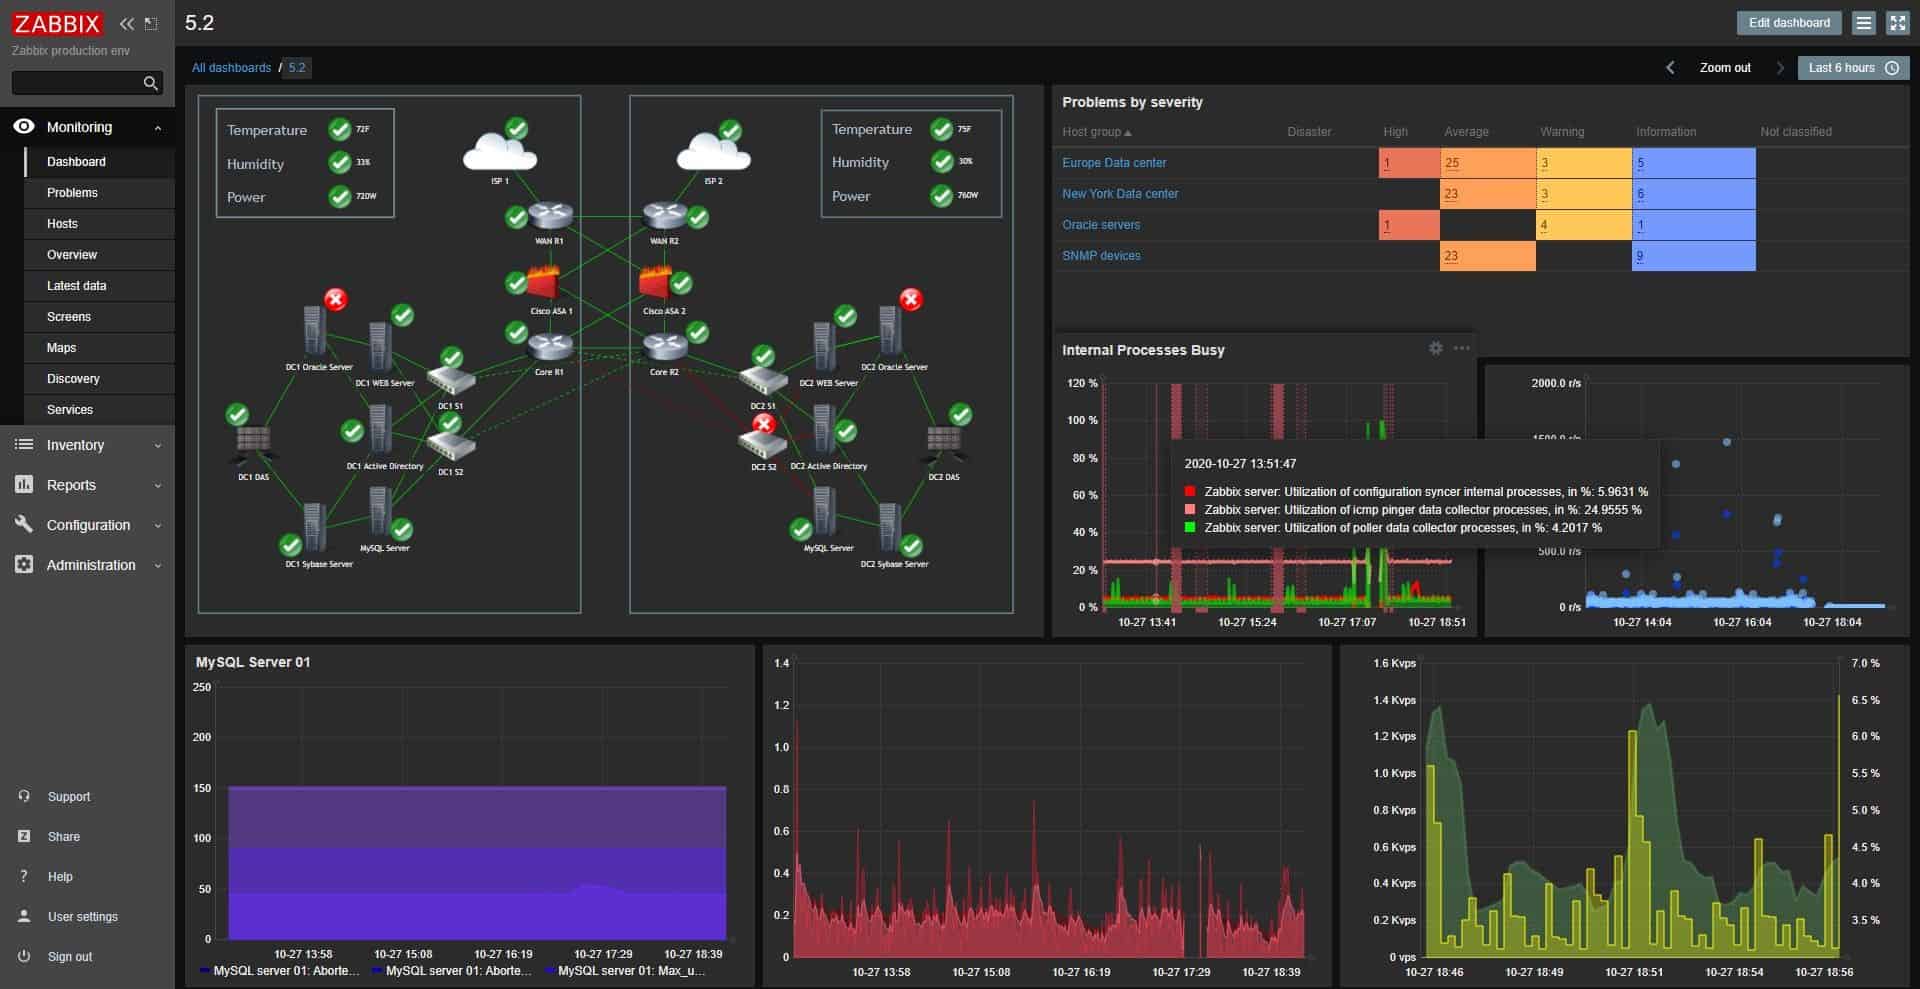
Why do we recommend it?
Zabbix excelled in scalability and real-time monitoring, identifying issues as they occurred. Its flexibility in prioritizing monitoring options and robust root cause analysis made it a promising tool during our testing. Despite some rough edges, it effectively addressed the challenge of monitoring diverse devices within our network.
It’ll spot issues at the time that they come from a device, meaning it isn’t necessary to get a different module to look for problems. Zabbix is also very flexible, helping you prioritize what options you’re most interested in.
Its ability to analyze root causes of issues and detect anomalies in tandem with the different levels of severity you can set makes it an excellent tool for prioritizing different aspects of network security.
It also takes into account past trends on the network, which can help you account for your future needs based on past usage. Although it has graphical and visual representations of your data and infrastructure, some users have found it lacking in some aspects.
If you can ignore some of the software’s rough edges, you’ll find that Zabbix is a very promising Linux monitoring tool, and it’s free to boot.
Who is it recommended for?
Zabbix is recommended for users seeking a scalable and free Linux monitoring tool. Its real-time monitoring capabilities and support for multiple operating systems make it suitable for users with varying network complexities. While accommodating beginners, its depth and customization options make it particularly appealing to experienced cybersecurity professionals.
Pricing: Zabbix is completely free
7. Nagios Core
Nagios Core refers to the monitoring & alerting engine on top of which there have been hundreds of different apps built. It isn’t very well suited for newcomers to the cybersecurity world, as it’s quite a complex tool, however, there are only a couple of tools on this list that could compete with it in robustness.
Main Features:
- Fully customizable system for making your own service checks
- An open-source tool with a vast community
- A variety of different metrics are monitored by the tool at all times
- Easily definable network host hierarchies
- Nagios Core rotates log files at regular time intervals
- Customizable dashboards
- Script APIs that’ll let you monitor remote and local systems alike with precision
- Nagios Core makes taking a centralized look at your infrastructure a breeze
System Requirements:
- Linux or Unix OS with network access
- A-C compiler
- Apache or another webserver
- Thomas Boutell’s gd library version 1.6.3 or above
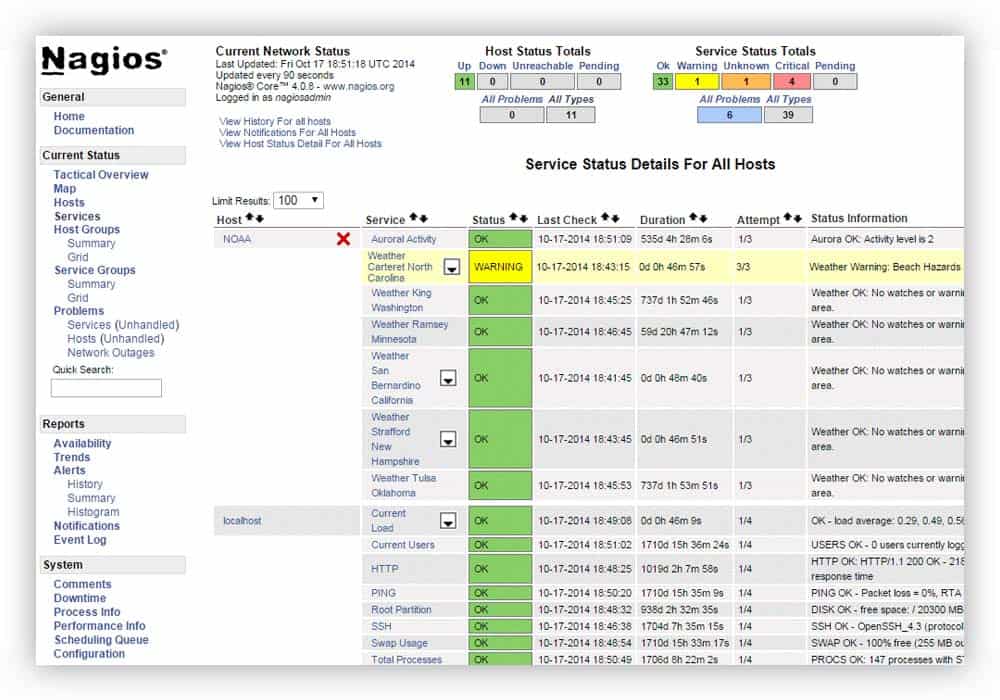
Why do we recommend it?
Nagios Core, as a monitoring and alerting engine, showcased robustness and customization during our evaluation. Although complex, its ability to develop personalized service checks set it apart. It addressed the challenge of providing a centralized look at our network infrastructure, making it a valuable tool in the hands of highly qualified cybersecurity professionals.
One of its standout features is the ability to develop your own service checks. This lets you personalize some aspects of your network security as much as you want. If you’re looking for a challenging tool that can be an amazing solution in the hands of highly qualified cybersecurity professionals, Nagios Core might be the tool for you.
Who is it recommended for?
Nagios Core is recommended for cybersecurity professionals and advanced users seeking a highly customizable monitoring solution. While not ideal for newcomers, its open-source nature and extensive community support make it a powerful tool for in-depth network monitoring. Its customization options cater to businesses with specific security and performance requirements.
Pricing: Open source and hence free to use.
Download: You can download Nagios Core from https://www.nagios.org/downloads/
8. SolarWinds NetFlow Traffic Analyzer
NetFlow Traffic Analyzer comes from SolarWinds, a company known for creating top-of-the-line monitoring tools.
Like most SolarWinds tools, it comes jam-packed with useful features that fit snugly into a tightly designed user interface. It’ll help you find the users and apps consuming the most of your bandwidth, and let you know if that usage goes over your utilization threshold through its robust alert system.
When it comes to Linux monitoring tools, there are few others that can stand toe to toe with the SolarWinds NetFlow Traffic Analyzer.
Main Features:
- You can make your own IP address groups, helping you look at traffic from whichever perspective suits you
- A single-pane view of your whole network traffic
- Root cause detection – The software does a detailed analysis of any problem it detects and points you to its root cause, minimizing troubleshooting time
- Clever and intuitive UI
- Drag-and-drop performance dashboard, letting you place your most important metrics at the forefront so you can see them at a glance
- A variety of different views and formats
- Easy integration with other SolarWinds tools makes it the perfect choice if you’re already using some SolarWinds software
- Simplifies login management through pre-existing Active Directory user profiles
System Requirements:
- Quad-Core CPU with at least 3GHZ
- 16GB+ for the Flow Storage Database, and at least 3GB available for the Main Poller
- A total of 23GB HDD space, 3 for the Main Poller and 20 for the Flow Storage Database
- This tool will run on Windows Server 2008 R2 SP1, 2012 R2, 2012, and most Linux distros
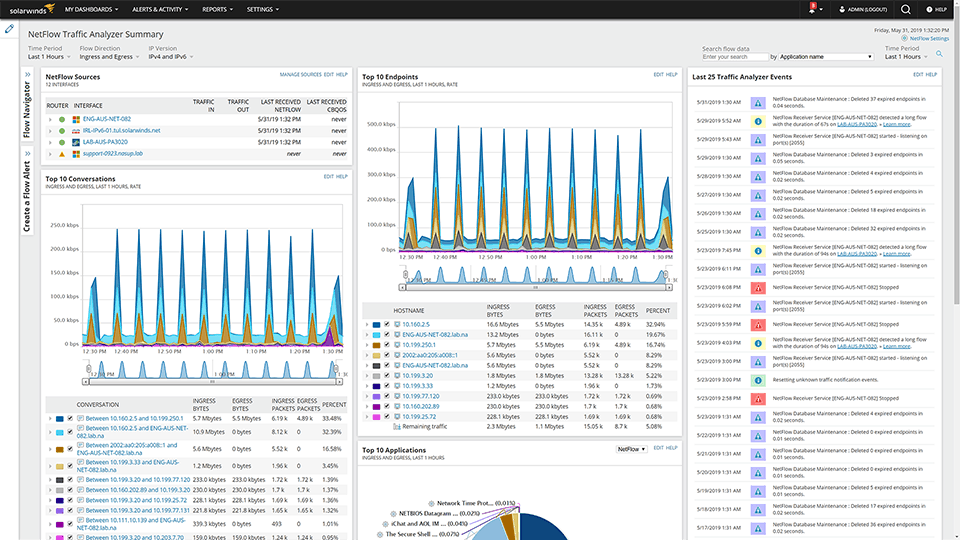
Why do we recommend it?
During our testing, SolarWinds NetFlow Traffic Analyzer emerged as the top choice for Linux network monitoring. With a masterfully crafted UI, it provided a single-pane view of the entire network’s traffic. The root cause detection system efficiently analyzed problems, minimizing troubleshooting time. One key problem it solved for us was identifying users and apps consuming excessive bandwidth, enabling proactive management to ensure optimal network performance.
In addition to all of this, SolarWinds NetFlow Traffic Analyzer lets you look at all of your traffic segmented by Class of Service methods. Furthermore, you can monitor how effective CBQoS policies are. Setting up a customized view of traffic for any number of ISPs helps you understand how your traffic is balanced throughout them.
Who is it recommended for?
This tool is recommended for network administrators and IT professionals managing Linux infrastructures. Its detailed traffic analysis, intuitive UI, and integration with other SolarWinds tools make it suitable for businesses of varying sizes, ensuring efficient bandwidth utilization and quick issue resolution.
Pricing:
The SolarWinds Netflow Traffic Analyzer comes with a 30-day free trial and starts at ~$900 afterward.