
Nagios is a free and open source software application that can be used to Monitor systems, networks and infrastructure.
Nagios alerts you through mail when something goes wrong on your server.
Nagios also offers Network monitoring and alerting services for Monitoring & Managing Servers, switches, applications and services.
Nagios comes with a web-based interface that shows all the information regarding server, switches and firewalls.
Features
- Supports SSH or SSL encrypted tunnels for remote monitoring.
- Monitor different network services like SMTP, POP3, NNTP, ICMP, FTP, SSH and more.
- Monitor different host resources like, Disk usage, System log, CPU load and more.
- Able to monitor the temperature of any hardware.
- Display network status, logs, history through web interface.
In this tutorial, we will learn how to install and configure Nagios Network monitoring tool on Ubuntu 18.04 server.
Requirements
- A server running Ubuntu 18.04.
- A static IP address 192.168.0.100 is configured on Nagios server.
- A static IP address 192.168.0.103 is configured on Nagios client.
- A root password is configured on both server and client.
Getting Started
Before starting, update your system to the latest version by running the following command:
apt-get update -y

apt-get upgrade -y
Once your system is updated, restart the system to apply all the changes.
Install Required Packages
First, you will need to install some packages required to install Nagios to your system. You can install all of them by running the following command:
apt-get install build-essential apache2 php7.2 openssl perl make php7.2-gd libgd-dev libapache2-mod-php7.2 libperl-dev libssl-dev daemon wget apache2-utils unzip -y
Once all the packages are installed, create nagios and nagcmd user to allow the external commands to be executed through the web interface. You can do it with the following command:
useradd nagios

groupadd nagcmd
Next, add Apache and Nagios user to nagcmd group:
usermod -a -G nagcmd nagios

usermod -a -G nagcmd www-data
Install Nagios
First, you will need to download the latest version of Nagios from their official download page.
You can do it with the following WGET command:
wget https://assets.nagios.com/downloads/nagioscore/releases/nagios-4.4.3.tar.gz
Once the download is completed, extract the downloaded file with the following command:
tar -xvzf nagios-4.4.3.tar.gz
Next, change the directory to nagios-4.4.3 and compile Nagios from source with the following command:
cd nagios-4.4.3

./configure --with-nagios-group=nagios --with-command-group=nagcmd --with-httpd_conf=/etc/apache2/sites-enabled/

make all

make install

make install-init

make install-config

make install-commandmode
Next, open Nagios default configuration file and change the email address that you would like to use for receiving alerts.
nano /usr/local/nagios/etc/objects/contacts.cfg
Make the following changes:
define contact{

contact_name nagiosadmin;

use generic-contact;

alias Nagios Admin;

email admin@example.com;

}
Save and close the file, when you are finished.
Configure Nagios Web Interface
Next, you will need to configure nagios web interface to access Nagios from web. You can install Nagios web interface with the following command:
cd nagios-4.4.3

make install-webconf
Next, create a user account for Nagios and set password with the following command;
htpasswd -c /usr/local/nagios/etc/htpasswd.users nagiosadmin
Provide the password as per you wish:
New password:

Re-type new password:

Adding password for user nagiosadmin
Next, enable cgi module and restart Apache web server to apply all the changes:
a2enmod cgi

systemctl restart apache2
Next, you will need to download Nagios plugins to monitor services. You can download it with the following command:
wget https://nagios-plugins.org/download/nagios-plugins-2.2.1.tar.gz
Once the download is completed, extract the downloaded file with the following command:
tar -xvzf nagios-plugins-2.2.1.tar.gz
Next, change the directory to Nagios plugin and install it with the following command:
cd nagios-plugins-2.2.1

./configure --with-nagios-user=nagios --with-nagios-group=nagios

make

make install
Finally, start Nagios service and enable it to start on boot with the following command:
systemctl start nagios

systemctl enable nagios
Access Nagios Web Interface
Nagios is now installed and configured, it’s time to access nagios web interface.
Open your web browser and type the URL http://192.168.0.100/nagios. You will be redirected to the following page:
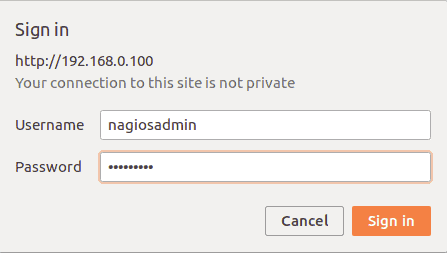
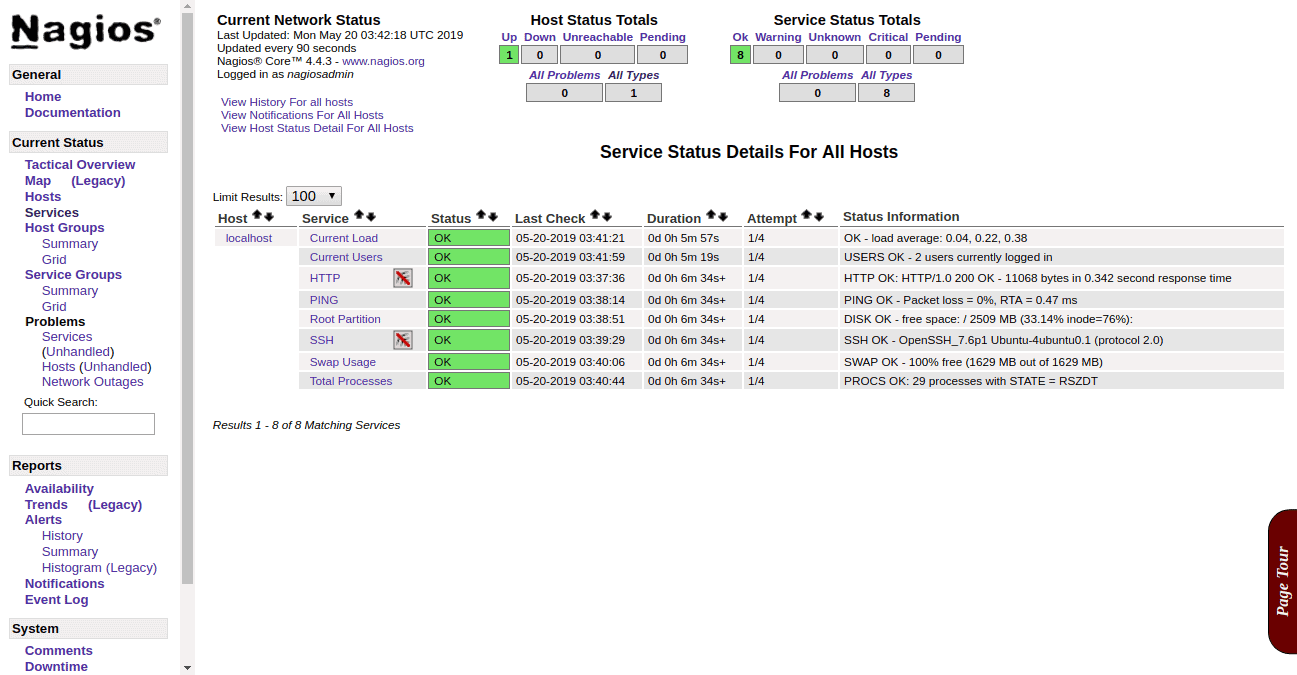
Provide Nagios username and password and click on the OK button. You should see the Nagios dashboard in the following page:

Now, click on the Services on the left pane to monitor the services as shown below:
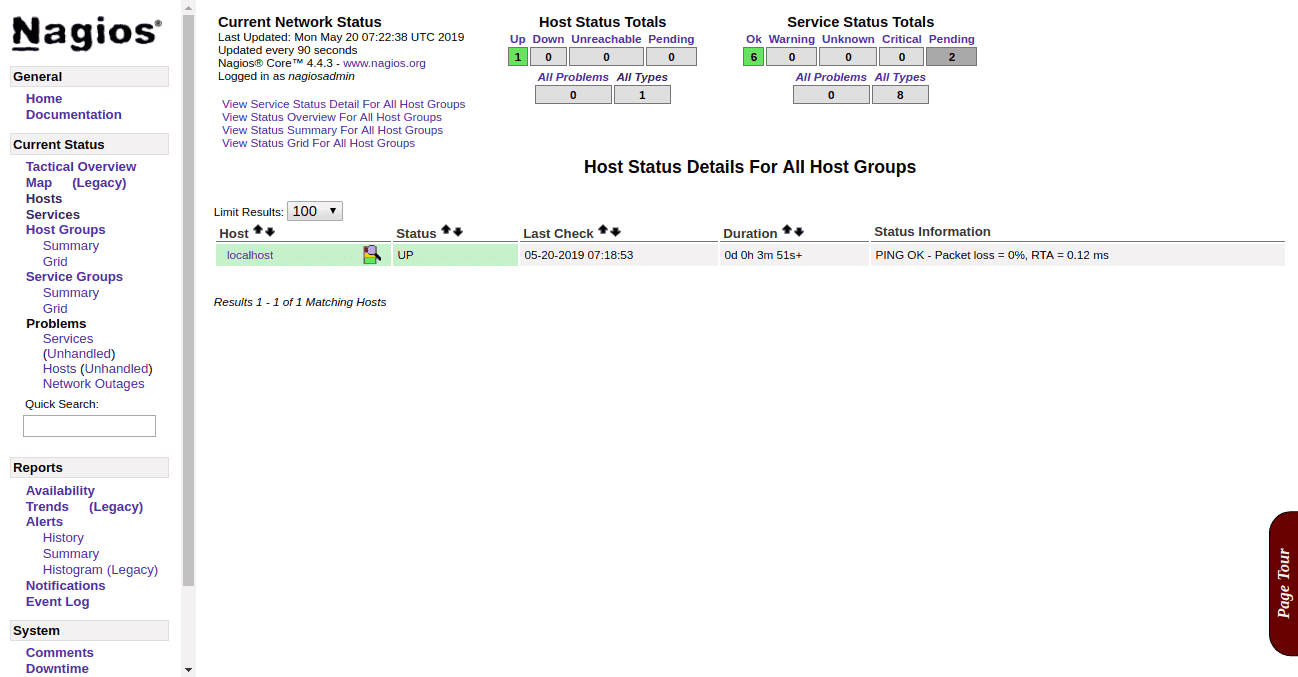
Next, click on the Hosts on the left pane to see a detailed report about the hosts as shown below:
Monitor Remote Host Using NRPE
NRPE also known as “Nagios Remote Plugin Executor” allows you to monitor services and applications running on the remote host.
To do so, you will need to install NRPE on remote host.
First, log in to the remote hosts and install NRPE with the following command:
apt-get install nagios-nrpe-server nagios-plugins -y
Once the installation has been completed, you will need to configure NRPE to accept the connection from the Nagios server.
You can do it by editing the /etc/nagios/nrpe.cfg file:
nano /etc/nagios/nrpe.cfg
Change the following lines:
allowed_hosts=192.168.0.100
Save and close the file. Then, restart NRPE with the following command:
systemctl restart nagios-nrpe-server
Next, check the NRPE with the following command:
/usr/lib/nagios/plugins/check_load -w 15,10,5 -c 30,25,20
You should see the following output:
OK - load average: 6.19, 5.46, 3.50|load1=6.190;15.000;30.000;0; load5=5.460;10.000;25.000;0; load15=3.500;5.000;20.000;0;
Add Remote Host on Nagios Server
First, you will need to install NRPE plugin on Nagios server. You can install it with the following command:
apt-get install nagios-nrpe-plugin -y
Next, edit Nagios configuration file and uncomment cfg_dir:
nano /usr/local/nagios/etc/nagios.cfg
Uncomment the following line:
cfg_dir=/usr/local/nagios/etc/servers
Save and close the file. Then, create servers directory:
mkdir /usr/local/nagios/etc/servers
Next, configure Nagios server to monitor remote client host. You can do it by editing commands.cfg file:
nano /usr/local/nagios/etc/objects/commands.cfg
Add the following lines:
define command{

command_name check_nrpe

command_line /usr/lib/nagios/plugins/check_nrpe -H $HOSTADDRESS$ -t 30 -c $ARG1$

}
Save and close the file. Then, create a client configuration file:
nano /usr/local/nagios/etc/servers/client.cfg
Add the following lines:
define host{

use linux-server

host_name nagios.client

alias nagios.client

address 192.168.0.103

}

define hostgroup{

hostgroup_name linux-server

alias Linux Servers

members nagios.client

}

define service{

use local-service

host_name nagios.client

service_description SWAP Uasge

check_command check_nrpe!check_swap

}

define service{

use local-service

host_name nagios.client

service_description Root / Partition

check_command check_nrpe!check_root

}

define service{

use local-service

host_name nagios.client

service_description Current Users

check_command check_nrpe!check_users

}

define service{

use local-service

host_name nagios.client

service_description Total Processes

check_command check_nrpe!check_total_procs

}

define service{

use local-service

host_name nagios.client

service_description Current Load

check_command check_nrpe!check_load

}
Save and close the file. Then, restart Nagios server with the following command:
systemctl restart nagios
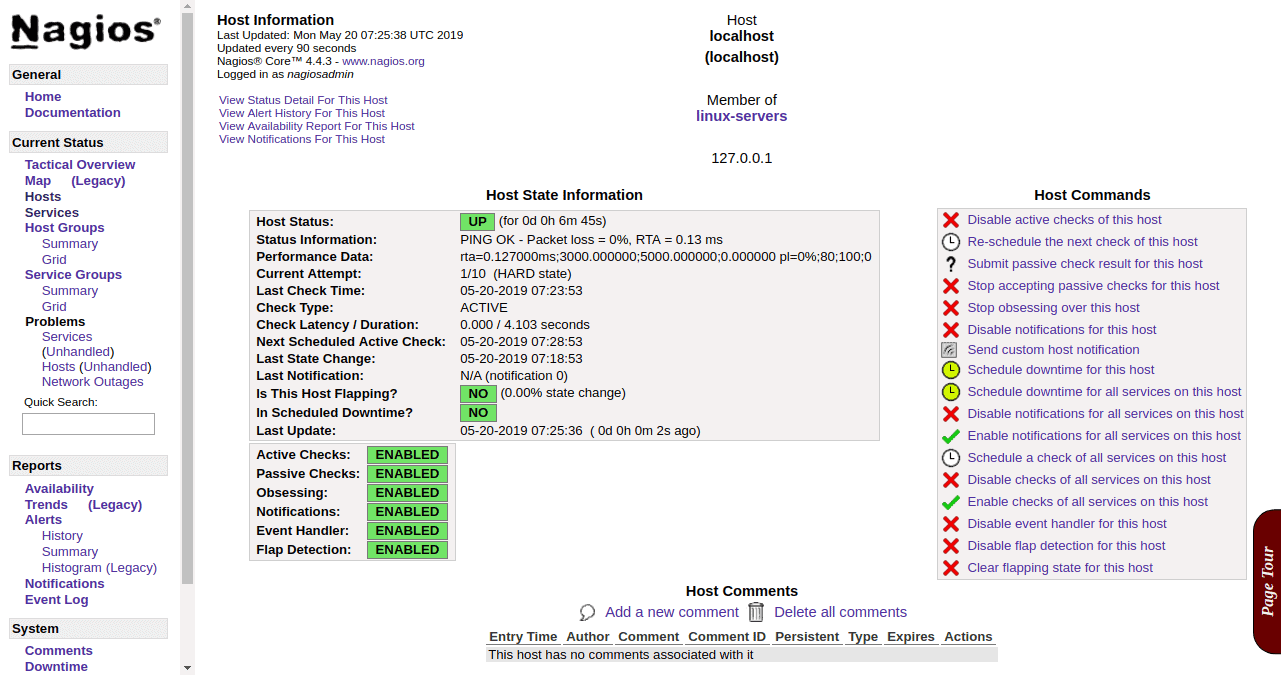
Now, go to the Nagios dashboard and click on the Host. You should see the newly added client host in the following page:
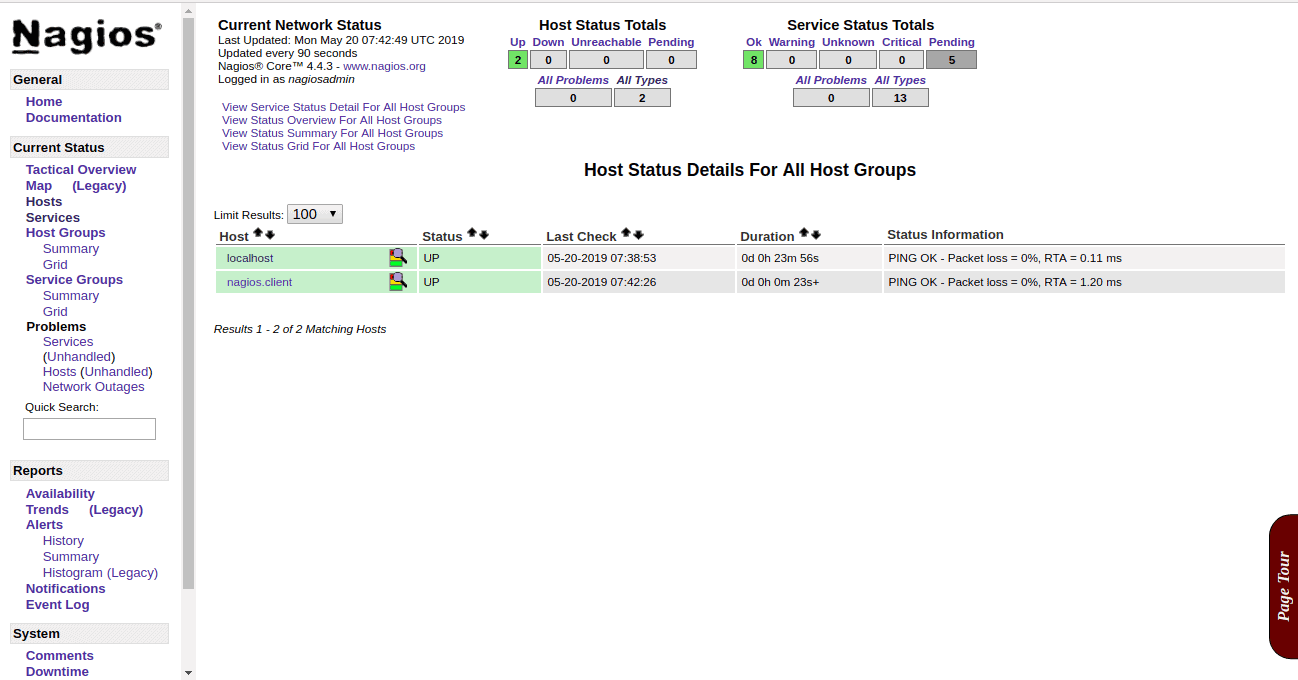
Now, click on the client host to see all the details about client host in the following page:

Congratulations! you have successfully installed and configured Nagios on Ubuntu 18.04 server. You can now add more hosts to monitor your entire infrastructure easily.