
Monitoring the storage for your business is critical for any enterprise. From both a security standpoint to a performance and maintenance one, you need to stay on top of all any potential issues before they even happen. If a malicious insider is manipulating your data, or if your storage is gonna run out of space soon and downtime is imminent, both of these issues have a point of no return where you have to enter damage control. In this aspect, prevention is key. Luckily there are very convenient tools for this, from offering a full view of your entire network to managing every single user and modifying their clearance accordingly, to creating personality profiles of your employees to asses their risk to your business. These tools will provide their unique ways of solving these issues and many more.
The Best NetApp Monitoring Tools
1. Site24x7 Network Monitoring – FREE TRIAL
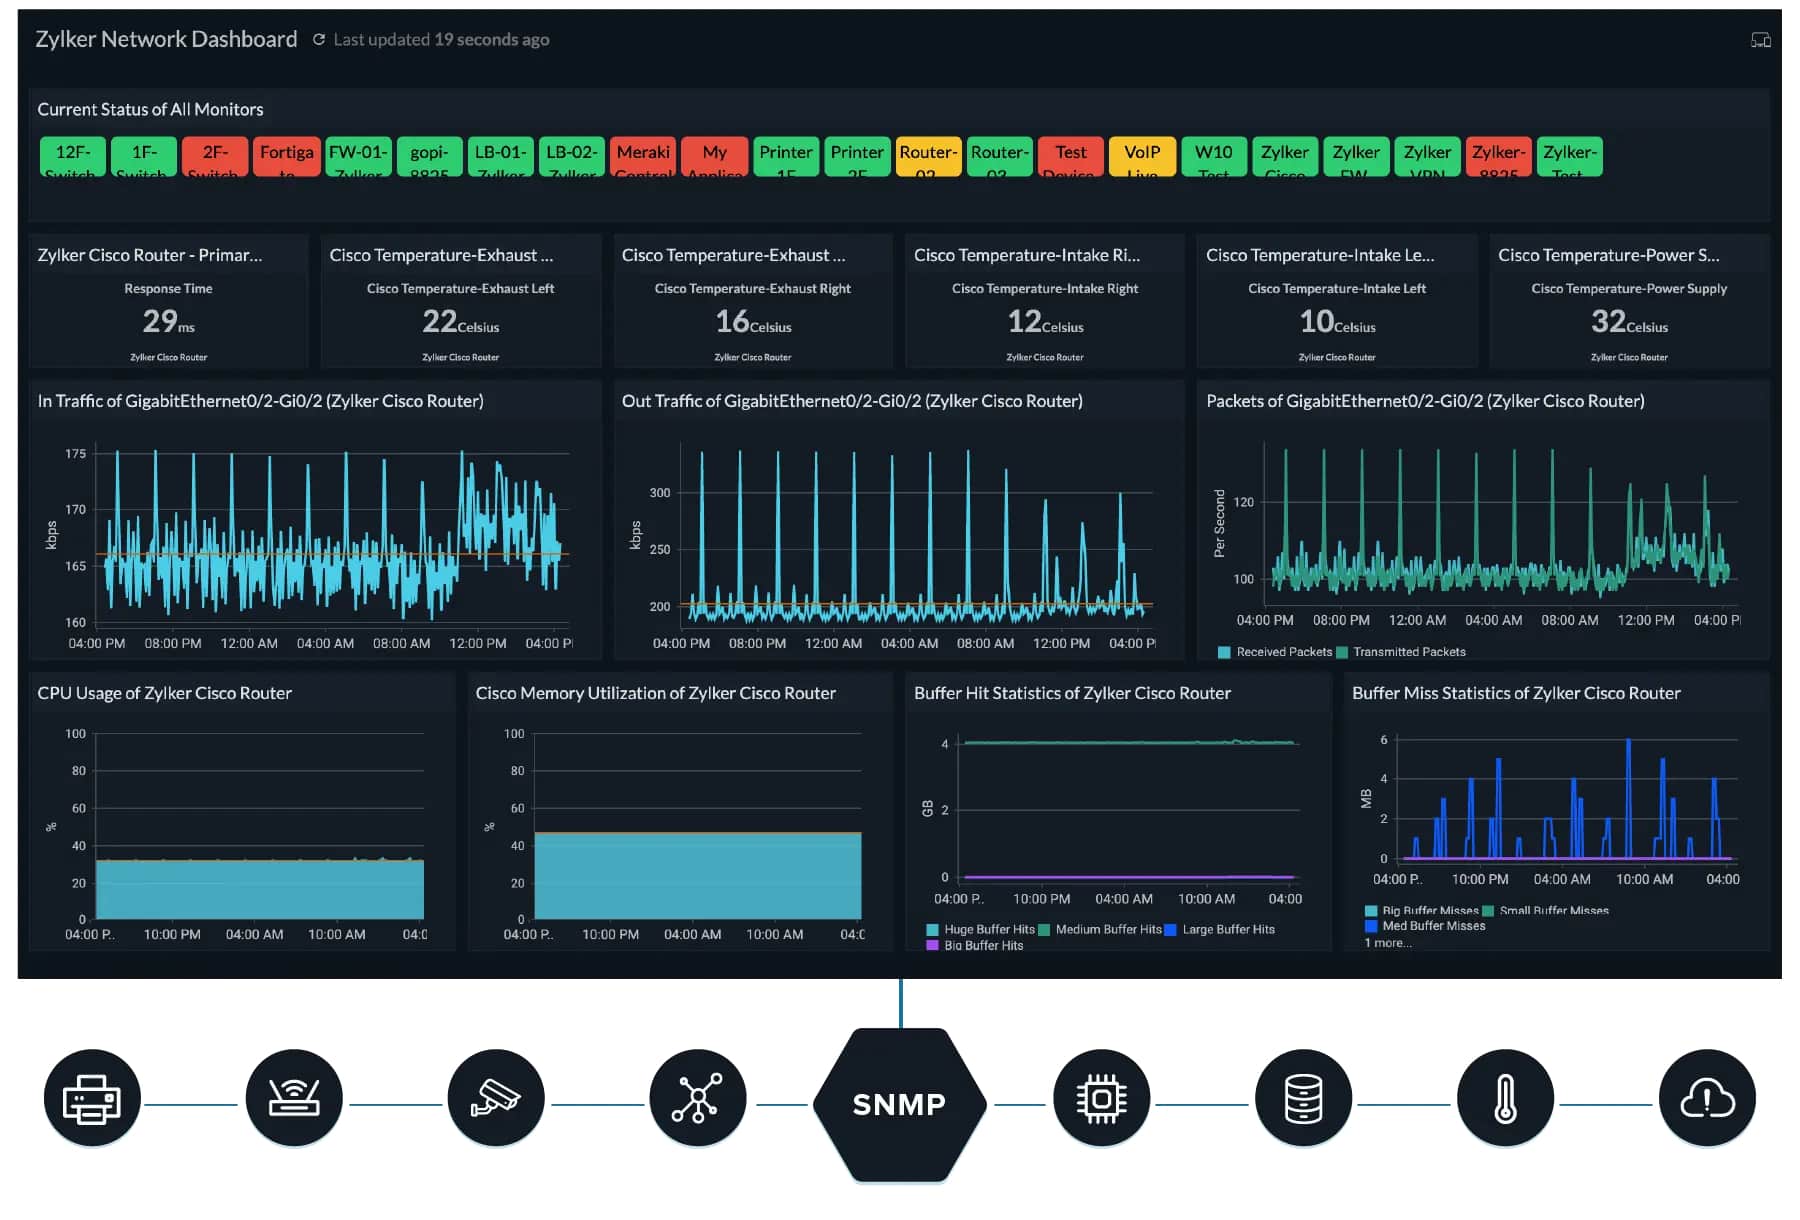
Site24x7 allows for quick and precise insight into any network. It offers deep network analysis that allows you to reach the root of any network problem very efficiently. It completely covers your entire network and is built with making sure you keep you maximize your uptime efficiently and securely. It allows for streamlined auto-discovery, either over a specific IP range, or an entire network using SNMP. Configuration is easy as well considering there are over 10,000 templates for you to choose from, this way you can get started monitoring practically out-of-the-box and then fine-tune your experience to better suit your business needs. Pair that up with a versatile alerting system where you can get your notifications in almost every way imaginable, from SMS to voice calls to RSS feeds, and you have a very well-rounded tool that will suit your every need.
2. Paessler PRTG – FREE TRIAL
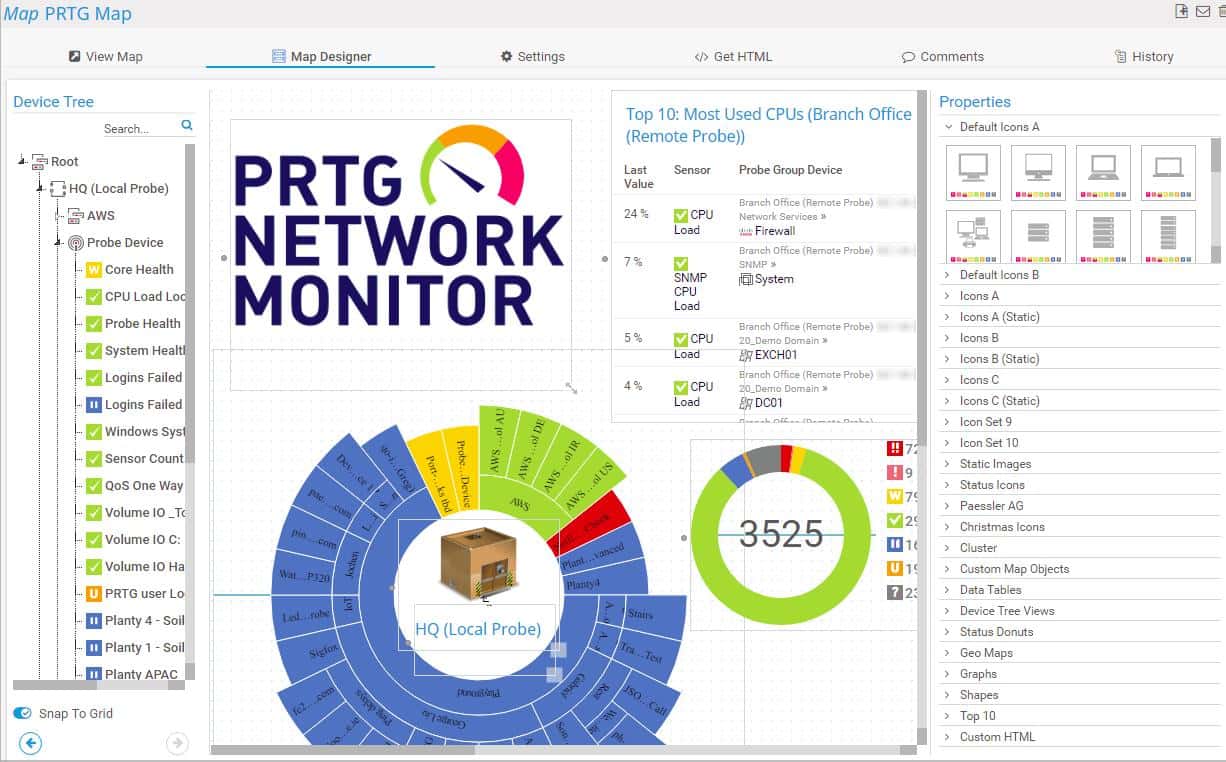
Paessler PRTG is very easy and intuitive to use. It offers a single clear view of the entire network in a very comprehensible manner. One of its advantages is the fact that the average IT techie will be able to navigate and understand the information it is displaying and you don’t need to have a dedicated network monitoring specialist. It also allows you to monitor and oversee your entire network, not just your storage area, although it does do an excellent job at just that bit alone. It works out of the box and has pre-built templates for all the most popular vendors to make sure you can start monitoring and managing your system as soon as possible.
Get started with a 30-day free trial. After that, PRTG is free to use for up to 100 sensors.
3. ManageEngine ADAudit Plus – FREE TRIAL
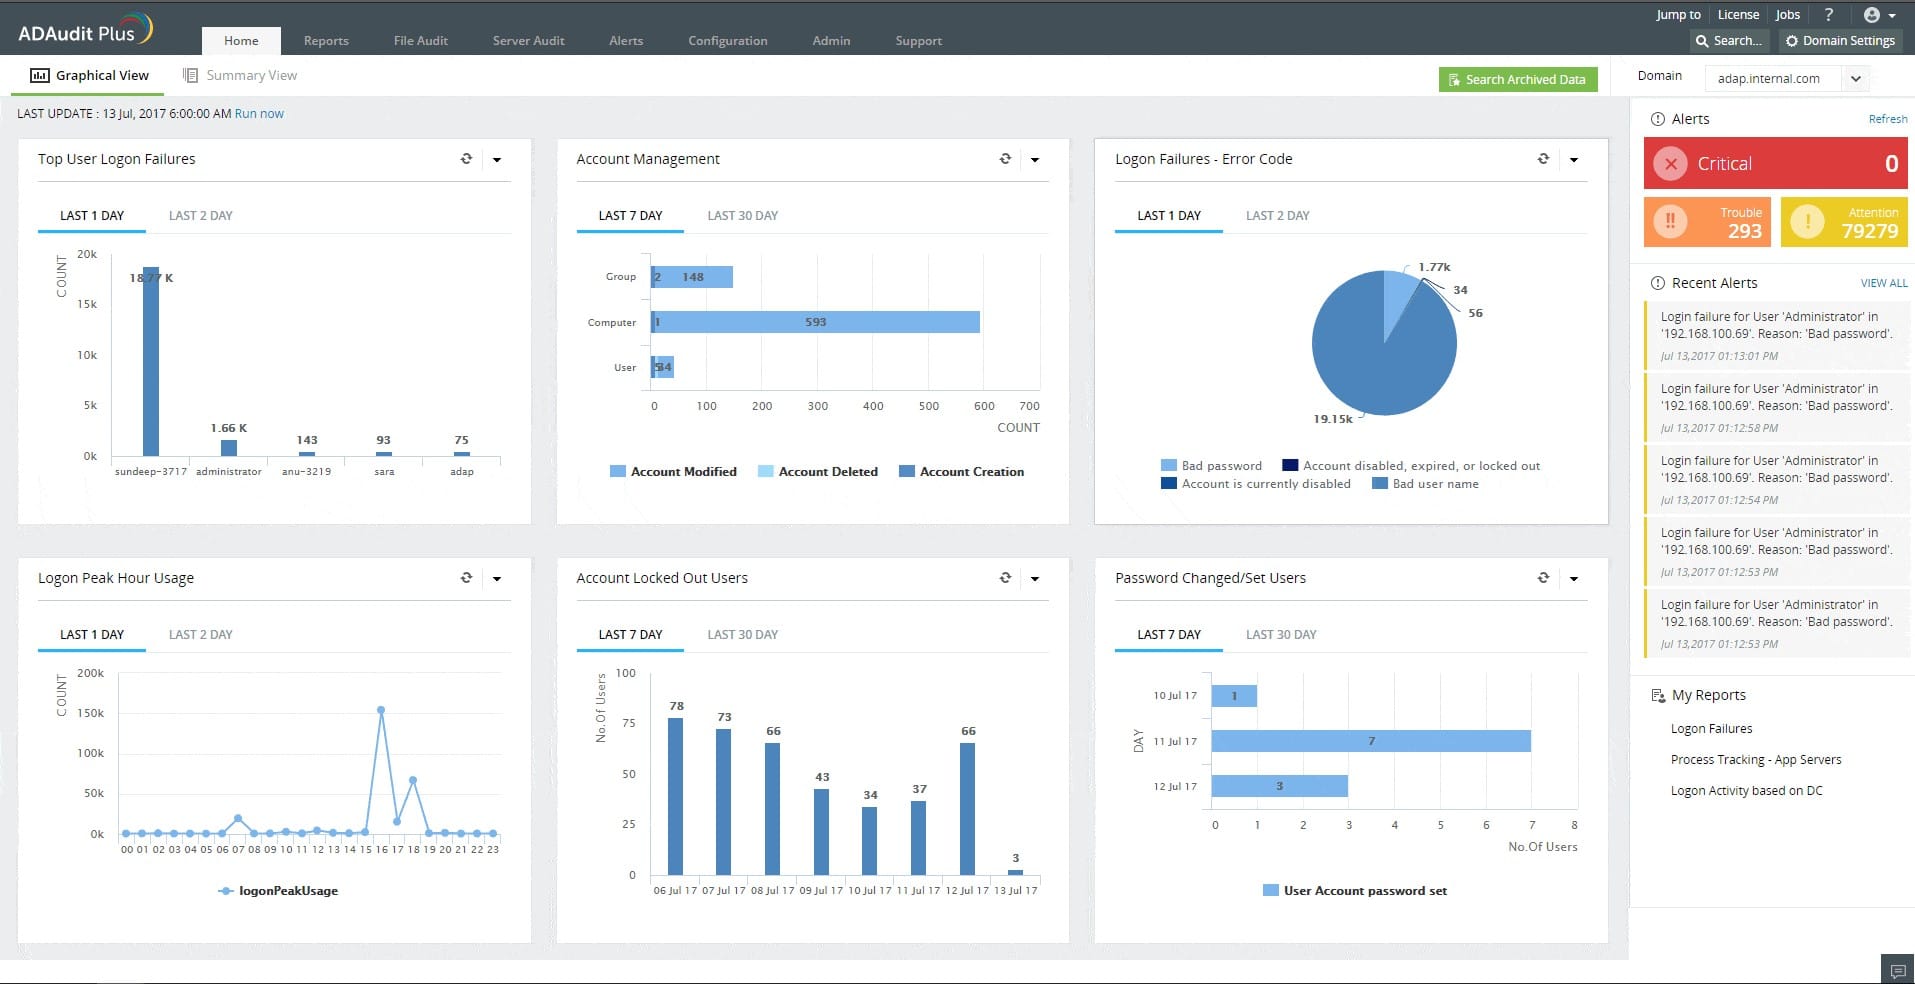
ManageEngine ADAudit Plus is a Windows-only tool. It works on all Windows operating systems, all the way down to Vista. ADAudit helps you keep your network secure and compliant by offering a multitude of security features. It allows you to oversee, log and audit all of the related Windows user logon activity, potential authentication failures, and any file changes. This allows you to have full insight into how your network is operating and tighten up your security throughout your system. You can assign granular permissions to users to make sure everybody’s access is in accordance with their clearance level to make sure no information gets leaked or stolen. This doesn’t only apply to the regular-level users, but the system administrators as well are held accountable with this monitoring system. Furthermore, you may track the active work time of all of your employees to see their effective time spent working in comparison to the time spent idle.
Register for the 30-day free trial.
4. ManageEngine OpManager Nexus – FREE TRIAL

ManageEngine OpManager Nexus, formerly OpManager Plus, is a unified observability platform that can monitor all the applications and devices in your WAN and LAN. It continuously analyzes your infrastructure to provide insights into the health and performance of your device components. Its intelligent alerts and contextual data ease troubleshooting and help make informed decisions. Its dashboards and reports are a big plus as well.
OpManager Nexus comes in two pricing tiers. The Professional edition is priced at $1,233 for 50 devices and the Enterprise edition at $19,995 for 1000 devices. Start a 30-day free trial.
5. IntelliMagic Vision for SAN

IntelliMagic tracks all of the critical performance metrics of your infrastructure, and not only your SAN infrastructure. It has artificial intelligence integrated within it that will assist you in a plethora of ways. From allowing you to precisely identify the root causes of issues, eliminating bottlenecks, or preventing issues within your storage arrays, artificial intelligence tackles all of these issues proactively before they even become a problem. All of these issues vary in how important they are to deal with, with some just causing a slowdown, and some might result in significant data loss or even critical failure of your network. Being well-equipped to deal with these issues is imperative for a smoothly operating business. IntelliMagic not only covers all of these issues but lets you manage them all from a single screen. This allows for crystal clear clarity of your entire network while minimizing all of the clutter you would usually get by switching screens and monitors to check every single application or service to monitor your critical points. Even if there isn’t a necessarily critical anomaly, IntelliMagic will still use its advanced statistical analysis and deep insight to identify it, monitor any changes that it may cause, and inform you with a prediction about its possible effect. Artificial intelligence also monitors your storage capacity usage over time, creates expectations, and predicts your future storage needs to prevent any potential capacity constraints.
6. Nagios NetApp Monitoring

Nagios has the Core 4 monitoring engine that separates it in its processing efficiency and scalability. You can scale up your enterprise nearly infinitely using the engine while also having high monitoring effectiveness. Furthermore, the effective monitoring that Nagios provides is vast and thorough. It allows you to essentially monitor your entire network. Using it, you can see crucial information such as disk usage, file size, disk usage, and many more. Nagios is far more than a simple storage monitoring tool. Since Nagios has hundreds of third-party add-ons, its effective coverage spans far more than a monitoring tool does and is capable of essentially monitoring your entire system. Take all of that into consideration and pair it with a fully customizable interface where you can edit the experience on a per-user basis, you have an overall very rounded-out solution that can cover most needs that you may have. Nagios however doesn’t come with Windows support.
7. LogicMonitor NetApp Monitoring

Setting up and fine-tuning your configurations can be difficult and time-consuming to get right. LogicMonitor NetApp Monitoring allows you to skip all that work with its integrations. With no configuration at all, you get deep insight into multiple valuable metrics such as active interfaces, CPU usage, disk activity, IO per second, consistency point activity, cache age, and many more.
8. Netwrix Auditor for NetApp

Netwrix Auditor provides absolute visibility for your data access, effective permissions, and data ownership on NetApp filers. It monitors any file changes that your users may perform, audits, and comprehensively logs them. This way you can have clear insight into who has done what, where, and how within your network. You can even audit file access requests, both ones where the clearance wasn’t adequate and the access was denied and the ones that clear as well. It also has threshold-based alerts where it will monitor any sudden spikes in data being changed that may indicate malicious activity. You will be notified immediately to try and remediate any potential damage that may have been done. Pair that with user behavior analysis which will scan for suspicious activity and assess the risk of every employee’s actions and designate whether they are a potential threat to your business or not.
9. OPSView Monitor

OPSView allows for very quick installation and implementation considering it has auto-discovery. It will allow you to scan an IP range or search via DNS names in your network. After this, you will see all your devices, your agents, and the network services that you are implementing, all neatly displayed on your screen in one unified view. You have the choices between a unified view, a processes map, a hashtag tree map, a performance graph, and a network map. The reports that you get are pre-built and function fully out of the box. You get reports such as performance reports, SLA reports, and event reports. You can run these reports, daily, weekly, and yearly. OPSView does offer report customization though so if you wish to have a fully custom-tailored experience, it has you covered.
10. SolarWinds NetApp Storage Performance Monitoring

SolarWinds is a very versatile tool that monitors your entire system, rather than just storage. That being said, it has an integration with NetApp and it does a wonderful job of monitoring it. It allows you to monitor and maintain the health of numerous vital parts such as RAID groups, and NetApp storage at filers, and volume levels. It also creates a historic database of your storage usage, predicts any future expectations for your storage capacity, and alerts you accordingly. This proactive approach helps prevent any outages and prevents you from spending resources on unwanted storage assets.
Summary
We’ve covered a wide range of tools in this article. All of them have their strengths and weaknesses, and each provides its way of presenting you with the best experience for your business. You might need something more general to suit a vast array of needs that your business enterprise has, or you might prefer something more specific to tackle a single problem. These tools should have you covered. Hopefully, within this article, you have gained more insight into how they work and what their specific features are, and which one is the right choice for you.