
To ensure that your users have an engaging, quality experience, you need to confirm your Java app is running without a hitch. Having Java installed doesn’t cut it if it’s causing your processes to lag out. By directly monitoring the Java Virtual Machine(JVM), you can ensure uptime and find issues whenever they occur.
Here is our list of the best Java monitoring tools:
- Site24x7 APM – FREE TRIAL This SaaS package provides code profiling features that can step through text-based programs, such as those written in Java. This is a good tool for development teams as well as for operations monitoring. Start a 30-day free trial.
- ManageEngine Applications Manager – FREE TRIAL A great all-around tool that excels at cutting down on hanging and abandoned processes. Start a 30-day free trial.
- ManageEngine OpManager Nexus – FREE TRIAL An application observability platform that spots slowdowns in Java applications and identifies the causes behind them for faster troubleshooting. Download a 30-day free trial.
- SolarWinds Observability SaaS A well-rounded Java monitoring tool offering strong root-cause analysis, a great UI, and solid scalability.
- Datadog APM A part of the Datadog monitoring solution, it offers a lot of diversity in its approach to Java monitoring. This cloud-based tool is highly customizable and offers many historical and contextual monitoring options.
- Sematext Monitoring An innovative tool with a free version, great for companies with large data volumes.
- Dynatrace A cloud-based solution that provides an excellent UI alongside end-to-end transaction journey monitoring
- Java VisualVM A completely free tool capable of tracking all of the most crucial metrics
- LightStep Extremely flexible tool for SMBs with reasonable pricing
There’s a variety of tools on the market that you can use to help you monitor Java. Although most of them are relatively similar in functionality, others will give you completely different options, such as profiles, application performance monitoring, and a variety of other features to escalate your business to the next level. In addition, each set of tools provides a different angle to look at and solve problems.
Why Use A Java Monitoring Tool?
The JVM system contains a variety of built-in memory handlers used to manage resources and memory. With that being said, all resource access events have to be managed program-by-program.
If multiple Java-based apps are running simultaneously, they can jam up when one holds resources that the other needs. In the worst case, this will occur with both programs, leading to both of them halting. While this might sound uncommon, it happens pretty often; sometimes, it lasts for such a short time you barely notice, while in others, your apps might just wholly stop.
There are five different kinds of Java performance issues:
- Memory availability issues
- Database access problems
- App/service availability issues
- Server and network issues
- Multi-thread deadlock problems
It’s nigh-impossible to find all of these issues manually, and it’s even harder to resolve them that way. Because of this, most companies take advantage of a monitoring tool to ensure that the Java infrastructure is operating seamlessly.
The Best Java Monitoring Tools
1. Site24x7 APM – FREE TRIAL
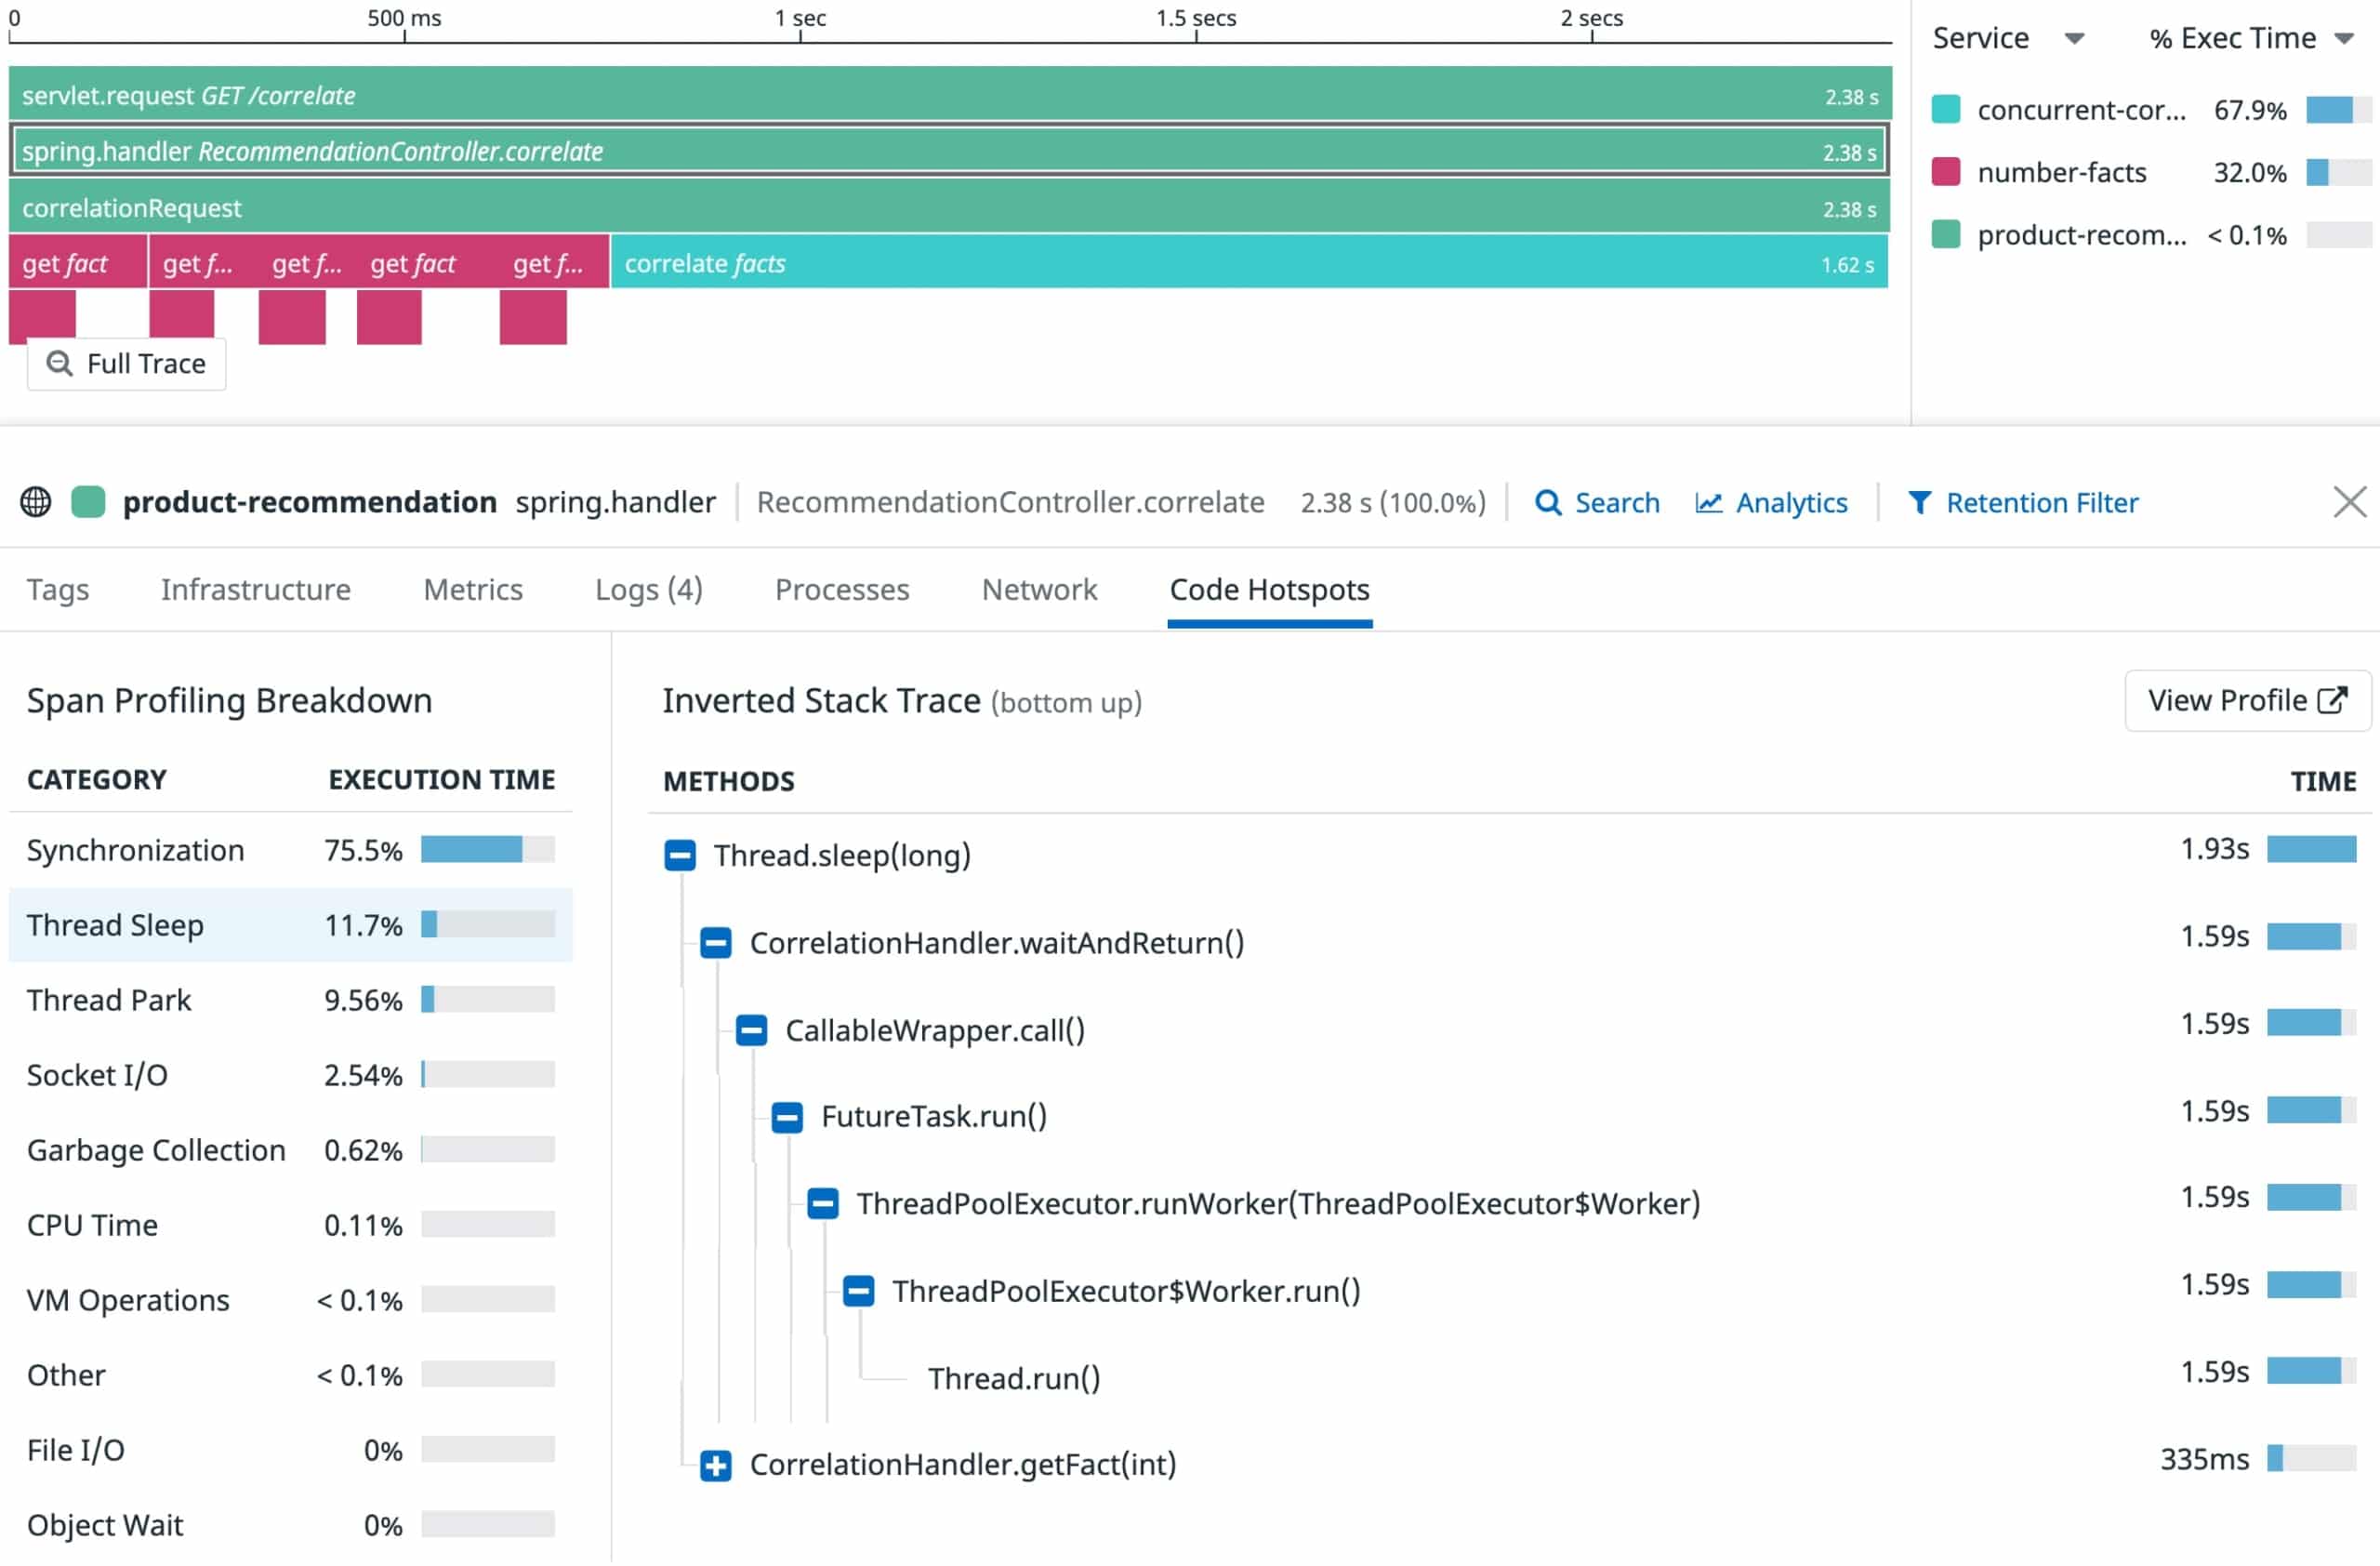
The Site24x7 APM package includes routines for monitoring applications as they run and it also provides a code profiler for text-based languages, such as Java. While your applications are running, you get automated performance tracking for issues such as JVM efficiency and memory management. The system is also able to observe all of the other systems with which your Java application interacts.
Main Functions
- Application discovery and dependency mapping
- Distributed tracing
- Code profiling
- Provides insights into Java code and also Node.js, PHP, Ruby on Rails, Python, .NET framework, and AWS services
- AI-based anomaly detection
Why do we recommend it?
In our testing phase, Site24x7 APM stood out with its comprehensive code profiling features for Java applications. It adeptly addressed memory management issues, ensuring the efficient running of our applications. The distributed tracing functionality provided valuable insights into the interactions of our Java applications with other systems.
Other features in the APM include a discovery system and an application dependency mapping service that identifies all of the functions that contribute to each application. The system also shows the relationship between applications and the reliance of each application on services and server resources.
The monitoring service deploys distributed tracing to track the activities of third-party functions that you can’t view internally. This system can also be used by development teams to verify the APIs and function libraries that are planned for inclusion in new applications.
The Site24x7 APM plan also provides server and network monitoring services and you also get synthetic monitoring and real user monitoring tools in the bundle.
Who is it recommended for?
Site24x7 APM is recommended for DevOps teams and development teams. Its code profiling features make it beneficial for developers, while the broader application and network monitoring aspects cater to operational needs. This tool is suitable for businesses of varying sizes, offering a 30-day free trial for exploration.
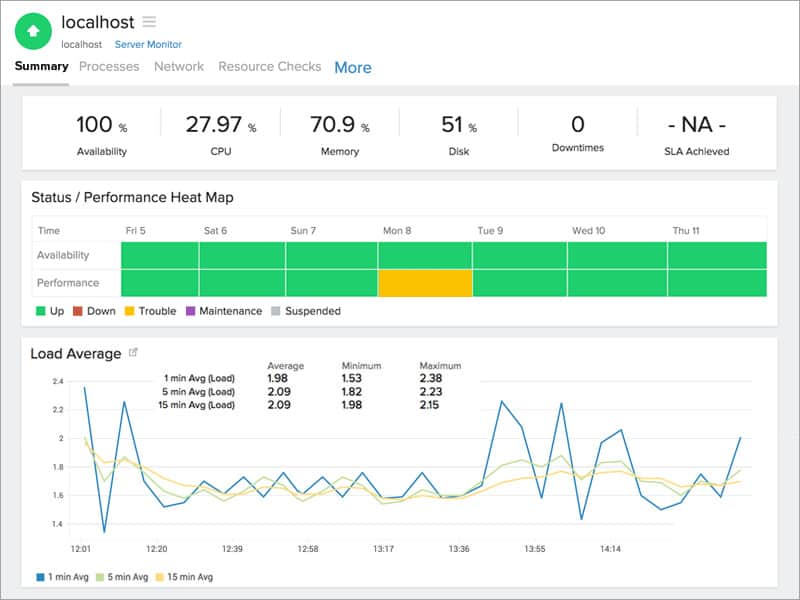
2. ManageEngine Applications Manager – FREE TRIAL
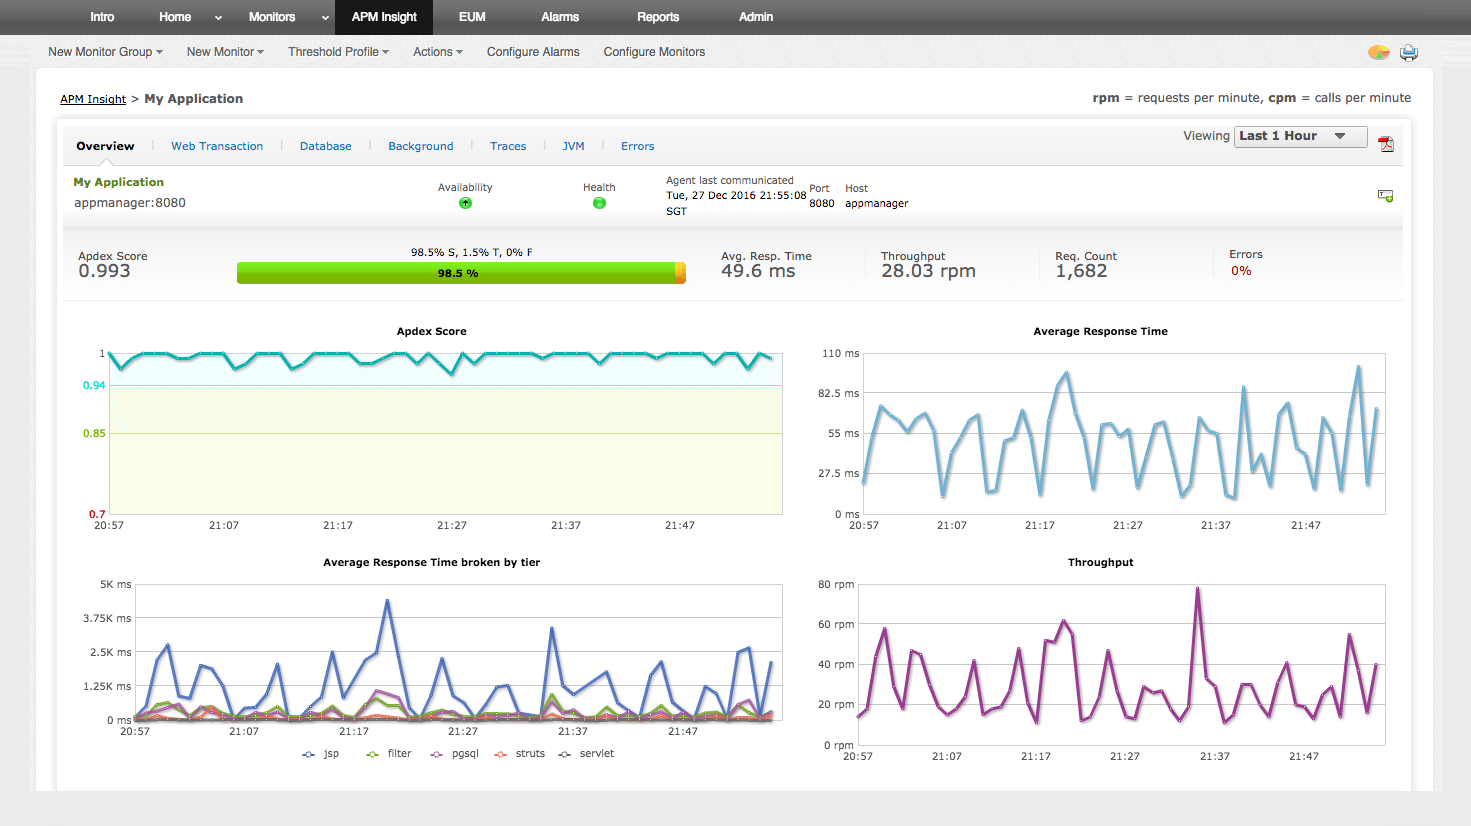
The ManageEngine Applications Manager has a unique look at Java monitoring. When the ManageEngine team made their JVM monitoring module, they concluded that memory management was the most significant issue faced by companies. Because of this, it focuses on memory management monitoring.
Main Features
- The ManageEngine monitors server statuses and general memory utilization, interface activity, and interactions with other applications.
- The focused approach to memory issues
- Robust alerts system
- Finds hanging and abandoned processes
Why do we recommend it?
Our experience with ManageEngine Applications Manager highlighted its unique focus on memory management monitoring. It efficiently detected and addressed hanging and abandoned processes, contributing to overall system stability. The robust alert system ensured timely notifications, enhancing our ability to proactively manage potential issues.
With that being said, it doesn’t restrict itself to memory management monitoring, nor does it limit itself to just Java monitoring. It will monitor Java performance and the performance of the apps the Java processes are reliant on, like database systems or web apps.
Since this tool looks at all processes simultaneously, it can easily find abandoned or hanging methods and suggest that you terminate them. This can often solve many common JVM issues, as a lot of problems are caused by resources consumed by hanging or abandoned processes.
The only monitoring duty the ManageEngine doesn’t perform is network monitoring. With that being said, it can do so with the ManageEngine OpManager, which can be easily integrated.
Who is it recommended for?
ManageEngine Applications Manager is recommended for businesses emphasizing memory management in their Java applications. It suits a variety of sectors, monitoring not only Java performance but also the apps Java processes rely on.
This tool is available for Linux and Windows servers and has a 30-day free trial.
3. ManageEngine OpManager Nexus – FREE TRIAL
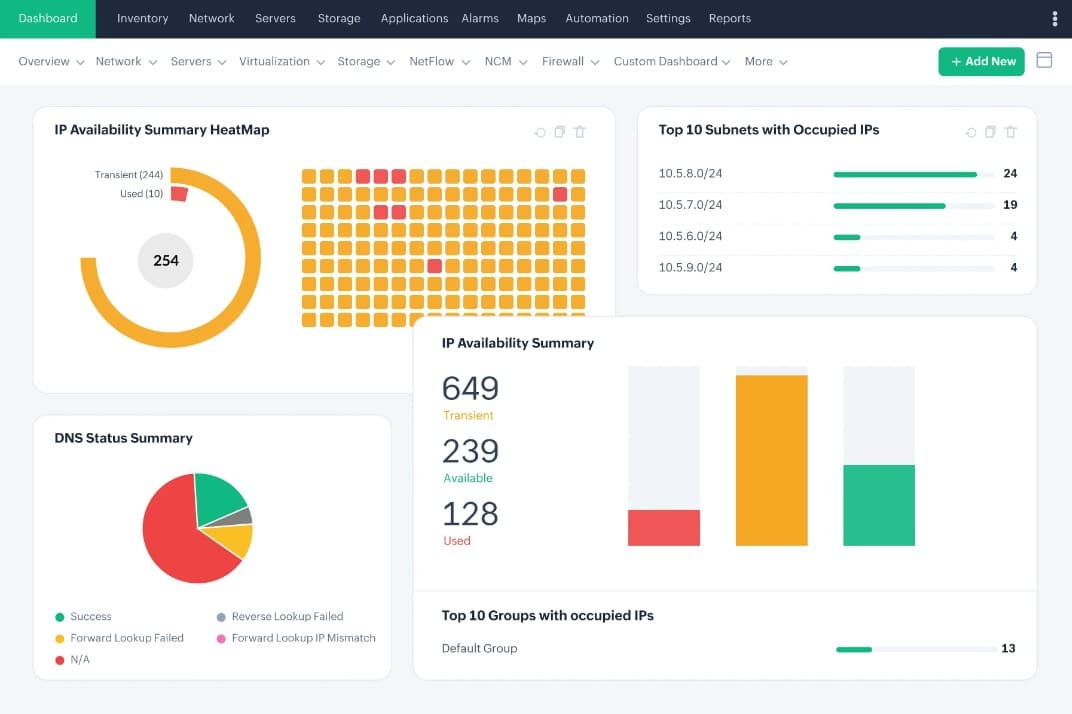
ManageEngine OpManager Nexus, formerly OpManager Plus, is an ITOps platform that monitors a wide range of applications, including Java. It offers visibility across the entire stack to identify slowdowns and their root causes. More importantly, it provides AI-based insights for quick remediation, so you can fix problems before they impact users.
Main Features:
- Uses tail-based sampling to identify the most important traces and correlates them to provide relevant data.
- Tracks CPU and memory usage to identify the functions consuming maximum resources.
- Creates a visualization of the dependencies.
- Captures every unhandled exception and provides context for it.
- Pinpoints the exact code, function, and query causing the problem.
Why do we recommend it?
OpManager Nexus is well-suited for monitoring Java applications. Built on OpenTelemetry, this platform ensures that all your data is portable. This way, you never have to worry about getting locked in with a single vendor.
This platform collects every HTTP 4xx/5xx error and unhandled exception, and groups them based on the root cause. This grouping enables you to prioritize your resources and address those groups that have the highest impact. This way, you can identify and fix issues before they impact end users.
Another salient feature is its intuitive dashboards. They are clean and well-designed, and make it easy to understand metrics and their trends. It also offers a historical replay that shows you how the architecture changes and when dependencies get introduced. All this information can support seamless troubleshooting.
Who is it recommended for?
OpManager Nexus works well for organizations that run a high number of Java applications. It also suits Java developers, application owners, MSPs, and others responsible for maintaining the availability and performance of Java applications.
The starting price of OpManager Nexus is $1,233 (Professional edition) and $19,995 (Enterprise edition). Start a 30-day free trial.
4. SolarWinds Observability SaaS
SolarWinds Observability SaaS (formerly AppOptics) is a great piece of software to keep track of your apps’ performance and keep track of Java metrics. SolarWinds is deployed on the cloud and works for application and infrastructure monitoring. Although there are two plans for infrastructure and application monitoring, the APM comes with the infrastructure plan by default.
Main Features
- The root-cause analysis makes troubleshooting a breeze
- Excellent UI with a customizable dashboard
- Customizable alerts system
- Cloud-based deployment
- Integrates with other SolarWinds tools
- Available on all of Java’s server types
- Hugely scalable
Why do we recommend it?
During our evaluation, AppOptics proved invaluable in monitoring Java applications. It tackled the challenge of identifying memory availability issues, ensuring our apps ran smoothly. The root-cause analysis feature swiftly pinpointed inefficiencies, allowing for a proactive approach to prevent potential disruptions.
JVM is complex in that each resource that delivers a good experience has to be constantly monitored. The SolarWinds APM software looks at all of these resources, as well as lateral interactions between the apps themselves.
SolarWinds Observability SaaS infrastructure plan monitors the server itself and all of the network systems that the JVM is reliant on. Although the JVM’s complex structure can present an issue to the infrastructure monitoring, the APM module quickly solves these. Every JVM process is tracked with the APM, collecting JVM log messages to ensure a flawless monitoring approach.
One of SolarWinds Observability SaaS’ biggest perks is its capability to take all supervision tasks upon itself. Whenever an issue crops up, it uses root cause analysis to help you get down to the core of the problem.
Another reasonably vital part of this software is its alerts system. You can get alerts in the app, through SMS, email, or you can even integrate it with Slack. This makes it so you don’t need to have an employee constantly overlooking the software.
Who is it recommended for?
AppOptics is recommended for businesses seeking a balanced Java monitoring tool. It’s suitable for a range of sectors, including development teams and operations monitoring. Its seamless integration with the SolarWinds suite makes it particularly beneficial for those already using SolarWinds products. While it caters to various business sizes, beginners might find it challenging due to the need for agent installation on each server. The tool comes with a 30-day free trial.
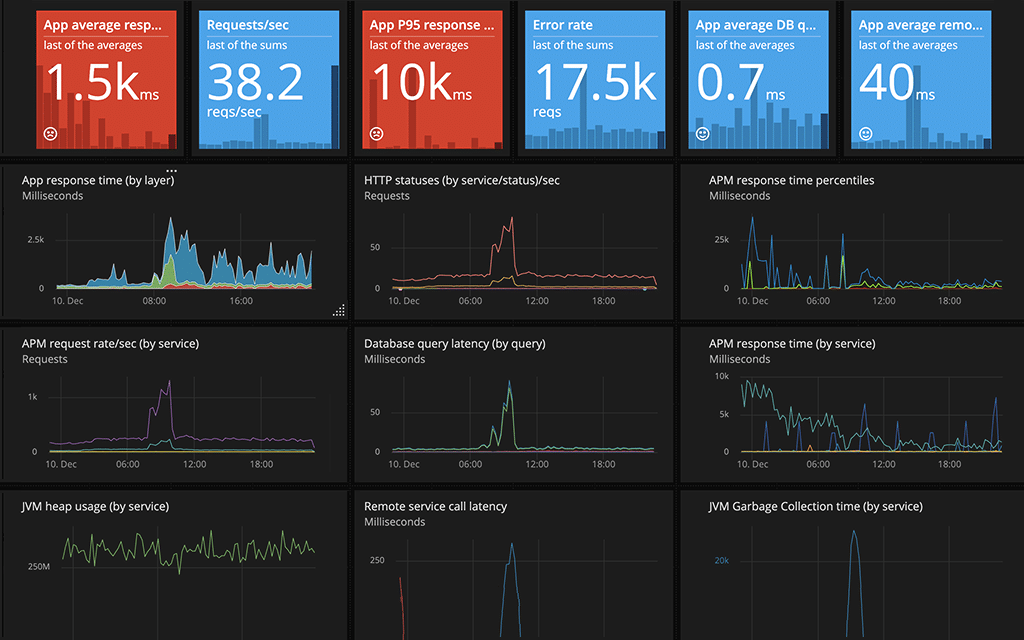
5. Datadog APM
Datadog is a cloud service featuring a variety of different monitoring tools. One of the tools within Datadog is the Datadog APM, which has JVM monitoring capabilities. One of the great things about Datadog is that you can easily access it through any browser, as it’s a cloud-based service(although it does require an agent).
Main Features
- Cloud-based
- Comes with a variety of other monitoring tools to give you a holistic monitoring approach
- A variety of customization options for the dashboard
- It provides a contextual approach to monitoring, letting you see how your metrics now compare to your historical metrics
- Great scalability
Why do we recommend it?
Datadog APM, in our evaluation, provided a cloud-based solution with extensive customization options for Java monitoring. It consistently tracked JVM metrics, offering insights into resource usage, memory activity, and response times. The contextual approach to monitoring allowed us to compare current metrics with historical data, aiding in proactive issue identification.
The APM monitors your JVM metrics constantly. The primary metrics monitored are resource usage, memory activity, response times, and garbage collection effectiveness. It does this for every Java-running application you have.
Datadog has one of the more customizable dashboards when it comes to Java monitoring tools, as well as a great alerts system. Furthermore, you can look at performance metrics for your entire server, and you can further improve this functionality by supplementing it with Datadog’s infrastructure monitor.
Who is it recommended for?
Datadog APM is recommended for businesses seeking a cloud-based Java monitoring tool with high customization capabilities. Its holistic monitoring approach, covering not only JVM metrics but also overall server performance, makes it suitable for various sectors. However, its complexity may pose a challenge for non-technical users, requiring skilled technicians for optimal utilization.
6. Sematext Monitoring
Sematext provides a cloud-based monitoring solution with excellent SIEM security monitoring features. Sematext takes the approach of keeping most of its attention focused on collecting and analyzing log files.
Main Features
- Priced per data collection agent per hour, making it great for high data volumes
- Has a free basic plan to monitor up to 5 hosts while storing data for 30 minutes
- Sematext Monitoring looks at all processes and constantly checks up on resources available to the server
- An innovative approach to Java monitoring
- Root-cause analysis capabilities
Why do we recommend it?
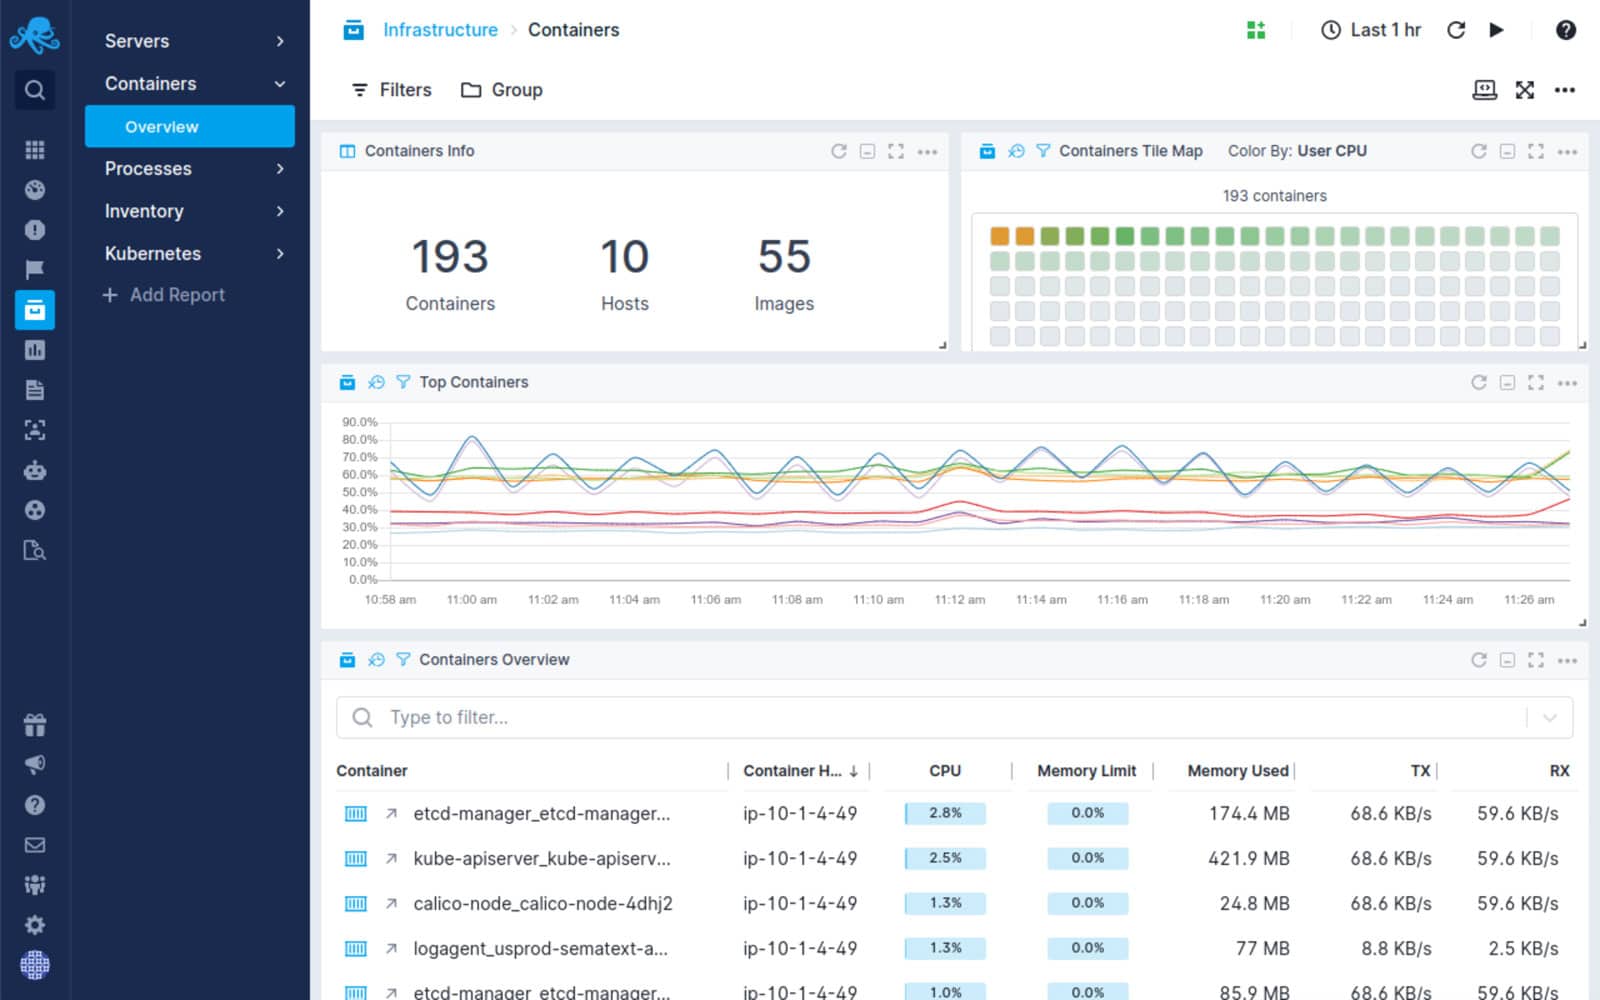
Our experience with Sematext Monitoring revealed an innovative, log-focused approach to Java monitoring. It excelled in analyzing log files to provide in-depth monitoring and root-cause analysis. The tool’s capability to gather and analyze over 100 Java performance metrics facilitated a comprehensive understanding of application performance.
All log messages arrive in real-time and are shown on the dashboard before filing. This approach allows Sematext to exploit all of the information stored within log messages to output a variety of in-depth monitoring and management functionalities. One of these functionalities is the Sematext Monitoring software, an infrastructure monitor including JVM monitoring capabilities.
The Sematext Monitoring software gathers and looks at over 100 different Java performance metrics. This is what facilitates its excellent root-cause analysis features. The system will isolate a few crucial metrics to indicate how well your apps perform. These metrics are:
- The data within JVM threads
- Garbage collection efficiency
- Memory allocation
Since the tool stores all of the information it collects, you can look at all of it to see your performance broken down over time. This is great for finding patterns within issues or finding out if your problems generally coincide.
Who is it recommended for?
Sematext Monitoring is recommended for businesses with a focus on log analysis and SIEM security monitoring. Its cloud-based solution, priced per data collection agent per hour, is advantageous for handling high data volumes. The free basic plan, suitable for monitoring up to 5 hosts, allows small businesses to benefit from its features. The tool is particularly effective for those comfortable with log-centric monitoring. Both have a 14-day extended free trial available.
7. Dynatrace
Dynatrace is another cloud-based software tasked with monitoring your infrastructure and application performance; however, it excels at web monitoring. This tool provides its APM and infrastructure monitoring module together.
Main Features
- Cloud-based
- End-to-end transaction journey monitor
- Excellent web monitoring features
- Intuitive UI for newcomers
Why do we recommend it?
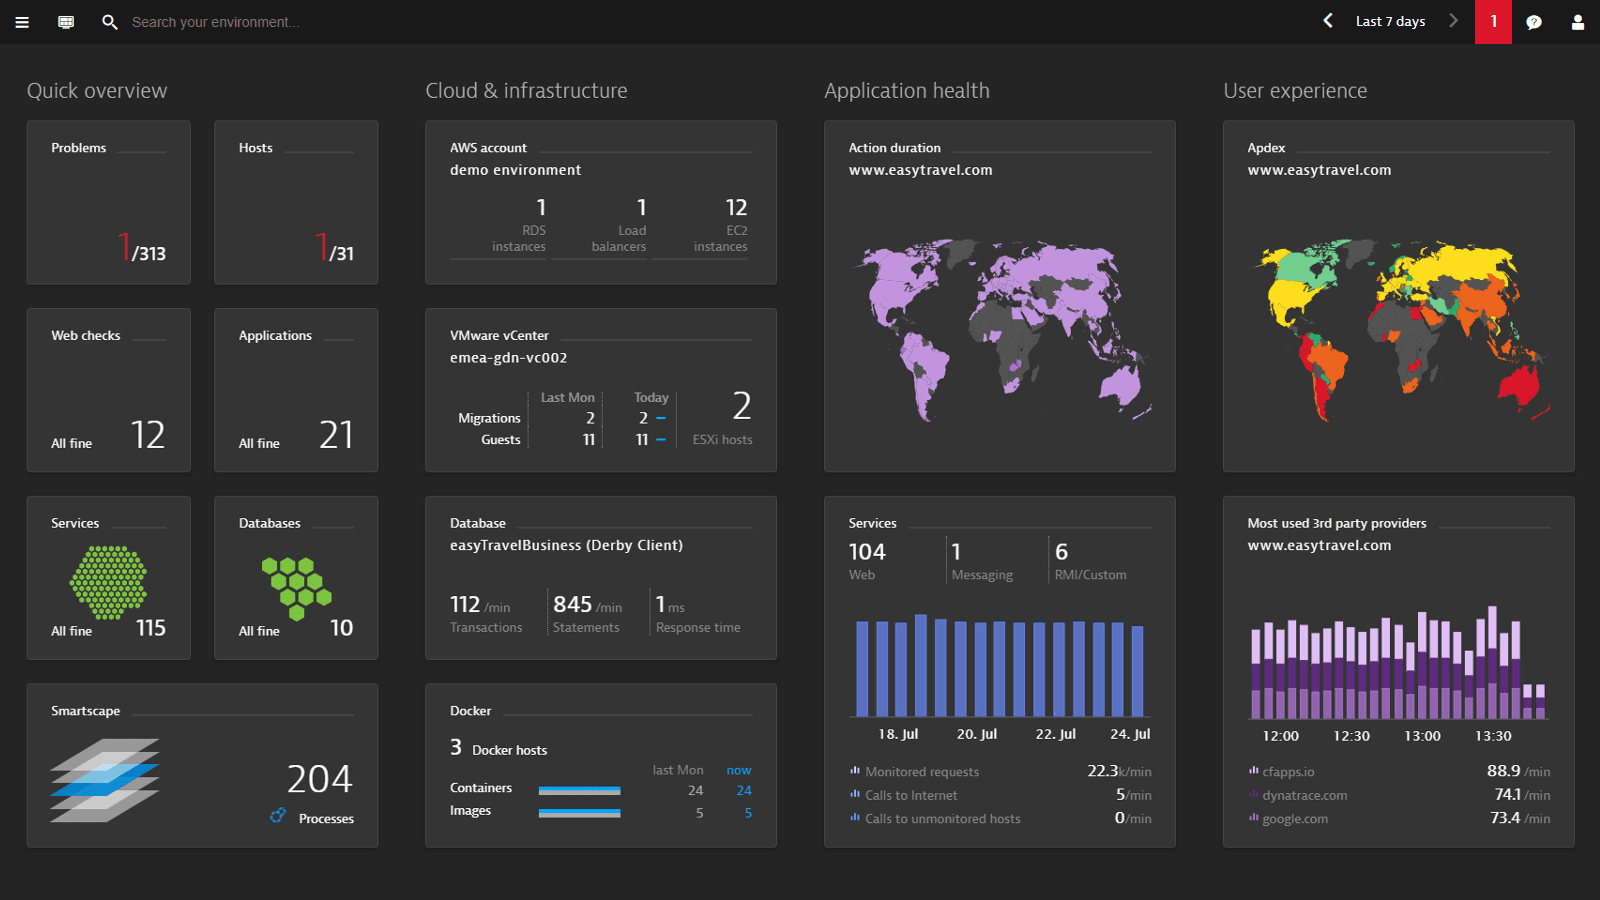
Dynatrace, a cloud-based solution, impressed us with its end-to-end transaction journey monitoring, particularly excelling in web monitoring. It provided a comprehensive view of JVM performance metrics, including requests, process statuses, and response times. The intuitive UI made it accessible for newcomers to effectively monitor both infrastructure and application performance.
It looks at various metrics ranging from requests, process statuses, response times, and garbage collection to interactions, error rates, and traffic volumes. This gives it a comprehensive look at your JVM performance and can indicate some issues unrelated to JVM.
In addition to the status-based monitoring options, Dynatrace provides an end-to-end transaction journey monitor. This monitor looks at each request’s path and looks at the services that ensure its delivery and fulfillment. This can be a great asset in determining how your JVM performance impacts a given activity.
Who is it recommended for?
Dynatrace is recommended for businesses emphasizing web monitoring and seeking a cloud-based solution. Its features cater to various metrics, making it suitable for sectors with diverse monitoring needs. The end-to-end transaction journey monitor is beneficial for understanding how JVM performance impacts specific activities. Dynatrace offers a 15-day free trial for its full-stack monitoring service.
8. Java VisualVM
The Java VisualVM is a free, all-around Java troubleshooting tool. It takes the command-line Java Development Kit(JDK) features and combines them with its profiling capabilities to predict your Java applications’ performance accurately. If you’re using Java 1.4 or above, the tool will let you connect to both local and remote Java processes.
Main Features
- The tool is entirely free
- It tracks all of the most critical JVM monitoring metrics
- Its interface is excellent for a free service
Why do we recommend it?
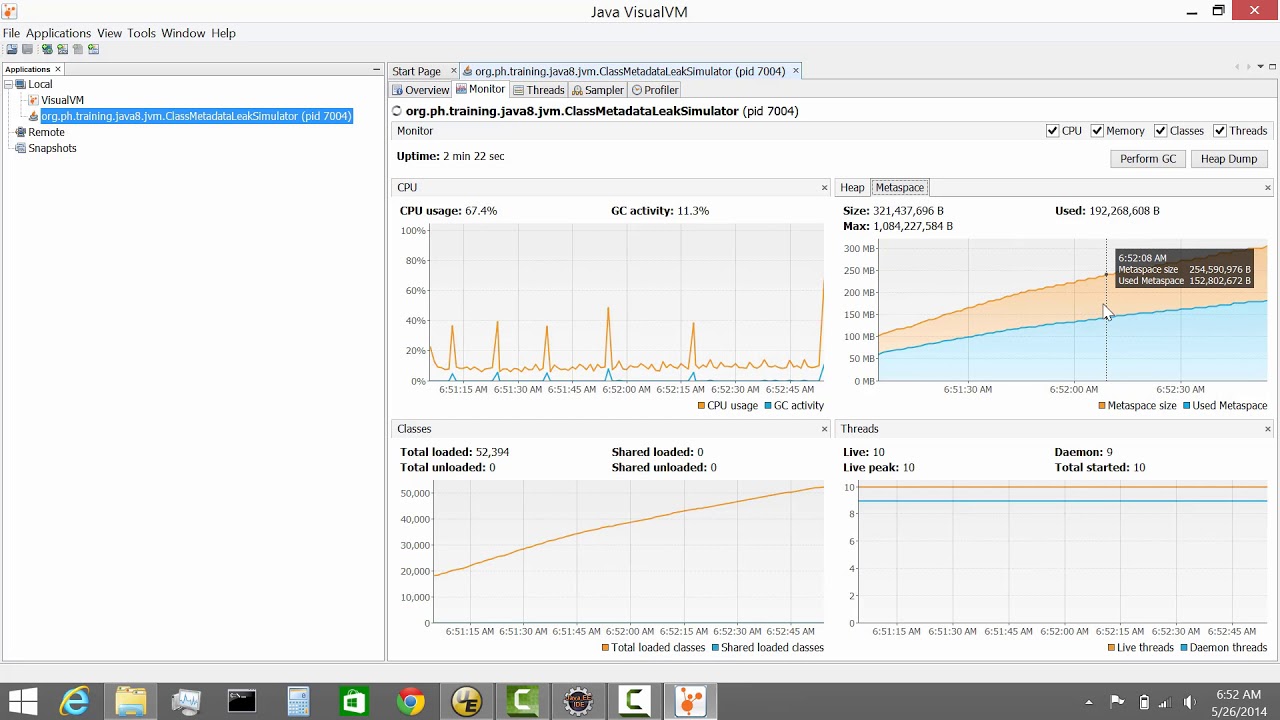
Java VisualVM, a free troubleshooting tool, proved to be a versatile option for monitoring critical JVM metrics. Its interface, despite being a free service, provided an excellent overview of CPU, GC activity, thread count, and memory allocation. For businesses on a budget, Java VisualVM offered essential monitoring capabilities without the cost.
The tool gives you a look at the most critical JVM metrics like CPU, GC activity, thread count, and memory allocation. It can also display thread dumps and load your heap dumps to create offline reports.
Who is it recommended for?
Java VisualVM is recommended for businesses seeking a free, all-around Java troubleshooting tool. Its compatibility with Java 1.4 and above, along with the ability to connect to both local and remote Java processes, makes it accessible to various users. While it lacks some advanced features compared to paid alternatives, it serves as a valuable option for essential JVM monitoring.
9. LightStep
LightStep is one of the best Java monitoring tools for SMBs. One of its main draws is that it’s, as the team would put it, “Built for Scale.” This means that you can get the bulk of its features for free for smaller businesses.
Main Features
- Very flexible pricing can often be considered a bargain for SMBs
- Extremely modern design, slick UI, and robust alert system
- Easy to learn for beginner users
Why do we recommend it?
LightStep stood out as an excellent Java monitoring tool for SMBs, offering a flexible pricing structure and a modern design. Its emphasis on scalability, coupled with full-context distributed tracing and Application Performance Monitoring, provided valuable insights into Java application performance. The tool’s user-friendly interface and robust alert system make it accessible for beginners.
It uses full-context distributed tracing alongside Application Performance Monitoring to give a great Java monitoring experience. This provides a lot of insight into how well your Java apps are performing, and although the tool doesn’t provide root cause analysis by itself, it can ease the process quite a bit.
Lightstep allows you to pick a single service and look at all of its calls, as well as filter them through its UI. This lets you have a very strategic approach to monitoring. Its alerts system is also very modern and coupled with its intuitive UI, and it’s one of the more accessible tools for beginners.
Who is it recommended for?
LightStep is recommended for small to medium-sized businesses (SMBs) seeking a scalable and cost-effective Java monitoring solution. Its modern design and intuitive UI make it easy for beginners to learn and utilize. While it may lack some advanced features compared to paid tools, its free version offers significant value for SMBs. Businesses can benefit from its features without a substantial initial investment.
Selecting Your Java Monitoring Tool
Ensuring your JVMs are running well makes a comprehensive approach necessary. Simply having a command-line utility or even a manual approach won’t cut it even for smaller businesses. You need to be constantly running tests and monitoring the statuses of your Java applications to ensure that your users get the best experience and keep performance issues at bay.
One of the most underrated features of Java monitoring tools is their alerts system. A robust alerts system can drastically decrease your technicians’ time to look for issues. Instead of spending hours running tests and looking for issues in data, your technicians should be spending their time solving your problems.
Naturally, the ideal system for your operation depends exclusively on your needs. Because of this, it isn’t easy to make a generalized list of Java monitoring tools. Your number 1 pick might be our 7th; however, we’ve ensured that our first few picks are those that you can’t go wrong with, even if they may not be optimal for your organization.
Look for live support and root-cause analysis features in addition to the standard assortment of metrics, logs, and traces most tools on the market keep track of. Always keep in mind what sets a tool apart from the pack, rather than simply looking at the number of features it offers.
Thankfully, with so many tools on the market today, you’re bound to find one that fits your business like a glove.
Did we miss your favorite Java monitoring tool?
What is your most sought-after feature in Java monitoring tools?
Let us know in the comments below!