As a business grows, the number of servers and devices connected to them increases. The “System” in system monitoring describes all of the computing resources within your organization.
Although each system element will have the infrastructure it relies on, the closer a system is to the end-user, the more it’ll depend on other elements within the system. In networking, we think of systems as layered stacks.
Here is our list of the best system monitoring tools:
- NinjaOne – EDITOR’S CHOICE An advanced monitoring platform that monitors every endpoint in real-time and provides data about their health and performance. Start a 14-day free trial.
- Atera – FREE TRIAL A comprehensive system monitoring tool that provides real-time insights, automated alerts, and performance analytics for networks, devices, and applications, ensuring optimal IT infrastructure health and efficiency. Get a 30-day free trial.
- Site24x7 – FREE TRIAL This cloud platform provides a package of system monitoring tools that are delivered as subscription plans. This service offers network, server application, middleware, and website monitoring plus log management. Get a 30-day free trial.
- ManageEngine OpManager – FREE TRIAL This system provides discovery and constant monitoring for networks and servers, both physical and virtual. The software package runs on Windows Server or Linux and is also available in AWS or Azure. Get a 30-day free trial.
- Paessler PRTG Network Monitoring – FREE TRIAL A sensor-based tool that allows you to mix and match the exact sensors you need and only pay for those. Start a 30-day free trial.
- ManageEngine EventLog Analyzer – FREE TRIAL A network security tool and auditing tool that correlates logs and advanced threat intelligence to detect attacks before they impact your organization. Start a 30-day free trial.
- Datadog Infrastructure Monitoring A well-made tool that combines scalability with ease of use and various integrations.
- SolarWinds Server & Application Monitor A tool made by a reputable SolarWinds company geared primarily for enterprises. It has autodiscovery features, as well as AI-assisted root-cause analysis.
- Nagios XI and Nagios Core The golden standard for free system monitoring tools, while XI is its excellent paid counterpart.
The user is always at the top of the stack, with system applications and services below. Below this lies the OS and firmware. All of the elements found within these layers can malfunction or go down, causing trouble for your business. To avoid this, companies use system monitoring tools to ensure that they stay on top of what’s happening within their system.
Today, we’ll be going over the best system monitoring tools to ensure that you’re constantly updated about the state of your system.
Why Do I Need System Monitoring?
When users spot a performance problem within the software they’re using, they’ll rarely pinpoint where the problem is coming from. To determine this, you need to look at all layers of the application stack to find the root cause of the issue. While doing this by hand is practical in some smaller businesses, this is nigh-impossible for medium and large companies to do routine.
A system monitoring tool makes sure you can spot errors within your system long before they affect your end-users. The best of them will also make troubleshooting when an issue happens much easier. Besides this, it lets you make better use of your technician’s time.
For example, instead of relying on network technicians to constantly monitor all aspects of your system, you can simply have them glance at the tool’s dashboard whenever they need a quick update.
Our Criteria
To determine the best system monitoring tools, we’ve elected to rely on a few critical criteria to ensure that you’re getting the most out of your system monitoring experience. Our primary criteria are as follows:
- Cost
- Delivery speeds
- Preventative maintenance capabilities
- Whether or not the tool has software version monitoring and patching
- How good the tool is at detecting malicious activity
- Whether or not it can help you mitigate attacks
- Virus detection and prevention
- Being able to lower costs in customer support
- Lowering the odds of system outages
- Multi-server monitoring
- UI quality
- Ease of use
Of course, many more things go into a good system monitoring tool. However, these were the criteria that we decided to use for this list.
The best system monitoring tools
1. NinjaOne – FREE TRIAL
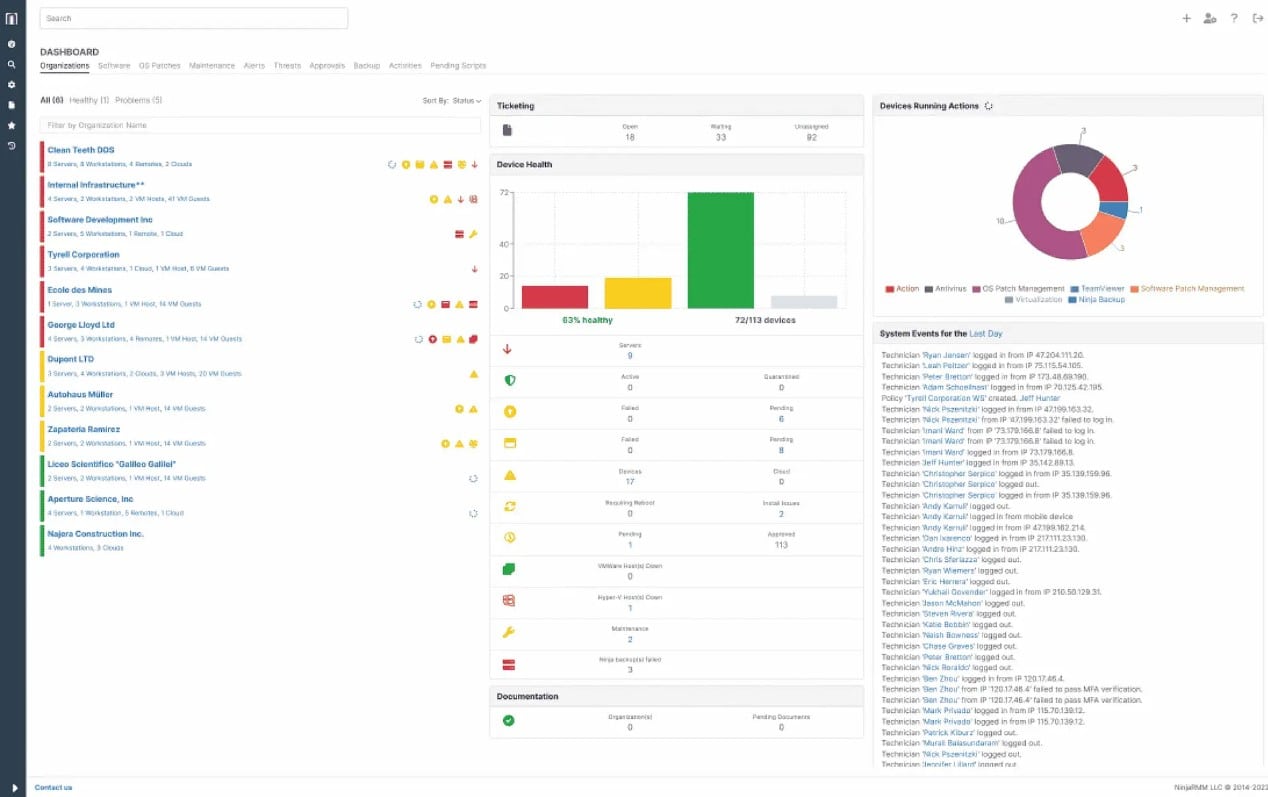
NinjaOne is an RMM and endpoint management platform that monitors all endpoints in real time and generates alerts when there are deviations from the established baseline values. It also provides the context for alerts to help with troubleshooting.
Main Features:
- Generates context-rich alerts.
- Provides insights into the health and performance of your endpoints.
- Sends automated alerts
- Comes with 100+ monitoring templates.
- Remediates issues with its automated workflows.
- Sends alerts across multiple channels.
- Offers a unified dashboard to view all data in a single place.
Why do we recommend it?
We highly recommend NinjaOne for its unified approach to system monitoring. Its agents automatically gather data from every endpoint and analyze it to assess the health and performance of each device. These values are compared against the established baseline values, and in case of deviations, it sends alerts across multiple channels.
NinjaOne’s unified dashboards and context-based alerts are other reasons why we recommend this tool. Its automated workflows come in handy as well for issue remediation.
Who is it recommended for?
It is recommended for organizations that have large and diverse environments. It is also a good choice for MSPs who manage multiple clients.
Start a 14-day free trial.
EDITOR'S CHOICE
NinjaOne is our top choice for system monitoring because of its comprehensive coverage and advanced features. To start with, it is simple to install and use. All the information about your endpoints is displayed through a single pane, making it easy to have complete control and visibility over your environment. Its automated workflows provide remediation without manual intervention, while its context-rich alerts support troubleshooting. Due to these features, NinjaOne is the best tool on our list.
Download: 14-day FREE Trial
Official Site: https://www.ninjaone.com/freetrialform/
OS: Cloud-based
2. Atera – FREE TRIAL

Atera is an RMM (remote monitoring and management) system made for managed service providers. This heavy specialization lets it go all-out on utilities provided to its target audience. It features everything you need to have a full-fledged system monitoring experience.
Main Features:
- Made with MSPs in mind
- Monitors and manages devices remotely in real time, ensuring smooth network operations
- Tracks and manages all hardware and software assets in the network
- Capable of monitoring multiple sites at the same time
- Server, network, and application monitoring capabilities
- Excellent alerts system lets you know before a system issue occurs
- Tracks a variety of server metrics like memory, disk utilization, CPU temperature, and disk capacity
- Minimalist, intuitive UI
- Multiple pricing options
- SLA tracking
- A variety of MSP-oriented peripheral features like its Help Desk and client management utilities
- Cloud-based software
Why do we recommend it
Atera, designed specifically for Managed Service Providers (MSPs), emerged as a robust remote monitoring and management (RMM) system during our testing. Its capabilities in monitoring multiple sites, coupled with a minimalist and intuitive UI, provided MSPs with a comprehensive solution for system monitoring.
The tool allows MSP technicians to look at a client’s IT infrastructure by installing an agent on its software. It will then search through the network and log every attacked device, creating an inventory. Next, the tool will look at every endpoint and server, monitoring its health and installed software. Its equipment search and software log let the MSP adjust their contract based on what infrastructure they’re looking to watch. After all, most clients won’t have a list ready when monitoring begins.
Application performance is reliant on the statuses of the servers hosting them. This is even more important for virtualizations. Therefore, Atera can monitor various applications, such as web servers, email servers, databases, virtualizations, and many more. Of course, Atera has a monitoring module for in-house use by the MSP utilizing it. This module features contract, client, and team management features.
The tool also features a Help Desk management software, allowing for remote access and chat facilitation by technicians operating the desk. With that being said, businesses that are not either MSPs or enterprises won’t get the most out of Atera’s features.
Who is it recommended for
Atera is recommended for Managed Service Providers (MSPs) seeking a specialized system monitoring solution. Its pricing model, designed for MSPs, is less suitable for non-service provider businesses. The tool’s emphasis on contract, client, and team management makes it an ideal choice for MSPs looking for an all-encompassing RMM solution.
Even Atera’s pricing model is MSP-focused, being charged per technician per month(or per year if you pick the cheaper option.) In addition, the tool offers a rather lengthy, 30-day free trial.
3. Site24x7 – FREE TRIAL
Site24x7 is a cloud platform of system management tools. It is able to monitor network devices, servers, cloud platforms, applications, middleware, virtualizations, network traffic, and websites. The package also includes log management.
Main Features:
- Cloud hosted
- Full stack monitoring
- Physical and virtual system monitoring
- Provides a cloud-resident console that is accessible through any standard Web browser
- Simultaneously monitors all the technologies on a site and on cloud platforms
- Alerts draw technicians back to the system console when things go wrong
- Log management for deeper analysis and compliance management
Why do we recommend it
During our evaluation, Site24x7’s cloud platform showcased an impressive suite of system monitoring tools, including network, server, application, middleware, and website monitoring, along with log management. The tool’s cloud-hosted nature facilitated easy accessibility and real-time updates, enhancing our ability to maintain system health.
The Site24x7 system will discover all of the assets on a site and compile an inventory. The service also provides a network topology map, so that you can see exactly where all of your assets are located. The package includes performance thresholds in each of its modules.
It also gathers system warnings and these assessments can all trigger alerts. You can get alerts forwarded to technicians by email or SMS. These alerts allow IT management staff to get on with other tasks, knowing that everything with the system is running well unless they are notified otherwise. The package provides a number of manual analysis tools, such as a data viewer in the Log Management unit and a Ping test in the Network monitoring module.
The coordination of simultaneous monitoring for all technologies on an IT system means that the platform instantly provides root cause analysis when things go wrong.
Who is it recommended for
Site24x7 is recommended for businesses of varying sizes looking for a cloud-based, full-stack monitoring solution. Its scalability and diverse monitoring capabilities make it suitable for both small and large enterprises. The tool’s performance thresholds and alerting system cater to organizations prioritizing proactive system management.
You can get the full Site24x7 platform on a 30-day free trial.
4. ManageEngine OpManager – FREE TRIAL
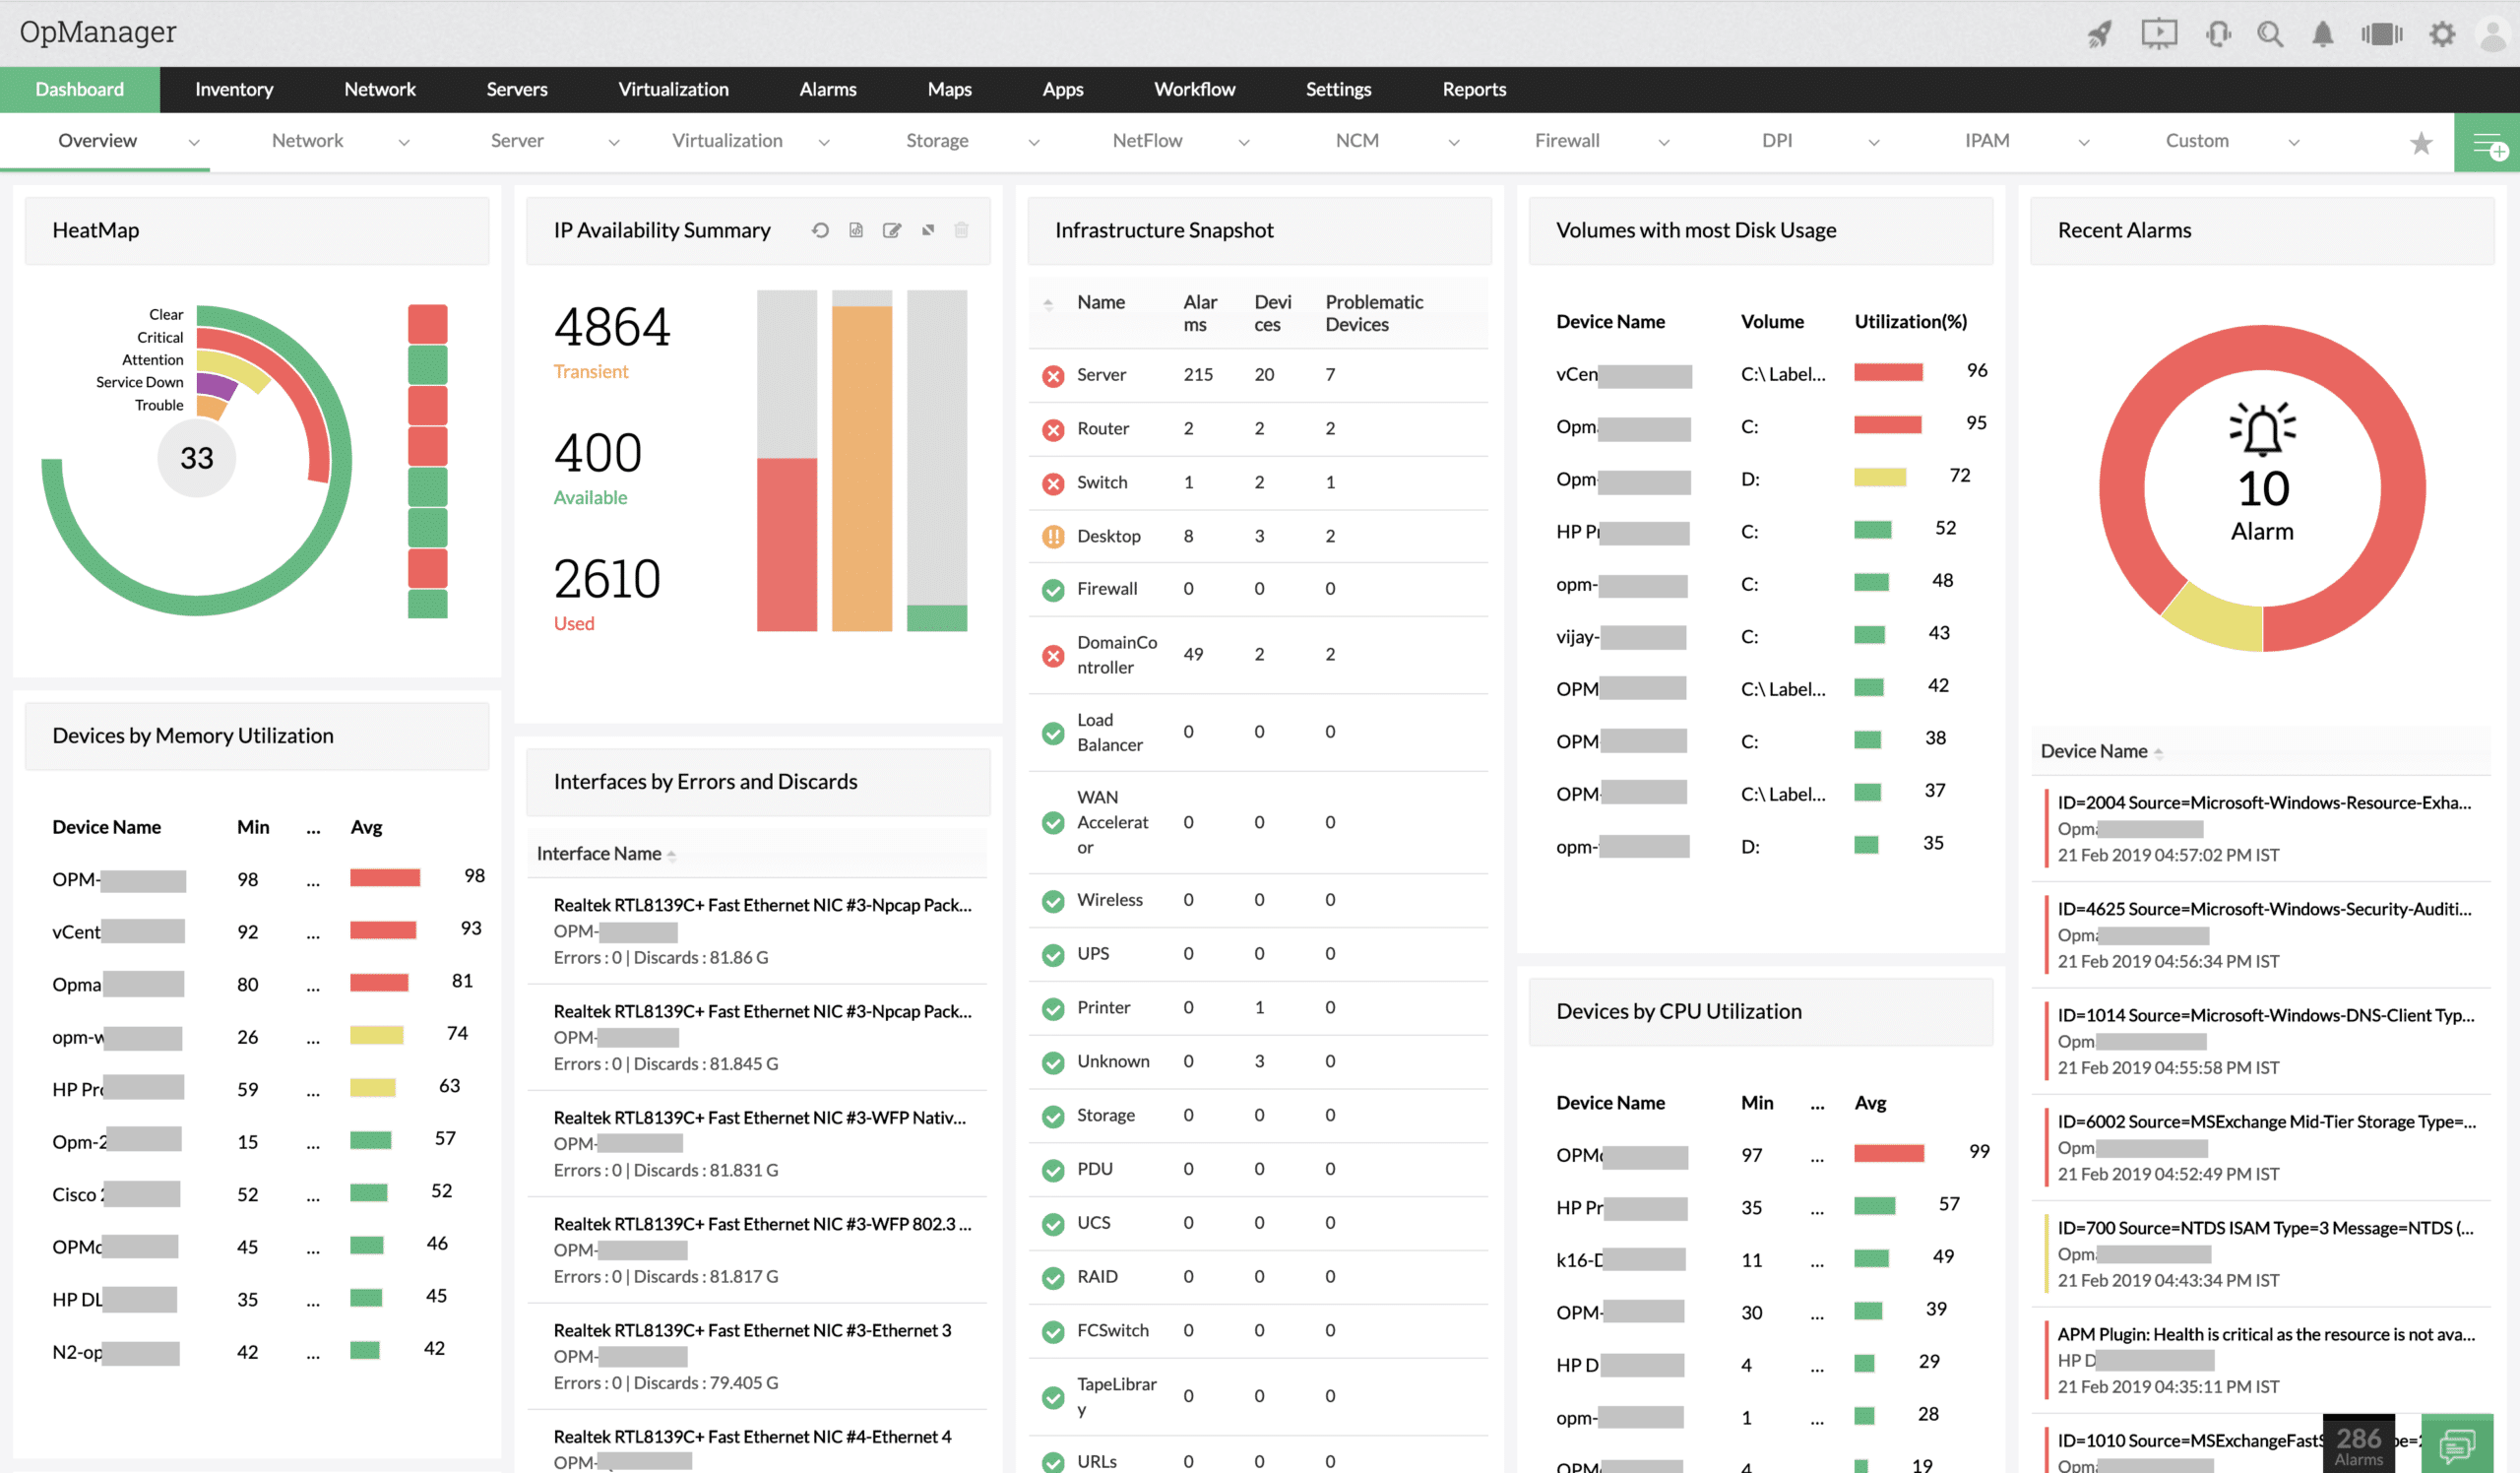
ManageEngine OpManager monitors networks and servers. The system performs a discovery service, which assembles a network inventory from the devices that it encounters in its scan. The package also creates a network topology map based on the network inventory and both documents are kept up-to-date by constant rescanning.
Main Features:
- Autodiscovery that constantly repeats and creates an inventory and topology map
- Detection of rogue devices connected to the network
- Monitoring for switches, routers, firewall, and endpoints
- Status polling with SNMP
- Processing of SNMP agent status warnings into alerts in the dashboard
- Notification of system problems by email, SMS, or Help Desk ticket
- Monitoring for virtual servers and networks
Why do we recommend it
ManageEngine OpManager stood out in our testing with its constant autodiscovery and monitoring for both physical and virtual networks and servers. The tool’s SNMP-based live monitoring provided valuable insights into system performance, while its alerting and notification system ensured timely responses to potential issues.
The tool’s ability to detect rogue devices and send alerts facilitated swift action, preventing potential security threats and optimizing overall network performance.
The live monitoring services of OpManager are based on the Simple Network Management Protocol (SNMP). Each network device has an SNMP agent installed and it is also possible to activate an SNMP agent on each endpoint. The system polls those agents for status reports at regular intervals and compiles the responses into time-series graphs and charts in the dashboard.
An SNMP agent will send out a warning if it detects a problem with its host and OpManager interprets that into an alert in the dashboard. The OpManager system can be set up to forward alerts by SMS or email and it is also possible to get it to generate a ticket for your Help Desk system.
The OpManager system will also monitor virtualizations from VMware, Hyper-V, Citrix, and Nutanix. The tool can monitor virtual networks and also test links between sites in WANs. The package provides connection testing utilities as well as automated monitoring services.
Who is it recommended for
ManageEngine OpManager is recommended for businesses seeking a versatile system monitoring solution with a focus on autodiscovery. Its support for both physical and virtual environments, along with robust SNMP monitoring, makes it suitable for organizations of varying sizes. The tool’s alerting and notification features benefit businesses prioritizing proactive issue resolution.
ManageEngine provides four editions of OpManager and the first of these is Free. However, the edition is limited to monitoring only three devices. The lowest paid edition, called Standard will monitor up to 25 devices. The top plan is designed to monitor WANs. You can assess ManageEngine OpManager with a 30-day free trial.
5. Paessler PRTG Network Monitor – FREE TRIAL
The Paessler PRTG Network Monitor is a multi-practical solution that monitors all of the servers and devices on your network, as well as network traffic and a variety of other metrics. In addition, it’s one of the most modular tools out there, following a per-sensor pricing model.
Main Features:
- Highly customizable in its alerts, dashboard, and monitoring approach
- Flexible, per-sensor pricing
- Autodiscovery features
- Extremely well integrated into the PRTG ecosystem
- Live network mapping features permit technicians
- Extremely scalable, excellent for both SMBs and enterprises
- A multitude of integrations that allow your technicians to visualize complex network setups
Why do we recommend it
Paessler PRTG Network Monitor impressed us with its modular and sensor-based approach to monitoring, allowing for high customization.
PRTG’s sensor-based architecture enabled us to tailor our monitoring strategy by selecting specific sensors, optimizing resource utilization and costs. The tool’s live network mapping and diverse protocol support, including WMI, NetFlow, and SSH, empowered us to monitor various aspects of our network with precision.
The PRTG is a sensor-based system where every sensor keeps track of one or a small set of metrics. This makes the tool insanely customizable. In addition to this, its reporting and alerts systems are fully customizable, with various presets.
The PRTG can monitor mail, web, file, database, and virtual servers. In addition to this, it can scan multiple sites at once and cloud services. It can utilize WMI, NetFlow, sFlow, ssh, ping, REST APIs, packet sniffing, and many others to ensure a seamless monitoring experience. It has a tree-based UI where you can see all of the devices on your network, all of which can be configured to be automatically detected.
In addition, the tool monitors disk space and utilization, CPU load and temperature, and a plethora of other metrics when it comes to hardware. With that being said, the tool’s setup is a tad complex, although alleviated by its setup wizard and online support.
Who is it recommended for
Paessler PRTG Network Monitor is recommended for businesses seeking a highly customizable and scalable system monitoring solution. Its per-sensor pricing model makes it suitable for organizations of different sizes, allowing them to adapt the tool to specific monitoring requirements. The tool’s versatility benefits businesses by prioritizing cost-effective and tailored system monitoring.
The tool is designed for professionals, meaning that it will be challenging to use if you lack the technical know-how. The tool is free for up to 100 sensors, and you can have unlimited sensors for a tryout period. However, its free version can easily be enough for a small business.
PRTG is available on a 30-day free trial.
6. ManageEngine EventLog Analyzer – FREE TRIAL

ManageEngine EventLog Analyzer is an advanced system monitoring tool that continuously scans your systems for any vulnerabilities. Essentially, it collects logs from different sources, standardizes them into a single format for storage, and analyzes them to find rich insights and patterns into your system’s performance. Based on these findings, you can take necessary action to improve the health and performance of your systems.
Main Features:
- Its dynamic threat intelligence feature leverages global threat detection platforms and feeds to identify attack patterns and indicators.
- Generates consolidated reports that provide information about affected hosts, policy changes, and other critical data.
The log search engine can be used for forensic analysis. - Comes with 30+ rules to correlate data in real time.
- Integrates with the MITRE ATT&CK framework to detect anomalies.
- Automates response to security events.
Why do we recommend it?
We recommend this tool because of the end-to-end visibility it provides into your systems and network environments. It helps with auditing by collecting and analyzing data across all log sources in your network to provide real-time information about potential vulnerabilities and issues in your devices.
It also correlates the analyzed data with external threat intelligence feeds to quickly detect emerging threats and protect your systems from their impact. Its detailed forensics reports can come in handy for troubleshooting and remediating issues.
Moreover, it offers automated incident response through customizable workflows. These responses act as the first line of defense and save time and effort for your technicians.
Who is it recommended for?
It is recommended for network engineers, security teams, compliance officers, IT administrators, MSPs, MSSPs, and others who are responsible for maintaining the security and performance of all the devices and systems in their organization’s network.
Download a 30-day free trial to get started.
7. Datadog Infrastructure Monitoring
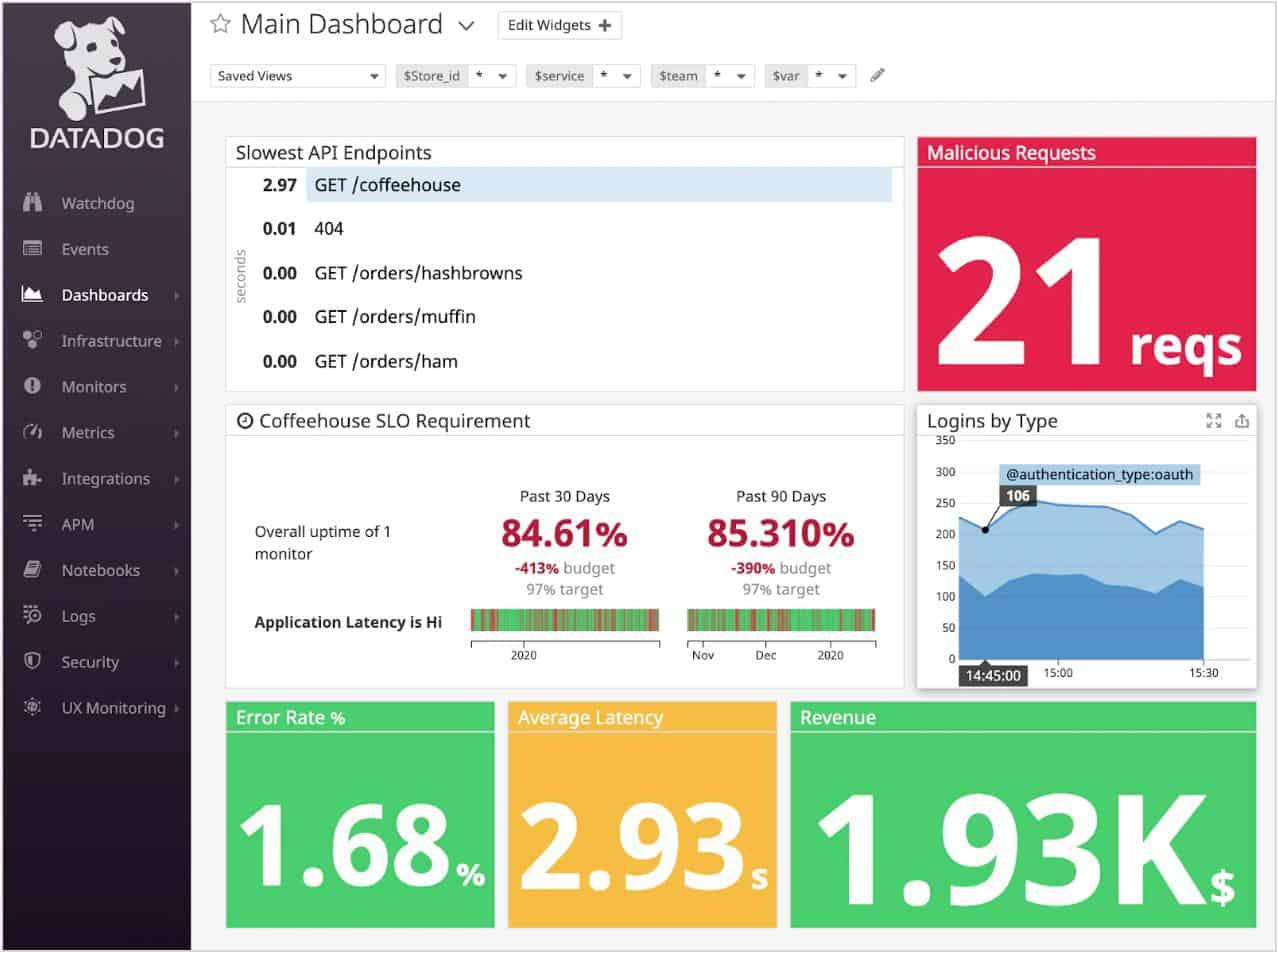
The Datadog Infrastructure Monitoring tool is a cloud-based tool that uses superb alert mechanisms to find issues within your equipment before they escalate into real problems.
Main Features:
- Extremely scalable
- Easy-to-use UI with a lot of customization options
- Internal and external monitoring capabilities
- Works well with other Datadog modules
- Very flexible pricing plan
- Its prebuilt widgets let you create highly intricate dataflows with a couple of easily integrated clicks
- Autodiscovery features
- SaaS, cloud-based platform
- Excellent alerts system that looks at both hardware and service-level objectives to make sure your system operates seamlessly.
Why do we recommend it
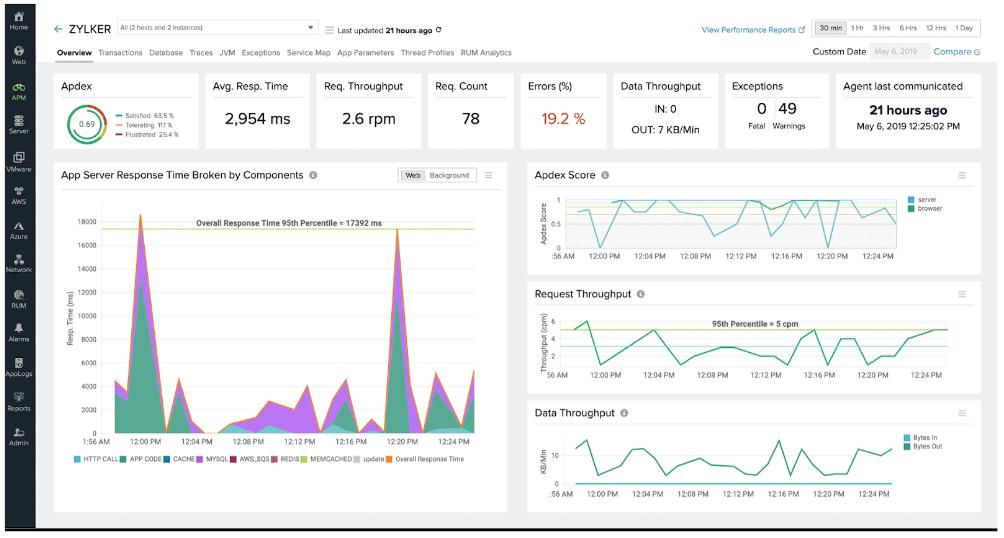
Datadog Infrastructure Monitoring, a cloud-based tool, stood out for its scalability, user-friendly UI, and extensive customization options. During our evaluation, its effective alert mechanisms and integration with other Datadog modules provided a comprehensive solution for monitoring both hardware and service-level objectives.
The tool’s SaaS, cloud-based platform facilitated seamless integration with diverse resources, enabling us to monitor systems from any location.
The Datadog system is made up of a variety of different modules. This means that you’re allowed a lot of wiggle room in customizing your system monitoring experience. Other than the Datadog Infrastructure monitor, using the Application Performance monitor will provide a lot of valuable insights for your system monitoring experience.
Each of these modules will combine seamlessly with the rest of the Datadog suite. An example of this is the Application Performance monitor providing root-cause analysis capabilities. Datadog works from the cloud and will easily integrate with local, remote, or cloud-based resources. All you need to do to have Datadog monitor a specific system is install Datadog’s agent onto it. After installing the agent, you’ll be able to monitor the system from anywhere in the world.
Who is it recommended for
Datadog Infrastructure Monitoring is recommended for businesses seeking a scalable and customizable cloud-based monitoring solution. Its flexibility caters to organizations of different sizes, from startups to enterprises. The tool’s internal and external monitoring capabilities make it suitable for businesses emphasizing comprehensive system monitoring and proactive issue detection.
The Datadog Infrastructure unit features three plans: Free, Pro, and Enterprise. The free plan is excellent for getting to grips with Datadog, while the Pro plan is ideal for SMBs. Finally, the Enterprise plan is well-designed and is at the level of most dedicated enterprise tools. With that being said, the paid versions feature only a 15-day free trial, so if you try it out, make sure to test everything you want in those first 15 days. Besides that, the tool’s pricing can be confusing, so always ask for confirmation from customer support.
8. SolarWinds Server & Application Monitor
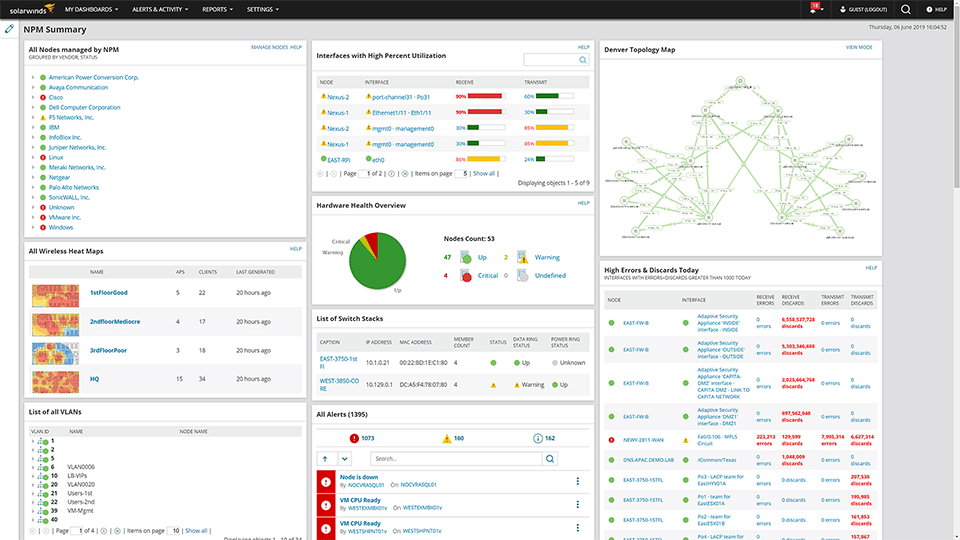
The SolarWinds Server & Application Monitor, or SAM, comes as part of Orion’s for-cost package of network system management and monitoring tools. SolarWinds is mainly geared for enterprises, meaning that it has a variety of high-level system monitoring features.
Main Features:
- Excellent autodiscovery features
- Made with an emphasis on enterprise-level features
- Creates network topology maps and inventory lists automatically in real-time based on the devices that enter your network
- Uses geographic location data to create a map of your global assets and monitor them
- Highlights bottlenecks and dependencies
- Extremely customizable dashboard
- Intuitive user interface
- Excellent reporting system with a variety of different pre-configured templates
- Robust alerts system ensures you’re kept updated on your network even while you’re away
Why do we recommend it
In our hands-on exploration, SolarWinds Server & Application Monitor proved to be an enterprise powerhouse, featuring robust autodiscovery and AI-assisted root-cause analysis. The tool’s well-designed UI, coupled with unparalleled reporting and alert capabilities, delivered a comprehensive solution. During testing, it excelled in creating real-time network topology maps, detailed reports in various formats, facilitating informed decision-making and ensuring proactive network management.
The tool has autodiscovery features that automatically find all of the hosts and devices present on your network. You can look at a myriad of metrics on its intuitively designed, fully customizable dashboard. Once the tool has completed discovery, it will launch another discovery process to find all the applications running on the nodes it discovered. Its reporting features are similarly superb, letting you generate reports in HTML, PDF, and more. In addition, these reports are well presented with graphs and tables.
The SAM has superb root-cause analysis features assisted by AI to help you find the cause of every issue. It can also be configured to scan specific sectors of your system if you focus on a smaller subset of applications. One of this tool’s best features is how easily it integrates with the rest of the SolarWinds tools. So if you’re already using a SolarWinds tool or two to monitor or manage your network, this tool will work with them seamlessly.
Who is it recommended for
SolarWinds Server & Application Monitor is highly recommended for enterprises seeking advanced system monitoring. Its emphasis on AI, autodiscovery, and global asset mapping makes it suitable for businesses with complex network infrastructures. The tool’s customizable dashboard and alerts system cater to the needs of network technicians managing large-scale environments.
The tool is quite difficult to utilize fully without a good network technician. Furthermore, an SMB will find the tool quite expensive, so unless you’ve got an extensive network, you’ll be better off going with another tool on this list. However, if you’ve got the budget for it, you won’t go wrong with SolarWinds.
The SolarWinds SAM is available on a 30-day free trial.
9. Nagios XI and Nagios Core
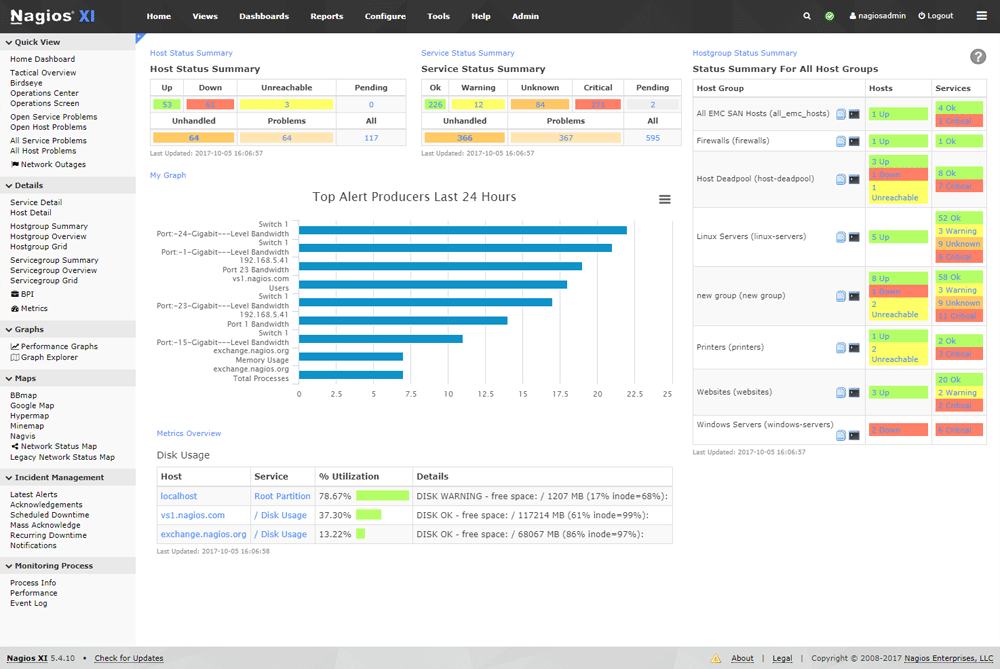
Although an older tool, Nagios is a free and open-source system monitoring solution that receives constant updates. Nagios XI is its commercial, paid counterpart that features additional features and configuration assistance. Unlike the entries so far, Nagios Core doesn’t have autodiscovery features, meaning you have to learn how to set up and maintain its complex configurations. However, various free, community-developed extensions can simplify the discovery process.
Main Features:
- Nagios Core is free and open-source
- An active community making dozens of different free extensions
- A fully-fledged system monitoring device
- Nagios XI features autodiscovery
- Extremely customizable
- The free version has the best UI out of the free tools on the market
- There’s both a free and for-cost version
- Excellent API backend makes this the best pick for developers looking to integrate their applications with it
- Lengthy free trial for the paid version
Why do we recommend it
Nagios, represented by both the free and open-source Nagios Core and its commercial counterpart Nagios XI, remains a stalwart in system monitoring. Nagios XI’s autodiscovery features and superior UI, combined with the active community supporting Nagios Core, make it a compelling choice for users seeking a versatile monitoring tool.
The tool’s active community and extensive library of free extensions facilitated customization and addressed specific monitoring needs.
The for-cost version of Nagios Core, Nagios XI, has automatic device discovery that automatically configures itself and all of its supported addons. In addition, the user interface in XI is far superior, and it has far better reporting features, capacity planning assistance, and a variety of other additional versions.
Nagios XI is made to run on Redhat Linux and CentOS. If you’re running Windows, you’ll need to use Hyper-V or VMware to help you. The Nagios XI dashboard(or Operations Screen as they call it) will provide you with a high-level view of your overall network as well as allow you to dig deeper into any specific device on it.
Who is it recommended for
Nagios XI and Nagios Core are recommended for users seeking a powerful and customizable system monitoring solution. Nagios Core, being free and open-source, caters to users with specific technical expertise, while Nagios XI’s commercial version offers additional features and support. The tool’s versatility makes it suitable for businesses of varying sizes, provided users are willing to invest time in learning its intricacies.
You can always learn Core and jump to XI later. With that being said, Nagios XI is also only available on Linux, forcing you to use a virtual machine to run it on Windows. However, the tool does feature a long extended trial of 60 days.
Closing Words
Selecting a system monitoring tool can be difficult. With so many on the market, it’s difficult to separate the good from the bad. So we’ve tried to isolate the cream of the corp in this list, trying to include something for every kind of business.
While all of these tools are excellent, each of them excels at something a little bit different. But, as always, we’ve tried to ensure that the number 1 pick is one you can’t go wrong with. In this case, Atera stands out for managed service providers, combining remote monitoring, multi-site coverage, and MSP-oriented features in a single cloud-based RMM platform. Each of these tools could still be the best tool for you, depending on your needs. If you value customizability in function and pricing, PRTG Network Monitor is an excellent choice. If you’re looking for a middle-ground solution, Datadog fits that role. Meanwhile, if you’re looking for a free solution with a paid, more streamlined version, Nagios Core and Nagios XI are there for you.
What is your favorite system monitoring tool?
What feature do you wish more tools would include in their roster?
Let us know in the comments below!