Most businesses relying on mainframes use their operating system’s native monitoring package. While this ensures that the monitoring tool and OS are compatible and interlaced, many of them lack certain features available to dedicated mainframe monitoring tools. Furthermore, each of these is only dedicated to a single machine, which makes covering multiple mainframes very difficult.
Here is our list of the best mainframe monitoring tools:
- ManageEngine OpManager Plus – EDITOR’S CHOICE An on-premises solution that aims to unify your monitoring efforts under 1 tool. It provides network management natively and integrates with other ManageEngine tools. Download a 30-day free trial.
- Site24x7 – FREE TRIAL A detailed server monitoring tool that combines data from different metrics, logs, and other sources to provide insights into the performance of servers. Using this data, you can take proactive action to troubleshoot and improve performance. Start a 30-day free trial.
- Datadog Infrastructure Monitoring This is a cloud-based tool that provides incredible versatility, value for money, and customizability.
- BMC Automated Mainframe Intelligence An excellent SaaS package made specifically for IBM z series mainframes.
- IntelliMagic Vision for z/OS Provides tools for IBM z series mainframe monitoring and facilitates mass updates across devices.
- Z-RAYS A cloud-based platform with excellent historical analysis functionalities
- ASG TMON for z/OS A highly customizable tool installed directly onto IBM series z mainframes.
Because of this, many businesses opt to go for a dedicated mainframe monitoring tool. These tools will allow you to find activity clashes, bottlenecks, and performance issues far better than a native monitoring package could. Native monitoring tools also entirely miss out on inefficiencies within network configurations.
If you’re looking to make your business more efficient and centralize device management within a single tool, you’ll need to find the right mainframe monitoring tool for you.
Common Mainframe Monitoring Issues
While mainframes provide a massive amount of processing power, if you’ve already invested in one, it’s a waste of capital to have it run at anything less than its peak performance. This means you need to keep the mainframe operational at least during business hours, with many businesses needing their mainframe around the clock. This makes scheduling updates and maintenance a matter of precision. This is where native monitoring tools fail, as they only focus on one machine, and leave you having to deal with how they all relate to each other manually.
Another common mainframe monitoring issue is the lack of demand analysis and capacity planning. You can only perform more advanced system management duties properly if you’ve got a detailed outlook of the load profile on your mainframes.
This means that for your mainframes to run at their peak performance, you need to have a full assessment of each of them, as well as their demands and maintenance cycles. Being able to finesse these factors will let you get that much more power from your mainframe.
Finally, sometimes issues can get quite complex, to the point where it would take a team weeks to discover the original cause. For this reason, many mainframe monitoring tools have root-cause analysis capabilities, to help you find out the cause of issues without spending valuable man-hours on it.
Our Criteria
There are a lot of mainframe monitoring tools on the market, each of them promising dozens of different features. However, some features carry a little more weight than others, and we’re not able to spend years with each tool to test it out in all of its use cases. Because of this, we’ve assembled a list of main criteria that guide our placement decisions:
- The tool should have packages that let you monitor multiple mainframes, aggregating their performance reports together.
- The ability to monitor how your mainframe uses up physical resources.
- Whether or not the tool is capable of creating demand forecasts.
- Tools with a free trial or demo have an edge because you can see whether or not they’re a good fit for you before committing to a purchase.
- How proportional the tool’s price is to its features.
- Tools that can track the activity on resources other than mainframes are prioritized.
The Best Mainframe Monitoring Tools
1. ManageEngine OpManager Plus – FREE TRIAL
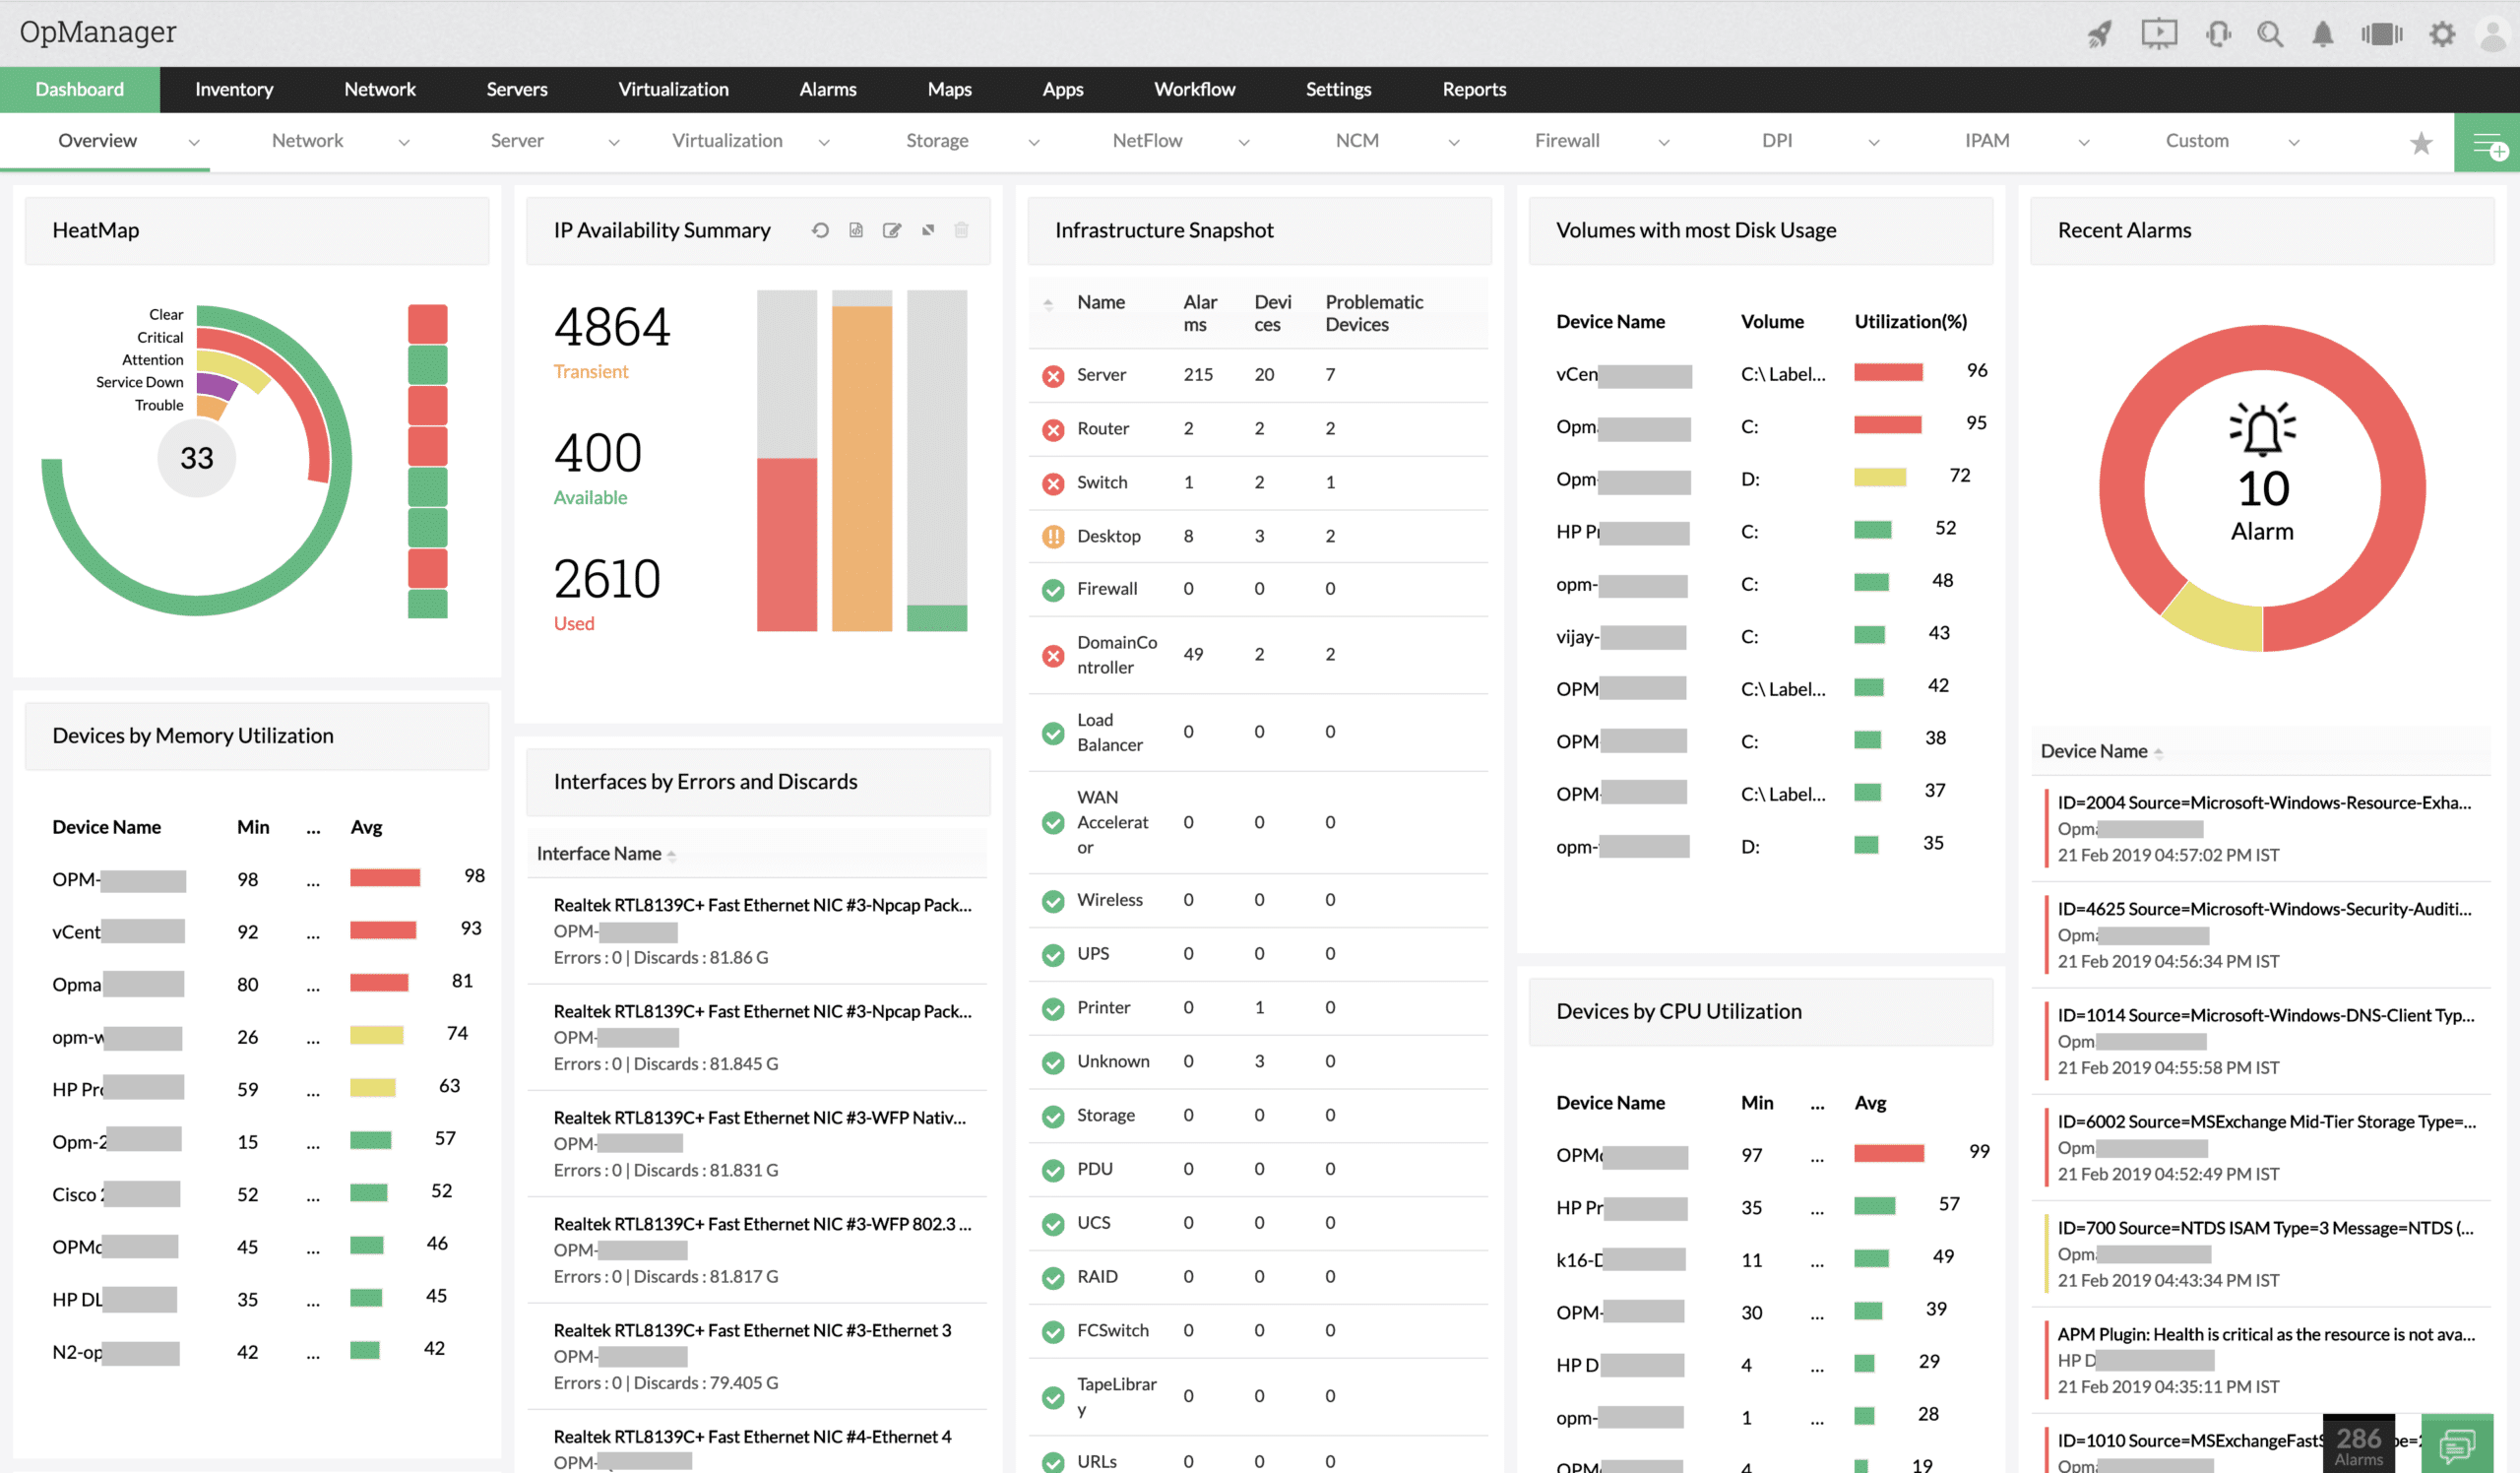
The ManageEngine OpManager Plus is an on-prem solution that looks over everything from your network to hosts and the services and apps running on them. The tool will only install on Windows and Linux machines, however, OpManager Plus can monitor all mainframes running z/OS as well as servers running other operating systems.
Main Features
- Monitoring unification
- The tool tracks physical resource utilization by IBM z mainframes
- Makes cross-platform monitoring easy
- Root-cause analysis capabilities
- Great alerts system
Why we recommend it:
In our comprehensive testing, ManageEngine OpManager Plus proved exceptionally reliable. It swiftly became our preferred tool for monitoring everything, from networks to diverse servers. It didn’t just perform tasks; it simplified the process of overseeing IBM z mainframes alongside other servers. OpManager Plus efficiently identified and resolved network bottlenecks, ensuring smoother operations and addressing potential disruptions.
IBM z series mainframes can also be monitored by the ManageEngine through a network. You can also monitor Azure and AWS cloud services through the tool. This makes the ManageEngine OpManager Plus one of the most versatile tools on this list.
The tool also comes with a variety of network management tools. Its IP Address Manager and Switch Port Mapper allows it to find what element of your system is causing a given issue, making troubleshooting more efficient.
You can receive alerts through email, SMS, email, or Slack. This lets the software notify you whenever it finds an issue above a certain threshold.
The unification of mainframe, virtualization, server, and network monitoring makes the OpManager Plus the ideal tool for businesses that prefer to keep everything under the same tool.
Who it’s recommended for:
OpManager Plus is well-suited for intermediate to advanced users, particularly network administrators and IT professionals familiar with diverse server environments. Ideal for small to medium-sized businesses (SMBs) and enterprises looking for comprehensive network and server monitoring solutions. Its cross-platform monitoring simplifies system management. For businesses preferring an on-premises solution, the tool’s versatility can be explored with a 30-day free trial.
EDITOR'S CHOICE
ManageEngine OpManager Plus wins the Editor’s Choice award for the best Mainframe monitoring tool because of its powerful capabilities and 360-degree views of your mainframe systems and the broader environments in which they operate. It gathers and analyzes metrics to provide code-level insights into the performance of your mainframe applications, allowing you to identify issues and troubleshoot them quickly. Moreover, you can use this data to better optimize your resources and improve the overall outcomes from every application. Detailed reports, real-time alerts, configuration management, and visual representations of analyzed data are other features that make it the best tool on our list.
Download: Start a 30-day FREE Trial
Official Site: https://www.manageengine.com/it-operations-management/
OS: Windows, Linux
2. Site24x7 – FREE TRIAL

Site24x7 is an advanced server monitoring tool that provides real-time insights into the availability and performance of your servers. It brings together data from metrics and logs, and analyzes them for specific data patterns and trends to provide visibility into issues and their root causes.
Key Features
- Generates reports and dashboards for deeper visibility.
- Comes with auto remediation capabilities.
- Sends alerts to bring key issues to your notice.
- Uses AI-driven insights to help with proactive troubleshooting.
- Integrates well with most popular systems and applications.
Why do we recommend it?
We highly recommend Site24x7 to monitor your Mainframe systems because of its ability to bring together data from different sources and analyze them for insights. It unifies metrics, logs, and events to generate business views. It also detects dependencies from relevant patterns by examining trends.
A key aspect of this tool is its use of Zia-based predictive analysis and anomaly detection that helps address problems before they impact performance. It also avoids costly downtime.
Who is it recommended for?
It is recommended for Mainframe teams and network engineers who are responsible for maintaining Mainframe systems.
Site24x7 comes in three pricing editions – Lite, Professional, and Enterprise. Get started by registering for a 30-day free trial.
3. Datadog Infrastructure Monitoring
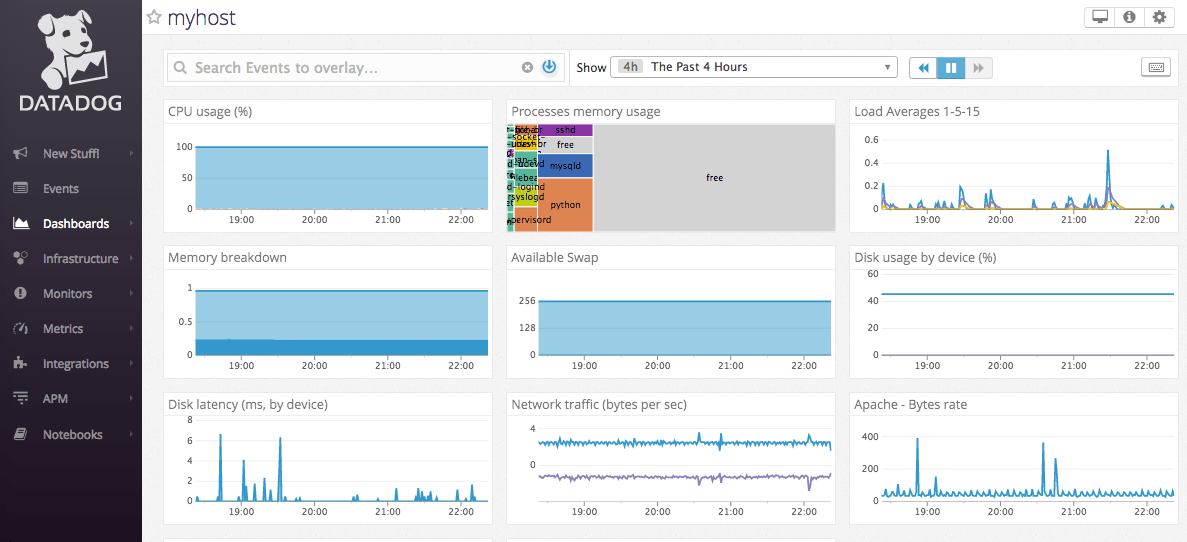
Datadog is one of the titans of the IT monitoring page. Datadog Infrastructure Monitoring is a SaaS package monitoring all of the apps and services run on your systems. It will look deep into what resources are used by which apps running on the host. While this tool doesn’t look at the network, you can use it in conjunction with any other one of Datadog’s monitoring solutions.
Main Features
- Cloud-based software.
- Easily integrates with the rest of the Datadog suite.
- Interlaces mainframe monitoring with the rest of your monitoring environments.
- Excellent alerts system.
- Security monitoring features.
- Resource utilization forecasting.
Why we recommend it:
Our extensive testing revealed Datadog Infrastructure Monitoring as a robust solution. It efficiently monitors various systems, including Fujitsu mainframes, Windows servers, and Linux machines. As a cloud-based tool, it seamlessly integrates with other Datadog suite components and excels in early issue detection. Notably, its AI-based problem detection and robust security monitoring features make it stand out. During our testing, Datadog Infrastructure Monitoring played a pivotal role in identifying and mitigating performance issues, ensuring optimal system efficiency.
The tool can monitor Fujitsu series mainframes, as well as Windows and Linux-based servers. In case you need a certain feature, you’re pretty much guaranteed to find it among Datadog’s hundreds of integrations and plug-ins. There’s a massive community around the tool, developing for-purchase and free 3rd party plug-ins to help you customize Datadog to your needs.
One plug-in like this lets you monitor IBM z series mainframes. It interlaces the IBM z mainframe and Datadog Infrastructure monitoring, letting you look at live performance data of that mainframe alongside your other mainframes from the central console.
While this plug-in, called z/IRIS is an add-on, it lets you monitor all endpoints within your networks, such as desktops running macOS, Linux, or Windows operating systems. You can also monitor cloud platforms like Azure through Datadog’s Infrastructure Monitoring system.
The tool also boasts impressive AI-based z/OS problem detection capabilities, letting you find issues that would be difficult to catch with the human eye. It also doubles as a security monitor, alerting you in case any suspicious activity occurs.
It integrates with the rest of the Datadog suite while supporting a myriad of 3rd party add-ons and extensions. It has an excellent UI, alerts system, and root-cause detection capabilities. It’ll forecast issues long before they ever impede the performance of your mainframe.
Who it’s recommended for:
Datadog is a versatile tool suitable for both beginners and advanced users, offering a user-friendly interface for newcomers and advanced features for experienced IT professionals. It’s well-suited for individuals, SMBs, and enterprises seeking a cloud-based monitoring solution with scalable features. Datadog Infrastructure Monitoring offers extensive integration options and community support. While lacking a free trial, it proves valuable for businesses requiring a comprehensive, cloud-based monitoring suite.
While both Datadog and the z/IRIS plugin are cloud-based, you’ll need to install an agent on each mainframe and a server on your network. The Datadog Infrastructure Monitor offers a 14-day free trial, while z/IRIS allows you to request a demo.
4. BMC Automated Mainframe Intelligence
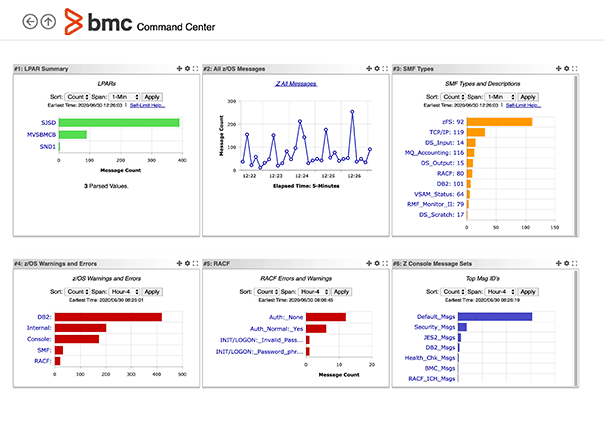
BMC AMI or Automated Mainframe Intelligence is a package of tools made specifically for monitoring IBM z series mainframes running on z/OS Unix or z/OS. It is a set of multiple modules that will help you track storage, network usage, physical resource utilization, OS performance, software performance, and more.
Main Features
- Excellent user interface and color-coded indicators
- AI forecasting capabilities
- Download and install updates automatically
- Excellent root-cause analysis capabilities
- Web-based console
- SaaS platform
Why we recommend it:
BMC Automated Mainframe Intelligence (AMI) stood out in our evaluations as a specialized tool for monitoring IBM z series mainframes. With a user-friendly interface, color-coded indicators, and AI forecasting capabilities, it excels in tracking storage, network usage, and overall system performance. The automatic download and installation of updates, coupled with effective root-cause analysis, make it a reliable choice. During our testing, BMC AMI efficiently predicted and addressed storage capacity issues, preventing potential system slowdowns.
Furthermore, with the AMI, you’re provided with a monitor for all of your network operations. Being a set of specialized tools, each of the modules within the AMI is designed with a single task in mind, and each one of them performs it well.
AMI uses artificial intelligence to forecast when your resources might get used up, in addition to predicting bottlenecks, as well as predicting when software or services are coming close to exhausting your mainframe’s available resources.
If AMI notices a problem like this, it will show you the issue in a color-code format, showing its urgency and severity, in addition to sending an alert. Because all of the modules within the tool are well-coordinated, the tool makes root-cause analysis extremely quick, helping you troubleshoot critical issues.
Who it’s recommended for:
Designed for businesses relying on IBM z series mainframes, BMC AMI is suitable for those seeking a web-based, SaaS platform. Its modules cover various aspects, including storage, network, and software performance. BMC AMI is designed for advanced users and system administrators with expertise in IBM z series mainframes and performance monitoring. The BMC AMI doesn’t offer a free trial, so we’d advise making sure that it’s the perfect tool for you before purchasing.
5. IntelliMagic Vision for z/OS
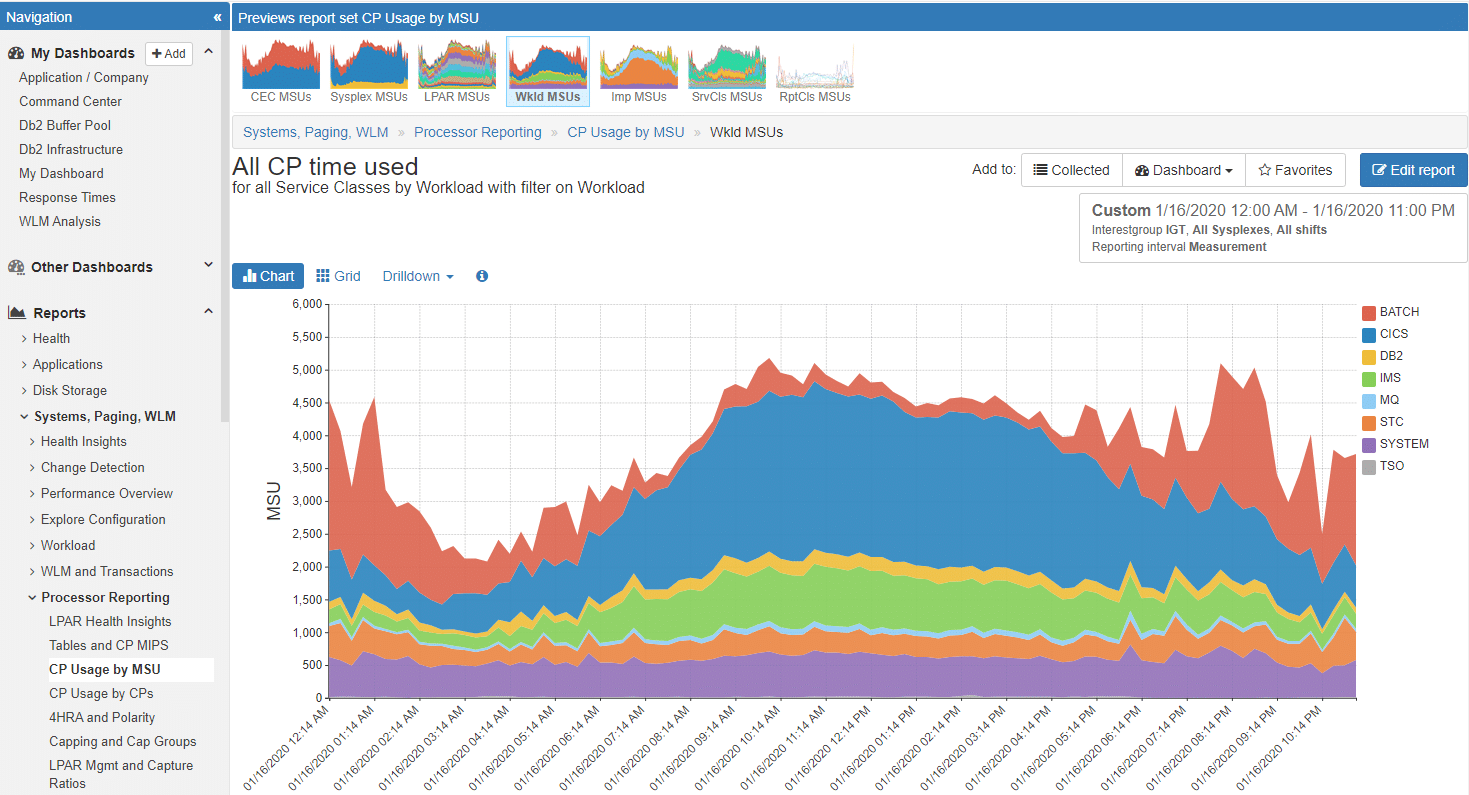
IntelliMagic Vision for z/OS is another collection of tools, made to monitor IBM z series mainframes. These tools allow you to monitor your systems for issues, as well as run out updates to multiple devices at once.
Main Features
- A variety of deployment options
- AI-based forecasting and highlighting
- Web-based console with great graphics
- Lets you look at in-depth information quickly
- Although it’s a SaaS platform, you can get the tool as a software package if you request it
Why we recommend it:
IntelliMagic Vision for z/OS offers a collection of tools designed to monitor IBM z series mainframes. With deployment flexibility, AI-based forecasting, and user-friendly web-based consoles, it facilitates in-depth information analysis. The dashboard provides a quick overview of recent events, aiding in prioritizing issues based on importance. In our testing, IntelliMagic Vision for z/OS effectively identified and addressed performance anomalies, contributing to enhanced mainframe stability.
In the dashboard, you’ll be able to see all recent events ranked by their importance. This lets you prioritize issues based on which ones are more urgent. There are also tools within the package to help you tune mainframe performance to optimal levels.
The IntelliMagic also finds changes in demands, letting you account for future resource supplies.
The IntelliMagic console has a summary screen as its counterpart. Its Change Detection view is the default panel, and it shows you how your mainframe is performing compared to the last 30 days. This helps you find drastic increases and decreases in throughput quickly. These are shown through live graphs and color-coded charts, and you can split them by source of activity if you want to take a closer look at, say, CPU usage.
Who it’s recommended for:
Tailored for enterprises relying on IBM z series mainframes, IntelliMagic Vision for z/OS is suitable for those seeking a SaaS platform with deployment options. Its focus on detailed information and change detection makes it valuable for optimizing mainframe performance. IntelliMagic Vision caters to advanced users, especially those with experience in IBM z series mainframes and detailed system analysis. However, the IntelliMagic Vision for the z/OS system can’t monitor systems outside of the mainframe, so it’s fairly narrow in its usage. The tool offers a free trial on request.
6. Z-RAYS
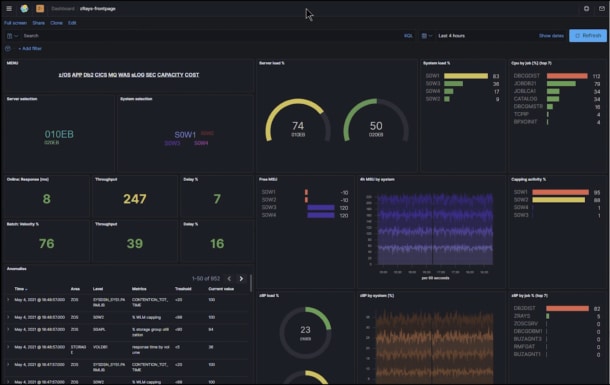
Z-RAYS is a cloud-based Software as a Service platform that excels at historical data analysis. It collects its data exclusively from IBM z series mainframes and shows you all of its performance metrics live in its console window.
Main Features
- Excellent data consolidation capabilities
- Easy to set up and use
- A variety of different activity views is available
- Extracting data from the tool is a breeze
Why we recommend it:
Z-RAYS, a cloud-based Software as a Service platform, specializes in historical data analysis exclusively from IBM z series mainframes. With excellent data consolidation capabilities and easy setup, it provides insights into performance metrics. Its configurable alert system, coupled with machine learning for detecting unusual activity, enhances mainframe security. In our testing, Z-RAYS efficiently identified and alerted us to unusual activity, contributing to a proactive approach in maintaining mainframe security.
Although Z-RAYS is a cloud-based system, it needs a few agents to be installed on the mainframe it needs to monitor. Those agents upload data from your mainframe to the Z-RAYS server in the cloud, and that’s where the tool processes it. Not only does Z-RAYS package this data to better display it, but it’ll also look at resource utilization metrics, and send you an alert if thresholds are met. It also sends alerts when you’re at or near full capacity.
The alerts don’t need to only go off when a threshold is met. You can configure Z-RAYS to use machine learning to detect unusual activity. This is the mode you should keep on when you’re looking to ensure mainframe security more than performance.
Exporting data from Z-RAYS is also incredibly simple. You can extract data from it and then analyze it in a variety of tools like Elastic Stack. You can also filter through all of the data in Z-RAYS showing info about a specific database or package running on your mainframe.
The tool is also quite customizable and easy to set up. You can set up the screens of its web-based console window so that they display the metrics you’re most interested in, rather than relying on what it does out of the box. It also has a variety of pre-set templates to get you up and running quicker.
Who it’s recommended for:
Z-RAYS is user-friendly, making it suitable for both beginners and advanced users seeking a cloud-based platform for historical data analysis on IBM z series mainframes. Designed for individuals, SMBs, and enterprises requiring historical data analysis for IBM z series mainframes in a cloud-based environment. Although there isn’t a free trial, you can try the tool by requesting a demo.
7. ASG TMON for z/OS
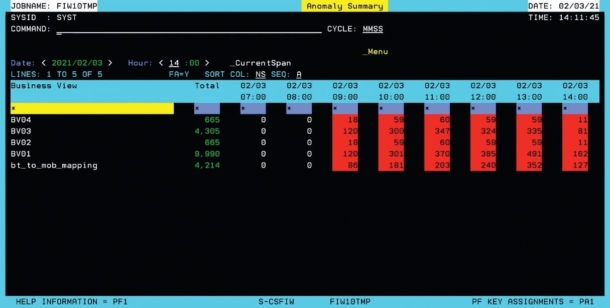
ASG TMON for z/OS is a mainframe performance monitoring tool with system management capabilities. The tool is installed directly onto an IBM z series mainframe, and can be networked from there, or set up to feed data to an external data analytics utility.
Main Features
- Data is easily extracted from the tool
- Live monitoring and analysis features
- Has multiple data display tools available
- Very customizable
Why we recommend it:
ASG TMON for z/OS stands out as a mainframe performance monitoring tool with excellent system management capabilities. Installed directly onto IBM z series mainframes, it offers live monitoring, analysis features, and high customizability. Its anomaly detection and root-cause analysis capabilities contribute to efficient issue resolution. During our testing, ASG TMON for z/OS played a crucial role in identifying and resolving performance anomalies, ensuring optimal mainframe performance.
While the AGS TMON for z/OS needs to be run on each mainframe individually, you can use an XCF, or Cross System Coupling Facility to look at data from multiple mainframes from one device. However, this view isn’t the prettiest since it relies on graphics from the OS. Because of this, most users elect to export their data through the Export and Data Extraction utilities to be able to look at their data from a more intuitive perspective.
These extractions can be run through the tool multiple times to consolidate performance metrics from a variety of mainframes. One of the best data analysis tools for it is called ASG-NaviGate, and it lets you conduct capacity planning based on the data.
The tool is excellent at detecting anomalies and conducting root-cause analysis. Whenever a problem crops up, it’ll attempt to find what caused it. NaviGate, however, requires the data extracted from ASG TMON for z/OS to provide an HTML-based GUI for the tool. You can also use NaviPlex, which runs on Windows systems, and lets you format, sort, and display data in multiple different formats.
Who it’s recommended for:
ASG TMON for z/OS is best suited for advanced users, particularly system administrators and IT professionals familiar with IBM z series mainframes. Tailored for enterprises relying on IBM z series mainframes, offering advanced monitoring and analysis features for optimized performance. The tool doesn’t offer a free trial, but a demo can be requested.
Closing Words
As always, which one of these tools is ideal for your business will depend on your needs. Your number 1 pick might be our number 5, however, we’ve tried to ensure that the first three entries have the right mix of versatility and power that you can’t go wrong with picking any of them.
The first step in deciding what Mainframe monitoring tool to go for will be looking for which tools support your mainframe’s vendor. After that, you’ll want to make a simple outline of your business needs, and from there on it should be a simple task of seeing which tool matches them closest. In general, Datadog Infrastructure Monitoring offers a lot of versatility to businesses and easily integrates with other Datadog tools which are quite common in today’s monitoring environments.
What is your favorite mainframe monitoring tool?
Is there a feature you find valuable but few tools are sporting?
Let us know in the comments below!