
Amazon Elastic Load Balancing (ELB) is the industry standard for network and application balances, with most companies using it to help them route traffic. With that being said, it isn’t enough simply to get Amazon ELB and forget about it. In order to get the best bang for your buck, you’ll need to be proficient in running an ELB health check. Today, we’ll be looking at everything you need to know about ELB health checks.
What Is The Purpose Of Amazon ELB?
Amazon ELB is a popular elastic load balancing tool that takes the traffic going through a variety of Amazon EC2 instances and distributes it without you needing to move a finger. ELB lets you add fault tolerance to apps you choose as well as route traffic better. The Amazon ELB tool consists of three different load balancers:
- Classic Load Balancer: The CLB or Classic Load Balancer is a past-generation load balancer working on the request/connection level and gives you load balancing throughout EC2 instances. You’ll find this load balancer being utilized in apps made in the EC2-classic network.
- Application Load Balancer: The ALB, or application load balancer works on the individual request level, and its purpose is routing traffic to targets in the VPC, or Amazon Virtual Private Cloud. You’ll usually find this load balancer used to balance HTTP and HTTPS traffic.
- Network Load Balancer: The NLB, or Network Load Balancer works on the connection level. Its purpose is routing traffic in the Amazon VPC. The main draw of this load balancer is its ability to tackle high volumes of traffic and is generally seen when balancing TCP and UDP traffic.
What Constitutes An ELB Health Check?
The AWS takes advantage of health checks in order to determine the availability of EC2 instances. This works through the load balancer sending a request to an instance in order to determine if it can be classed as healthy. An instance is considered healthy if it responds to a request with a 200 response code with the default health check interval for this being 30s.
If an instance doesn’t manage to do this to a given number of requests in a row, then it will be classed as unhealthy and marked as “OutOfService.”
What Makes An Instance Fail An ELB Health Check?
There’s a variety of causes for instances failing their ELB health check. Quite a few of these are caused by misconfigurations. Below, you can find the leading causes of instances failing their health checks:
- Health Check Page Errors: A HTTP GET request getting a lower response code can be caused by there being no target page configuration. Similarly, not setting the Content-Length header or not configuring your chosen app to be able to get requests from that load balancer can cause this.
- Connection Timeouts: If you’re getting a connection timeout error, that can happen due to the instance receiving too large of a load. This, in turn, causes longer response times, elapsing the timeout period.
- Not Receiving Load Balancer Traffic: It’s possible for an instance’s security group to block out traffic because of configurations blocking it from the load balancer.
- Failures In Public Key Authentication: If a load balancer that uses HTTPS or SSL fails its public key authentication, this usually happens due to the SSL certificate’s public key not corresponding with the public key of the load balancer.
- Closed Ports on the Instance: Sometimes, a health check can fail due to a firewall or port blocking it. Generally, this is due to a closed port.
Configuration Options
There are a variety of configurations you can set up for your health checks in order to check on your instances via the AWS console window. These configurations let you set up the ports, protocols, and ping paths that will be used in the health check. There are a variety of supported protocols, including the most popular ones such as HTTP, HTTPS, SSL, and TCP. All ports starting at 1 and ending at 65535 are supported as well. With that being said, there are also some other options you can take advantage of:
- Health Check Intervals: You can manually set up the duration in between each ping. The default health check interval is 30s, but you can reduce it down to 5s, or increase it up to 300s.
- Response Timeout: The response timeout option lets you configure the duration that an instance is given to respond before being marked as unavailable. The default setting is 5s, however, you can set it anywhere between 2 and 60 seconds.
- Healthy/Unhealthy Threshold: You can set up the threshold of failures that an instance must go through in a row before it is marked as unhealthy and vice-versa. This threshold can be anywhere in between 2 and 10 checks.
What Metrics Should You Be Paying Attention To?
Paying close attention to instance health is crucial due to the fact you want to ensure the ELB can scale well enough to meet your real-time demand so that your customers wouldn’t be left with a lacking user experience. The higher the number of unhealthy instances, the worse your app’s performance will be.
The main metrics you should keep tabs on are:
- UnHealthyHostCount: The count of unhealthy instances failing your health checks. You should aim to keep this under 20%.
- RequestCount: The count of requests the ELB received and directed towards EC2 instances across a time period. This helps you keep tabs on the traffic ELB is working with.
- SurgeQueueLength: The count of inbound requests that are currently waiting without being accepted by a load balancer. When there’s a lot of requests in the queue, it leads to a spike in latency.
- SpilloverCount: The count of requests rejected throughout a set time period after the SurgeQueueLength meets its cap of 1024.
- HTTPCode_ELB_4XX*: The count of 4xx errors that pop up throughout some time frame. This shows all of the requests that failed because of an unavailable service, gateway timeout, or a bad gateway.
- HTTPCode_ELB_5XX*: The count of 5xx errors that happened in some time frame. This shows you a measurement of your incorrect requests.
Checking The Health Of Instances
It’s extremely quick and easy to look through instance health through the Amazon ELB. If you want to check the health of a specific instance, all you need to do is follow these instructions:
- Open up the Amazon EC2 console window
- In the navigation pane, go to LOAD BALANCING and then “Load Balancers”
- Pick the load balancer you would like to use for the health check
- Go to the “Description” window and then view Status to get an assessment of how many in-service instances are there
- From the Instances tab, look through the “Status” column to find each specific instance’s status.
You can substitute this by going to the AWS CLI, and using the following command:
aws elb describe-instance-health –load-balancer-name my-load-balancer
Using CloudWatch To Monitor Instances
If the above feels a tad too difficult or imprecise, you can use Amazon CloudWatch to help you monitor instances instead. It collects performance data from the Amazon ELB and uses this to help you monitor the health of your EC2 instances. CloudWatch lets you set up a variety of thresholds for it to notify you of problematic behavior.
There are two ways you can use CloudWatch to monitor instances:
- Go into the Amazon EC2 console window
- In the navigation pane, go to LOAD BALANCING and then “Load Balancers”
- Pick the load balancer you would like to use for the health check
- Go into the “Monitoring” tab
- Pick a graph that outlines the metrics you would like to monitor, such as the number of healthy/unhealthy hosts, latency, number of requests, and many others.
And you’re done!
The second way to do this is by using the CloudWatch console instead, and goes as follows:
- From the navigation pane, select Metrics
- Click ELB
- Type in a metric name, load balancer, or Availability Zone in the search box that pops up in order to get the metrics on that element. For instance, if you pick a load balancer, you’ll get all of the metrics pertaining to the said load balancer.
When deciding what to use for your ELB monitoring needs, there’s an abundance of software out there, and it can be hard to make the right decision. Below, we’ve outlined our top choices for ELB monitoring software to make this easier for you.
Here’s our list of the best software to use for ELB Monitoring:
- Datalog The best ELB monitoring software by our testing. It features AWS integration, fully customizable dashboards to ensure you get only the info you need, and when you need it. It also packs an impressive suite of problem-detection capabilities with real-time alerts, in addition to a variety of other features.
- Dynatrace Excellent when you need your Amazon CloudWatch results to be presented in a graphical manner, it also features anomaly detection.
- Paessler PRTG Network Monitor Works with Amazon CloudWatch, packed with sensors, alerts, and an intuitive mobile app.
Best Software To Use For ELB Monitoring
1. Datadog
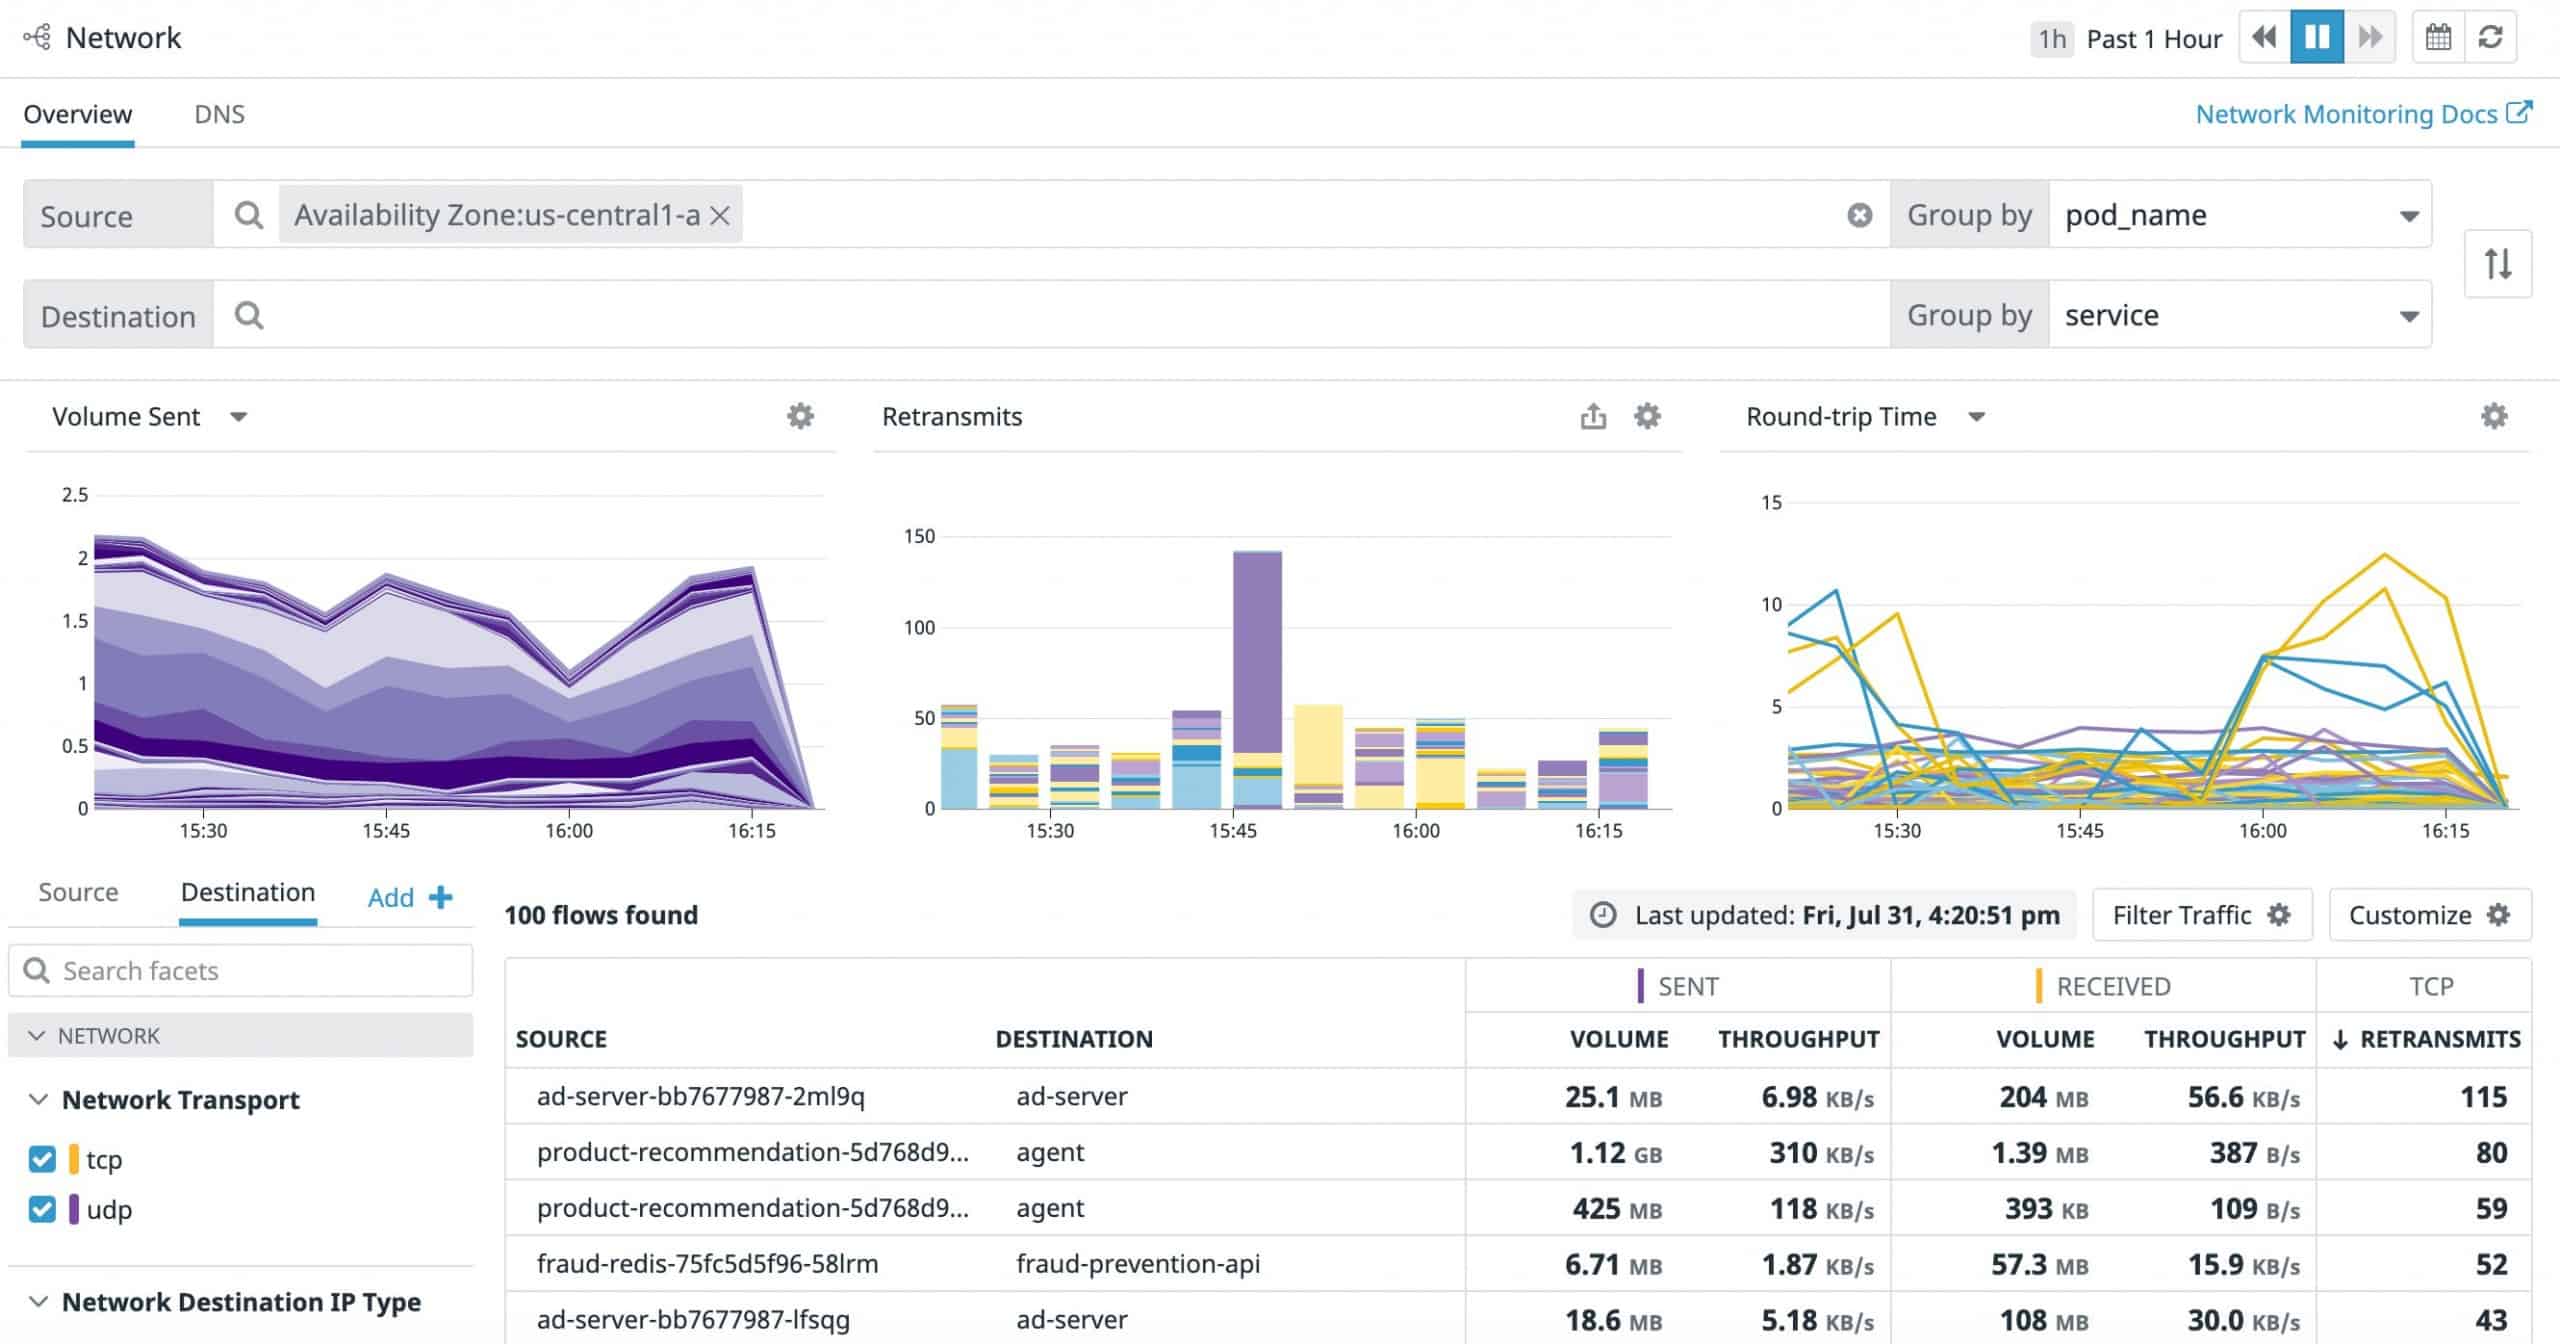
Datadog is our top pick for the best ELB monitoring software. Using this tool, you can take advantage of Amazon Web Services Integration in order to get your ELB performance metrics, as well as monitor the health and performance of every individual component through an intuitive dashboard.
The dashboard boasts a slick and user-friendly UI. You can customize it however you want, which is great when you want to focus on a few specific facets. It can also graph and chart the data, showing you factors like RPS (requests per second) and latency. There is also a great mobile app that lets ELB monitoring come to you no matter where you are.
It has the most sensitive anomaly detection software, alerting you of any unusual occurrences in real-time. Note that this doesn’t mean it’ll spam you with notifications, as its software is geared towards noticing temporary fluctuations in an effort to avoid false positives. Much like the dashboard, there’s a lot of customization you can apply to the alerts. Different thresholds, as well as different places where the software can notify you.
Price:
Datadog’s packages begin at $15 each month per host. With that being said, if you don’t want to commit to it immediately, it offers a two-week free trial as well.
Main Features:
- AWS Integrated
- Fully customizable dashboard
- Excellent anomaly detection
- Fully customizable alerts
- Easy to use mobile application
2. Dynatrace
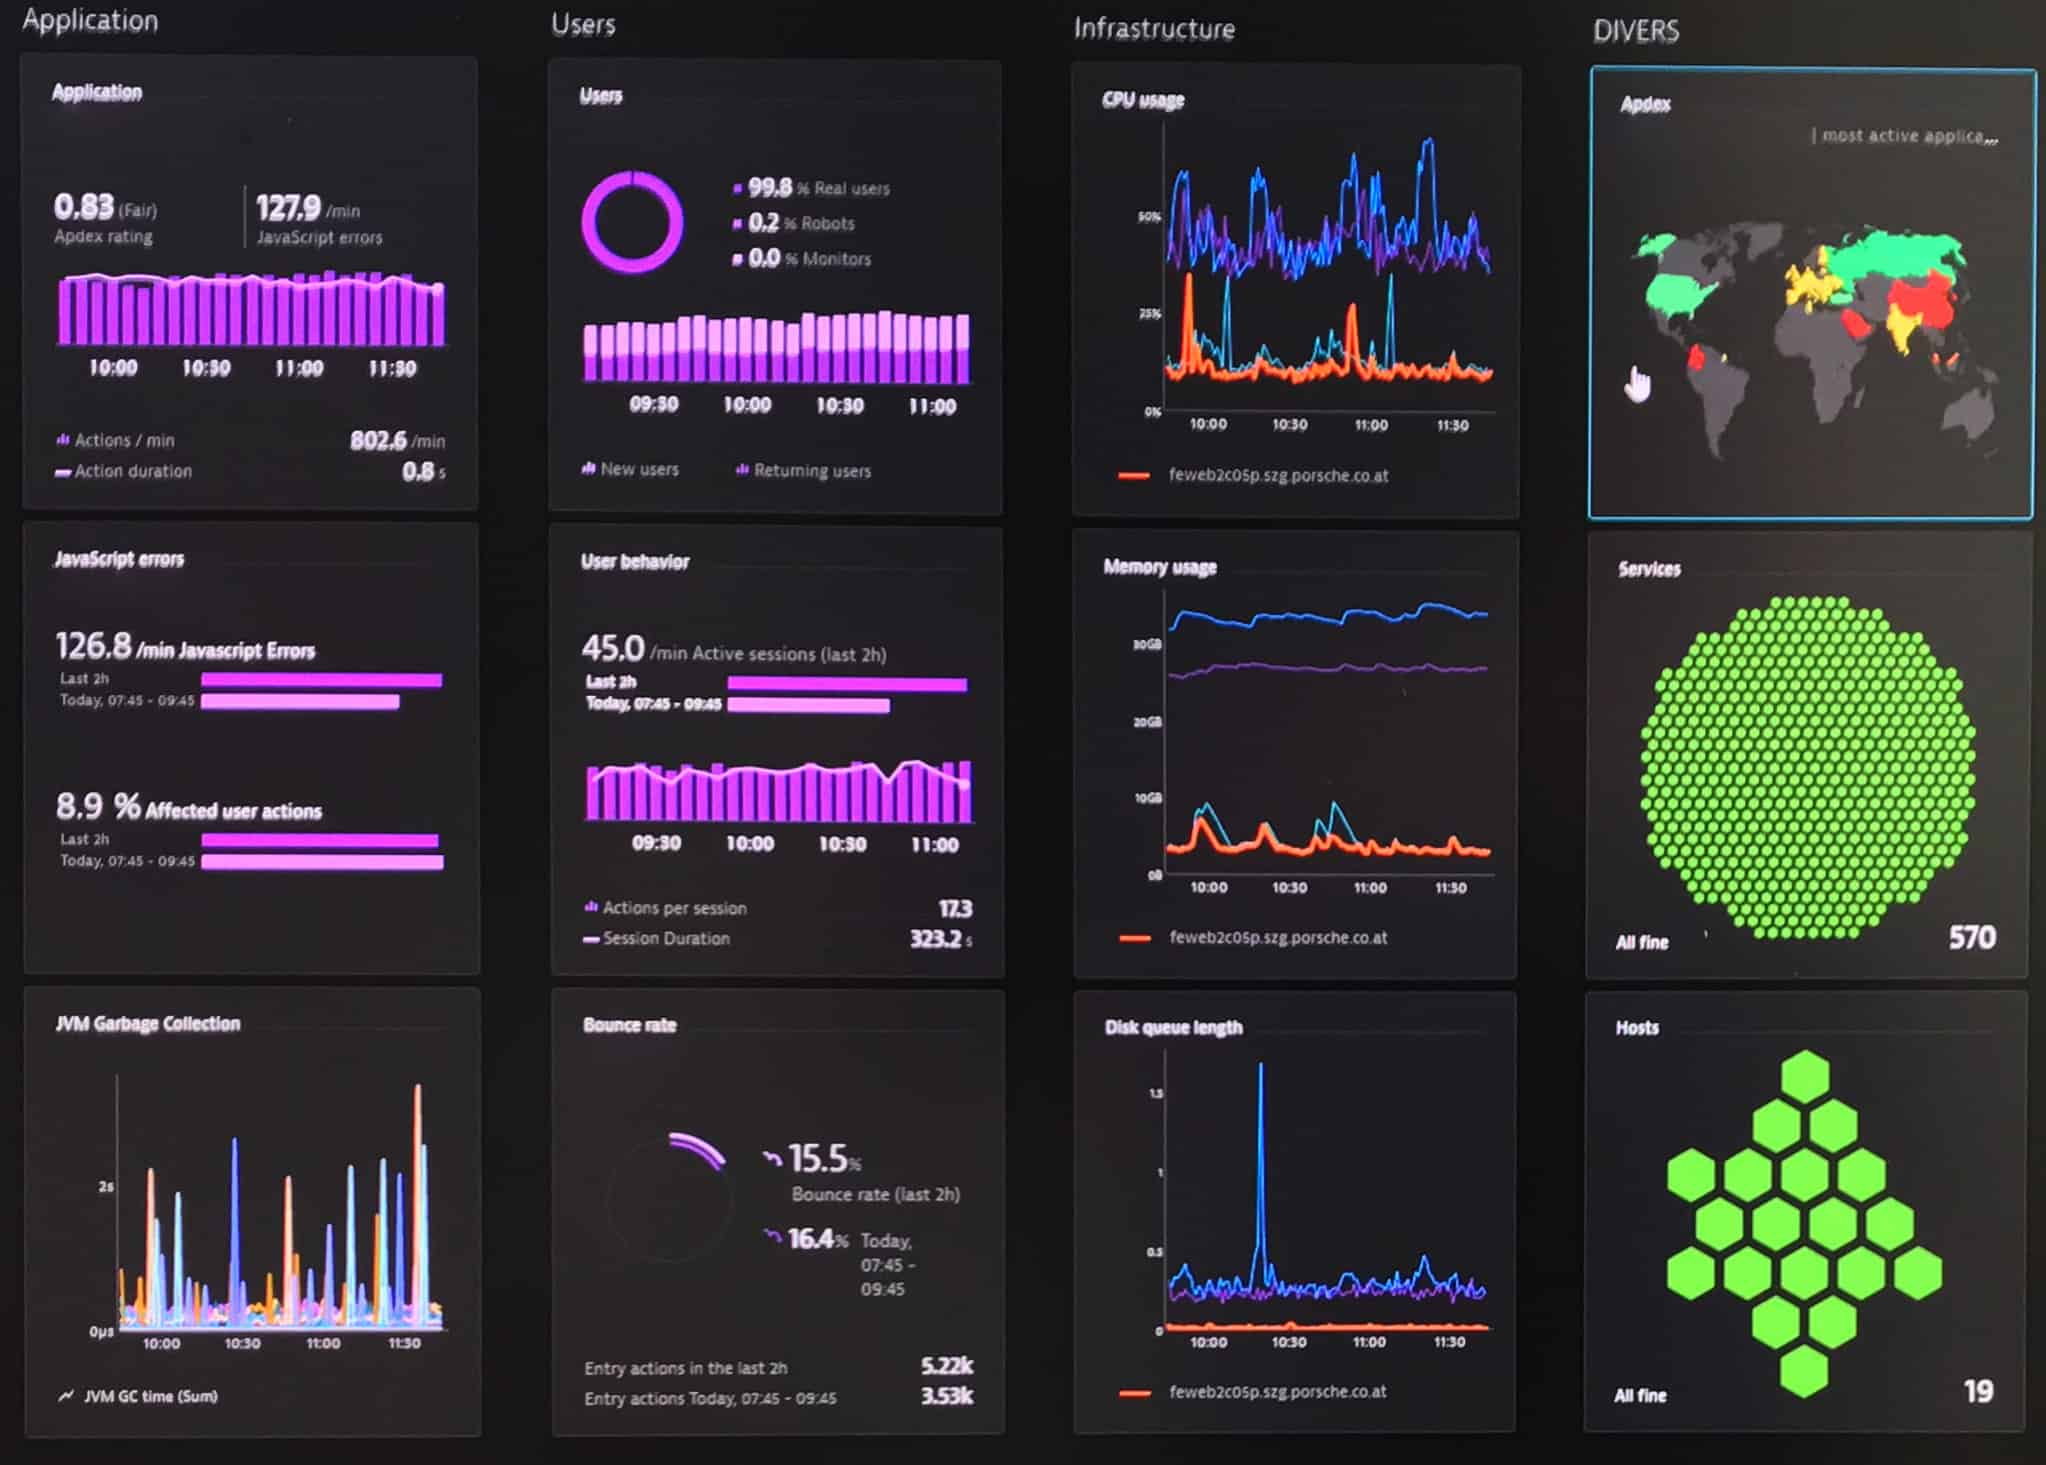
Dynatrace is another piece of software that helps you monitor your data. It works in tandem with Amazon CloudWatch to provide you with all the data you need in one place. It lets you look at a vast variety of factors quickly while prioritizing the ones that require the most attention.
The one area where we feel it performs better than Datadog is its graphing and charting functions. The graphs and charts cleverly present all that you need in an easily parsable manner. The dashboard and alert systems are also customizable, though to a lesser extent.
It also features root cause diagnosis. This means that when Dynatrace spots an anomaly, it can usually find out what is causing them. This can significantly shorten the time you spend troubleshooting.
Price:
If you’re using CloudWatch, Dynatrace is a great ELB monitoring tool. It costs $21 per month and features a 15-day trial free of charge.
Main Features:
- It integrates seamlessly with CloudWatch data
- Customizable Alerts and Dashboard
- Excellent graphing and charting functions
- Root cause detection
3. Paessler PRTG Network Monitor
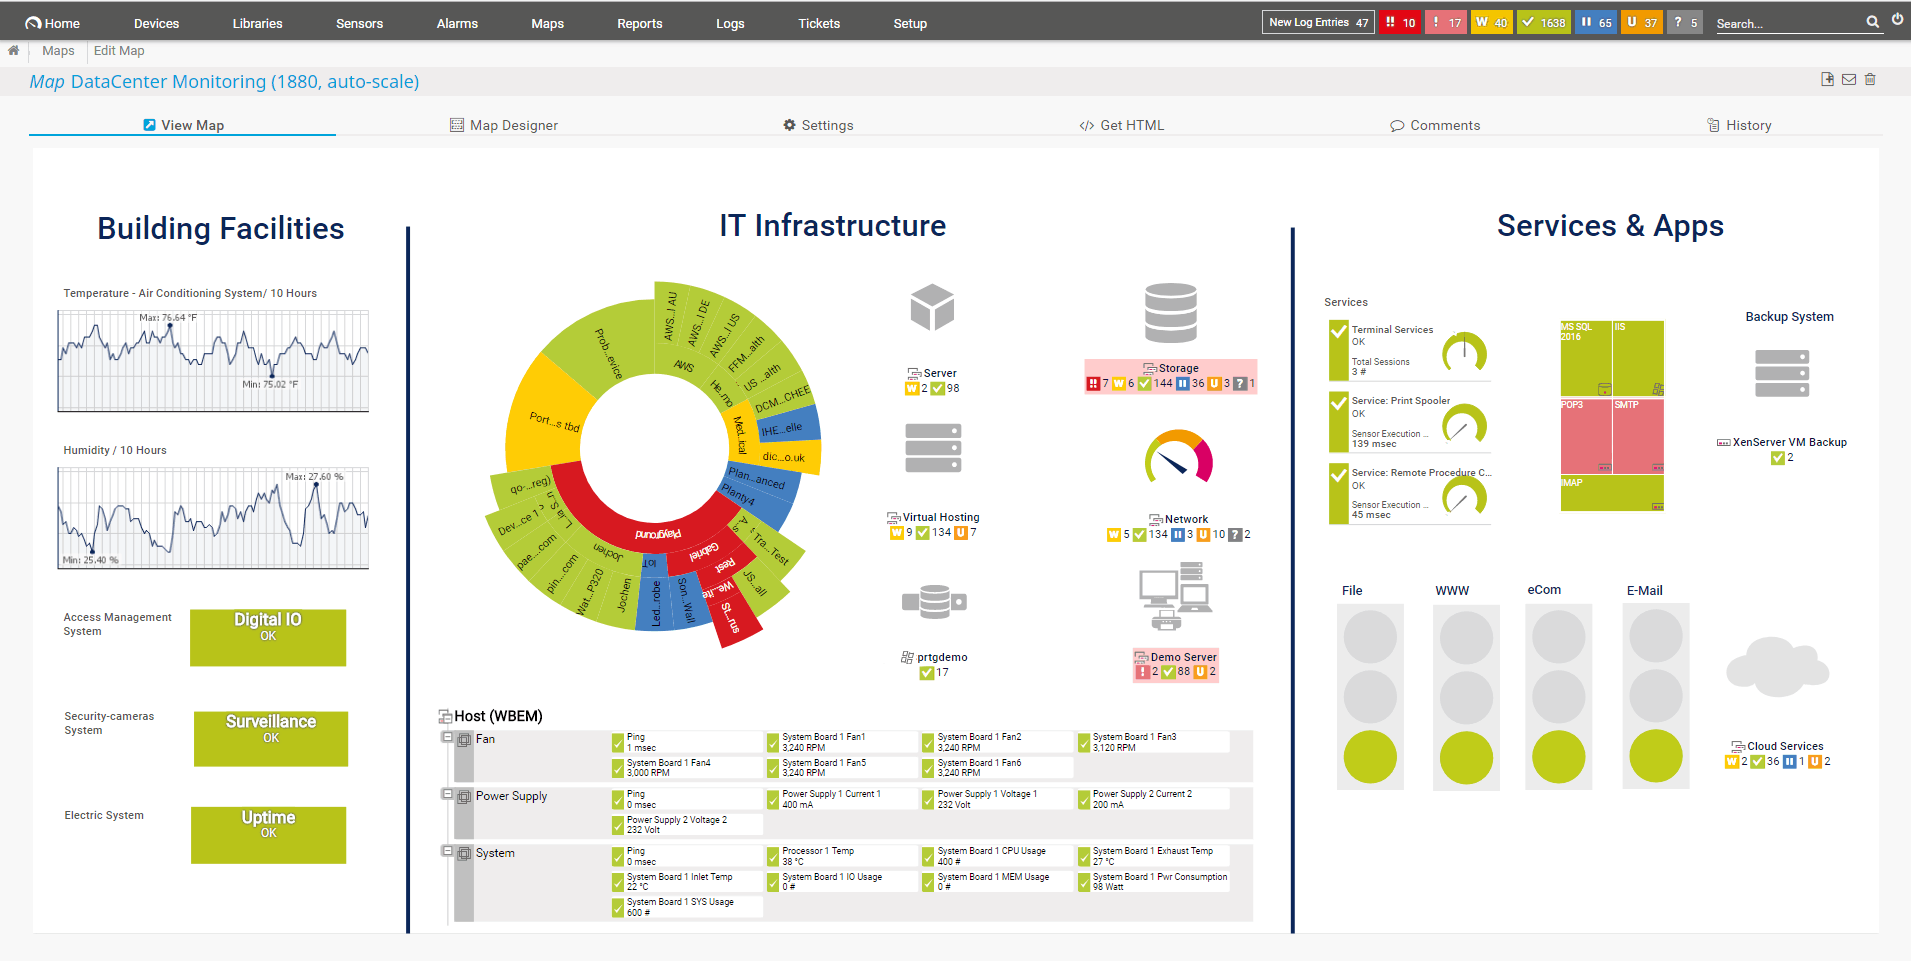
The Paessler PRTG is an excellent piece of infrastructure monitoring software capable of monitoring Amazon ELB. It has a variety of different metrics to track including Backend Connection Errors, HTTPCode Backend 2XX, and 4XX. It also has some visual dials helping you see the metrics quickly.
Its biggest flaw is that it is not as specialized as the previous two tools. If you’re looking for a more general tool that also incorporates ELB monitoring, however, then Paessler might just be the tool for you.
The reporting engine is another interesting function, allowing you to make reports in PDF, CSV, and HTML to share with others. You can also schedule these reports, as well as who they should get sent to.
Price:
The Paessler PRTG Network Monitor is a free tool for up to 100 sensors. However, once you get up to 500 sensors and up, you’ll be paying at least $1750. Besides that, the free trial lasts for a full month.
Main Features:
- Longest free trial on the list at 30 days
- Excellent reporting system
- Free up to 100 sensors
Conclusion
For anyone new to ELB, figuring out the intricacies of health checks will help in figuring out instance health monitoring as a whole. Being proactive in your approach to instance health monitoring helps you ensure you’re ready if an anomaly occurs and bring latency down to a minimum.
Picking up one of these three tools is more than enough to get you started on the path of ELB monitoring.
Did we miss your favorite tool?
Do you have any questions?
Let us know in the comments below.