
The effective Monitoring of Bandwidth and the swift identification of potential bottle-necking and congestion within networks is of unquestionable value amongst businesses today. We explore some of the Best Bandwidth Monitoring Tools and Software to ensure your network and infrastructure is at Peak throughput!
With the high demand placed on networks in ever-increasing and expanding workplaces, disruptions to workflow due to bandwidth consumption can result in dire consequences.
This is further exasperated by the emergence of higher consumption, leading to congestion, introduced by rising workplace policies of staff utilizing their own devices. Slow networks decrease productivity within an organization which invites idleness amongst employees and disrupted communication with customers.
Here is our list of the best bandwidth monitoring tools:
- SolarWinds NetFlow Traffic Analyzer – FREE TRIAL This specialized package for tracking traffic patterns uses NetFlow, J-Flow, sFlow, NetStream, and IPFIX to extract data from network devices and it can also monitor the virtual switches of VMWare. Runs on Windows Server. Download a 30-day free trial.
- Site24x7 Network Traffic Monitoring – FREE TRIAL This cloud-based service is able to monitor network traffic with the use of a local collector that communicates with switches through NetFlow, J-Flow, sFlow, IPFIX, NetStream, CFlow, and AppFlow. Start a 30-day free trial.
- ManageEngine NetFlow Analyzer – FREE TRIAL A competent network traffic monitor that has NetFlow, sFlow, J-Flow, IPFIX, NetStream, and AppFLow capabilities. Available for Windows Server and Linux. Download a 30-day free trial.
- Paessler PRTG Network Monitor – FREE TRIAL This on-site traffic monitoring utility is part of a wider bundle of monitoring systems for networks, servers, and applications. Runs on Windows Server. Start a 30-day free trial.
- SoftPerfect NetWorx A lightweight utility for home users or small businesses that offers traffic throughput statistics in live graphs. Runs on Windows, Windows Server, and macOS.
- Progress WhatsUp Gold A network traffic analysis add-on to the main network performance monitoring package. Runs on Windows Server.
The resultant loss of sales, particularly in the difficult economic climate businesses currently face, can leave lasting effects.
The tools and software designed to assist businesses with bandwidth monitoring are essential in the prompt detection and immediate rectification of problems arising within networks due to bandwidth hogs.
These tools allow for the measuring of bandwidth available on a local system and display all data collected in real-time to assist in the prevention of network strain. They offer network administrators quick and overall oversight into the network at all times, allowing faster identification of hosts using the most bandwidth, high-traffic processes, and programs.
This uncovers the root causes of issues arising with more efficiently and further supports the proactive management of bandwidth limits within the network. The tracing of outbound IP traffic is also possible, fast-tracking the discovery of any potential botnets, viruses, security breaches, and network intrusions.
The graphical representation of all relevant network data as well as detailed reports, available on demand and on specified schedules, promotes clarity in the identification of problems within the network.
Solutions therefore become attainable faster and easier, with alerts further notifying administrators immediately of issues such as the approaching of full bandwidth availability. These reports increase the ability to plan around capacity requirements, lowering the chance of failure to meet demands when extra services are potentially required.
In further aid of troubleshooting, the tools and software offering bandwidth monitoring collect and store network traffic, allowing for the observation of traffic patterns. This, as well as the options of filtering, sorting and tagging the traffic, is critical in uncovering sources of bandwidth capacity problems.
Overall, in the case of managing bandwidth within a network, the use of software and tools notably improve the monitoring and troubleshooting capabilities of administrators, thereby promoting a more stable network.
Keeping this in mind, the best bandwidth monitoring tools and software to achieve these goals are showcased below, each with their own capabilities and strengths identified. All download links and pricing structures are listed beneath each of the software and tools mentioned.
The Best Bandwidth Monitoring Tools & Software of 2024:
1. SolarWinds Netflow Traffic Analyzer – FREE TRIAL
The SolarWinds Netflow Traffic Analyzer in combination with User Device Tracker NetFlow Solutions provides administrators with direct insight into the bandwidth of their network. The monitoring software allows for the efficient troubleshooting of bandwidth issues with its policy of clear visibility, which is further assisted by its easy-to-use interface.
It supports full integration with Orion Platform products and its ability to quickly identify and notify administrators of malicious or malformed traffic flows through the use of its insights provides an overall more secure and stable network.
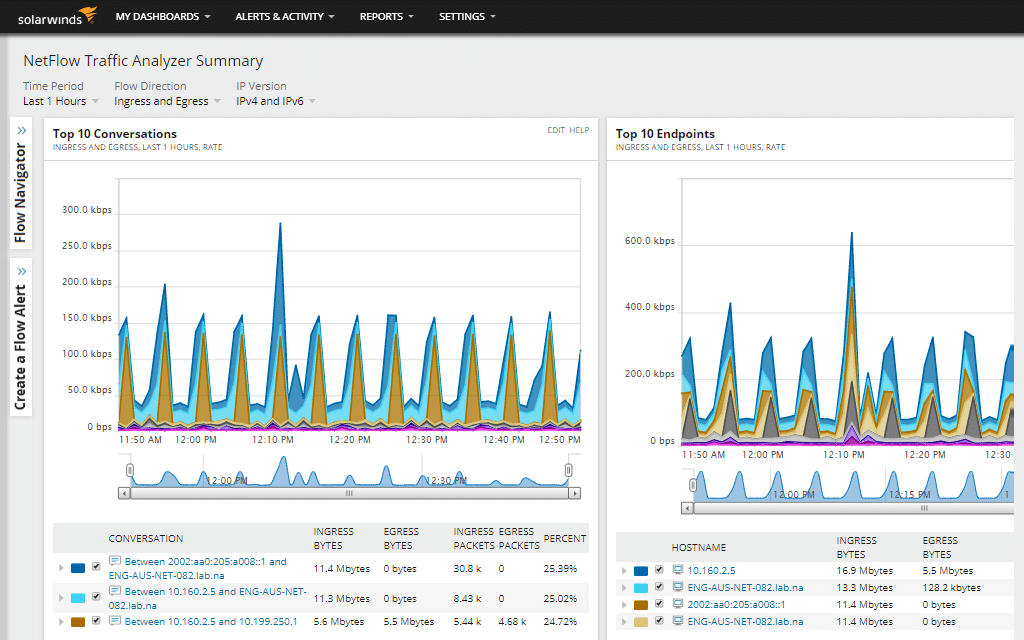
With high levels of importance placed on the smooth running of a network in business environments, SolarWinds Netflow Traffic Analyzer aims for fast traffic analysis through its dashboard. The software keeps track of the usage of all applications and clients while simultaneously prioritizing selected VolP, e-commerce or cloud-based applications crucial to the business, allowing them to pass smoothly through the network.
With Cisco Meraki wireless environments, SolarWinds Netflow Traffic Analyzer allows for the visualization of traffic flows for better bandwidth monitoring. Network traffic reports are further customizable, with the additional ability to create, schedule, and deliver these as well as detailed bandwidth reports with ease.
The software further allows administrators to measure whether the pre-policy and post-policy traffic levels are effective per class map. This provides oversight into whether policies are working as planned, and combined with the viewing of historical data, peak bandwidth usage is easily identified, allowing for the adjustment of policies for better network management.
Identification of root causes of problems within the network is made faster through the ability to drag and drop traffic data collected into usable formats. Netflow Traffic Analyzer presents the information collected in a web-based interface, providing instant visual correlation of all network data. The software will further immediately alert administrators of any sudden increase and decrease of application traffic or if it disappears completely.
Administrators can then respond timeously, fixing problems arising in bandwidth usage before end-users are affected or business processes are interrupted.
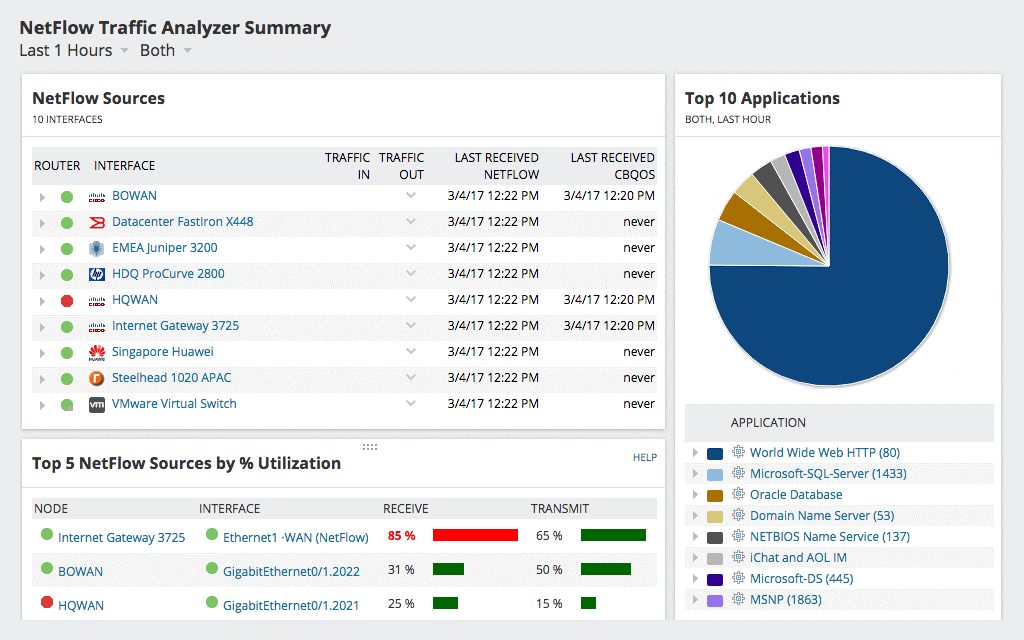
SolarWinds Netflow Traffic Analyzer allows administrators to monitor bandwidth by application, protocol and IP address group, further breaking down traffic conversations by policy when combined with the Network Configuration Manager. Insight into flow data from VMware vSphere switches has been added to the software, allowing administrators to filter out east-west traffic on specific hypervisors. This additional feature assists in the avoidance of service impacts on the network when workloads are being moved.
With the integration of SolarWinds User Device Tracker, administrators can further identify user contact information as well as switch port location, allowing administrators to enforce limits on bandwidth hogs or simply remove them from the network.
You can either find the online demo for Netflow Traffic Analyzer here or signup for a free 30-day trial here to see if this software will suit your needs.
Pricing: 30-day Free Trial, Click the Link below to Download & Get Started !
Download: https://www.solarwinds.com/netflow-traffic-analyzer/
2. Site24x7 Network Traffic Monitoring – FREE TRIAL
Site24x7 Network Traffic Monitoring is part of a cloud platform of system monitoring and management tools. This module specifically looks at volumes of network packets as they travel around the system. The Site24x7 system downloads a collector program onto the monitored network at the point of enrollment.
The flows that this system covers include reports for wireless routers and information from gateways and firewalls about the traffic volumes traveling in and out of the network over the interface to the internet.
The traffic monitor communicates with switches, routers, and firewalls using a series of protocols that enable the Site24x7 system to extract statistics or even sample packet headers. These protocols are NetFlow, J-Flow, sFlow, IPFIX, NetStream, CFlow, and AppFlow. As some manufacturers use their own proprietary protocols, such as Cisco’s NetFlow, Huawei’s NetStream, and Juniper Networks’ J-Flow, this multi-protocol capability means that the monitor can communicate with the devices provided by many different manufacturers.
The system queries individual devices and displays their current performance statistics live in the dashboard. This information is also stored to contribute to time-series graphs which show a sliding window of performance over the recent past. You are able to alter these screens and specify the time period that you want those graphs to stretch over.
A summary screen, showing the current statuses of all devices in a table is also available and an overview screen aggregates current statuses for the entire network and highlights devices that might be overloaded.
The monitor records the full capacity of each device and if volumes of traffic approach those levels, the Site24x7 system raises an alert. This tells you which part of which device is in trouble and buys you time to de-escalate the problem. Alerts can be forwarded as notifications by email, SMS, push notification, voice call, or RSS feed.
Alert thresholds are customizable. You can set the level of each threshold and also combine conditions to create your own alert conditions.
The system is able to segment traffic data so that you can see the top traffic generators. These can be identified by source or destination IP address and might include the traffic sent into the network by external devices. The tool can also display which applications use the network most.
The Site24x7 system offers integrations with project management and Help Desk systems and it is also possible to access the dashboard through iOS and Android mobile devices. The tool is marketed as part of a bundle of services.
With a typical Site24x7 package, you get network performance monitoring, network traffic monitoring, and server monitoring tools all in one deal. The bundles also include real user monitoring and application performance monitoring functions. The standard packages are sized for small businesses with additional charges for more monitoring volumes, which makes this system suitable for larger organizations.
There are many different bundles available but all of them include network traffic monitoring. You can get any package on a 30-day free trial.
Pricing: Prices start at $9 per month, charged annually.
Download: site24x7.com/network-traffic-monitoring.html
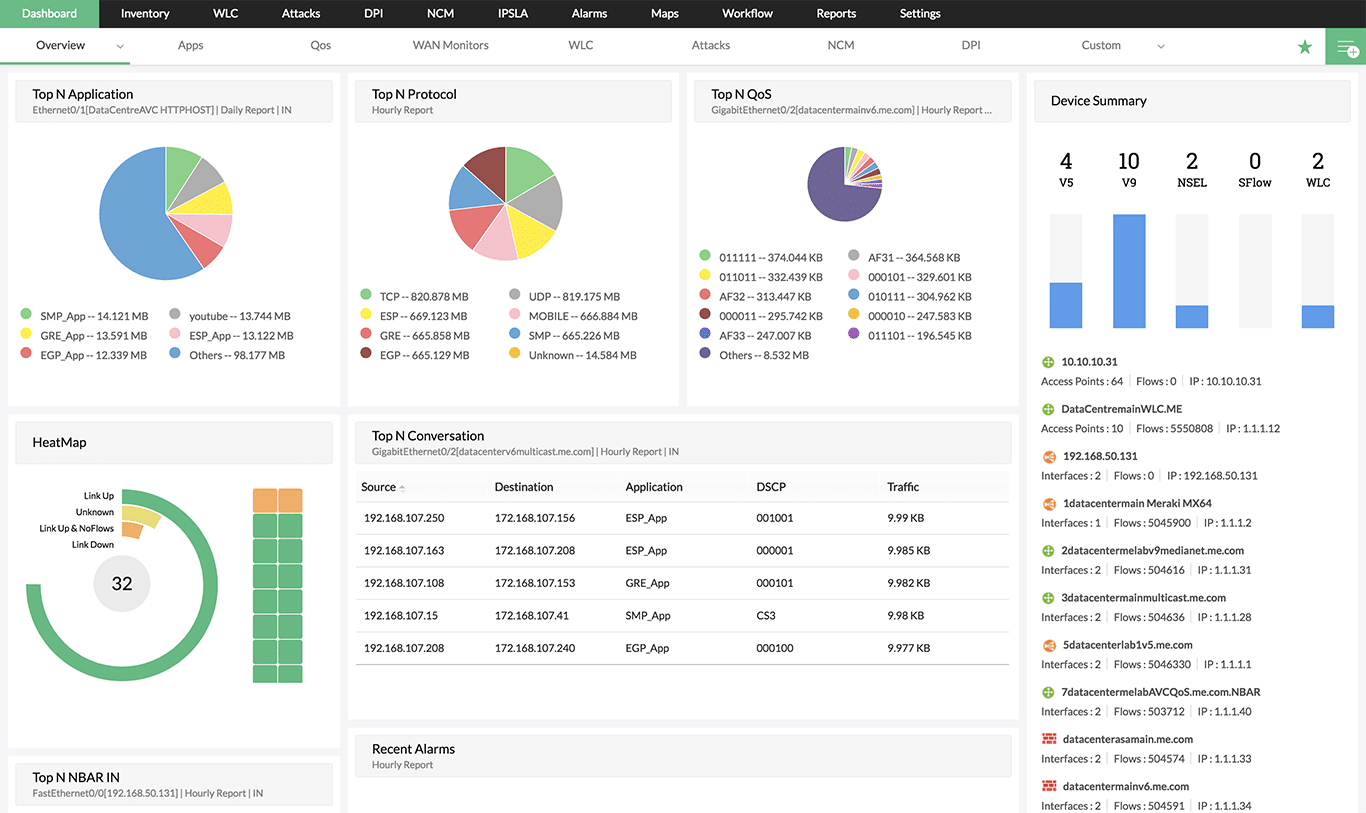
3. ManageEngine Netflow Analyzer – FREE TRIAL
With the understanding that administrators are tasked with making access to applications critical to the running of a business as effortless as possible, ManageEngine Netflow Analyzer has designed its interface to make bandwidth monitoring easy. As a flow-based monitoring tool, administrators are able to visually monitor all activity, and bandwidth usage in the network in real-time.
In the aim of resolving issues efficiently, before they affect end-users, ManageEngine Netflow Analyzer highlights which applications consume the most bandwidth as well as the top talkers in a network. In its measurement of bandwidth usage, visibility is immediately generated through its classification and categorization of the traffic monitored.
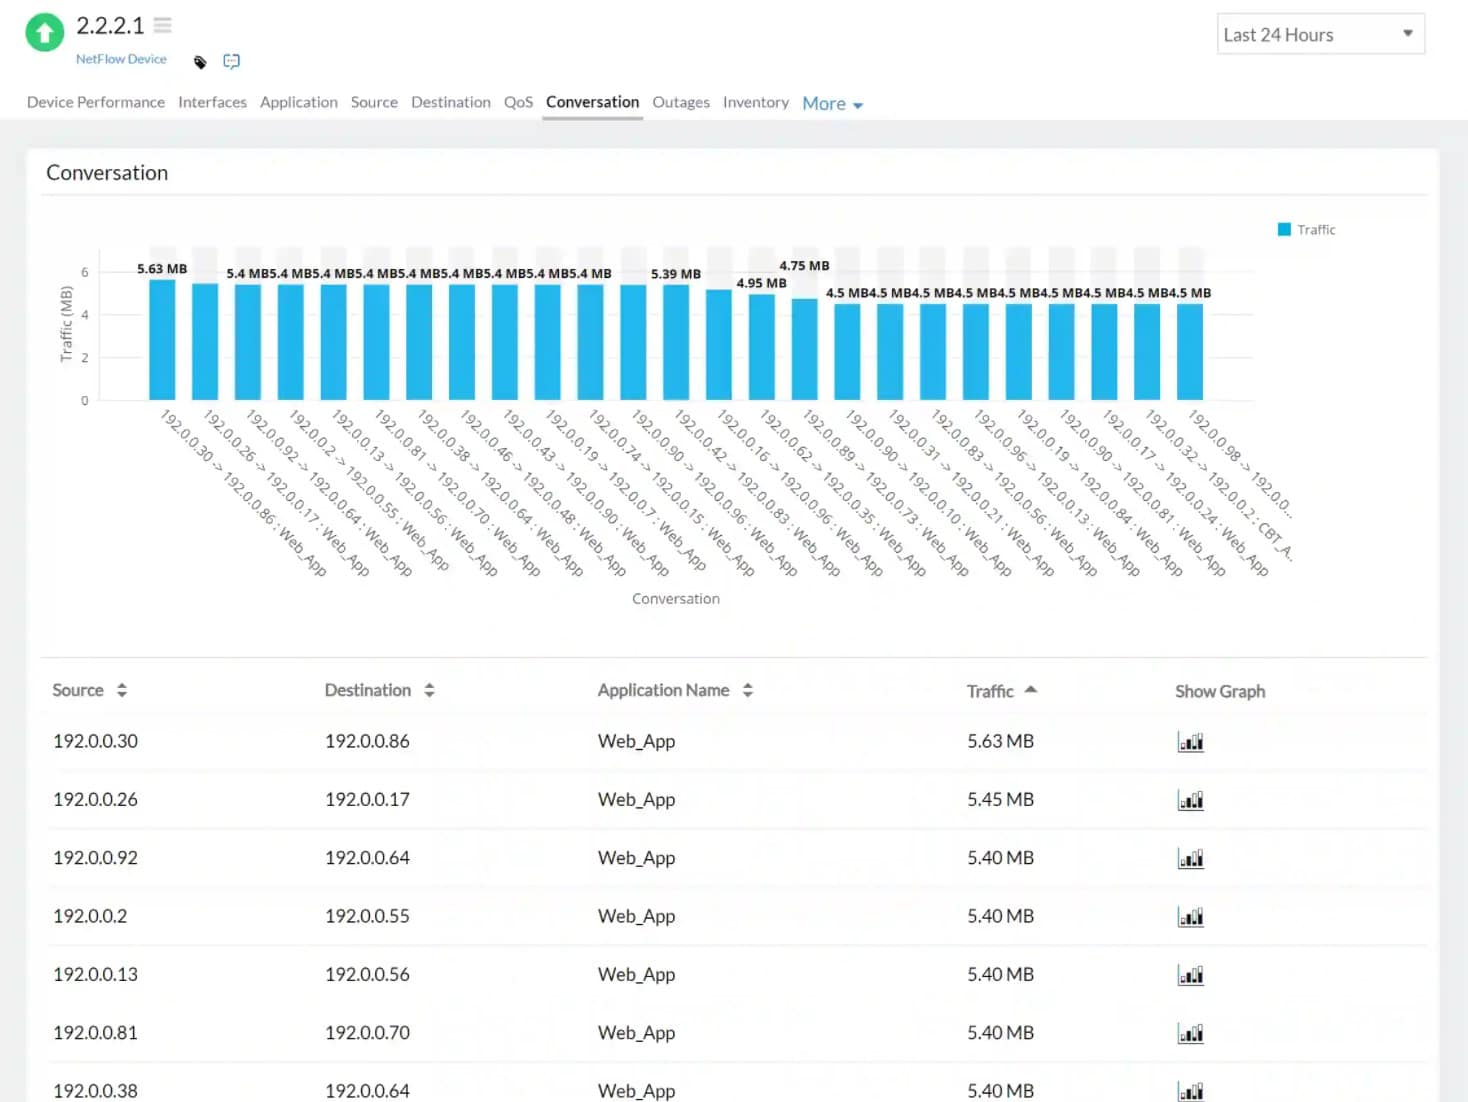
Usage of applications, interfaces, protocols, and hosts are broken down into graphs, while the bandwidth usage checker further assists administrators to drill down for a more comprehensive analysis. This involves detailed information on the consumption of top sources, conversations, and destinations, providing administrators with the ability to troubleshoot and resolve issues as they arise in less time.
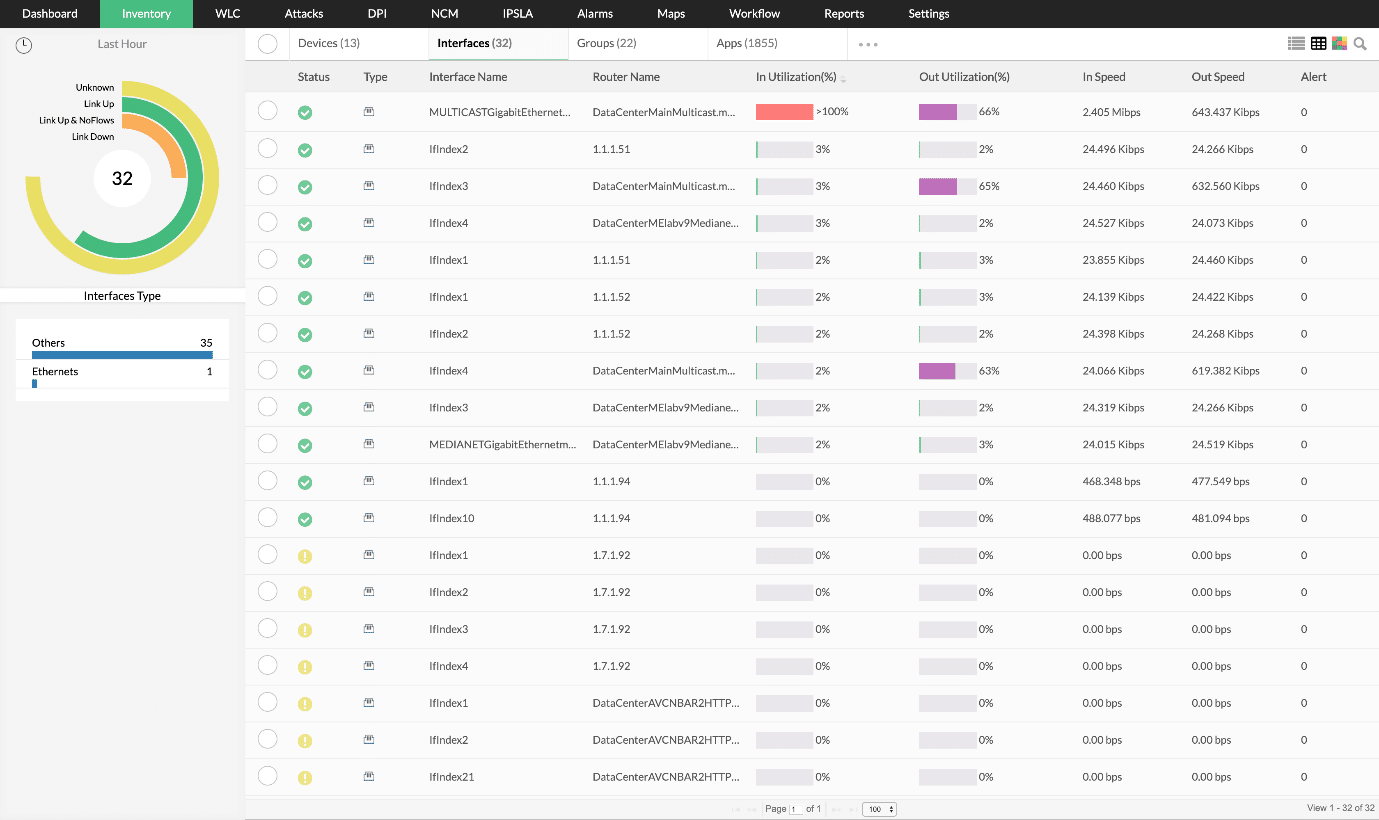
With the avoidance of bandwidth delays in mind, ManageEngine Netflow Analyzer further helps administrators identify and search specific usage details such as applications, IP addresses, protocols, and more through its use of customized reports. The addition of the ability to limit the bandwidth consumption of applications non-critical to the business makes it simpler to manage, monitor, and control bandwidth usage across the network.
The real-time traffic summary on the customizable dashboard of ManageEngine Netflow Analyzer, while detailing the top talkers in the network, also allows for an administrator to access bandwidth statistics across a particular flow-enabled interface. The current, average and the peak bandwidth usage patterns across each of these interfaces are also viewable, providing a useful overview during the identification of problematic bandwidth usage.
ManageEngine Netflow Analyzer also supports the viewing of traffic trends across a day, a week, a month or a year for the understanding of bandwidth usage patterns over specific periods of times. This grants administrators a wider overview of overall bandwidth usage in the network and will alert them when, or if, there is a need for increased available bandwidth, assisting them in capacity planning.
Administrators can also set thresholds for bandwidth utilization, receiving alerts via email or SMS if the thresholds are neared or reached. This reduces the response time to bandwidth hogs, limiting the probability of traffic spikes, and providing the assurance of a smoother, more efficiently run network.
ManageEngine Netflow Analyzer integrates NetFlow, sFlow, JFlow, and more, as well as other collection and analysis engines, while its NetFlow exports are collected, correlated, and analyzed with the aim of monitoring the usage of bandwidth across each WAN link on the network. It eliminates the need for hardware probes in the monitoring of bandwidth usage and the software is designed to suit both Windows and Linux environments.
Pricing: You can download a 30-day free trial.
Download: https://www.manageengine.com/products/netflow/download.html
4. Paessler PRTG – FREE TRIAL
A comprehensive network monitoring tool that covers the entire IT structure of a business, the Paessler PRTG Network Monitor aims to simplify the process of monitoring a network. With its central monitoring capabilities, making it easier to gain an overview of the network, it further saves time through its prompt alerts, auto-discovery features and pre-configured device templates.
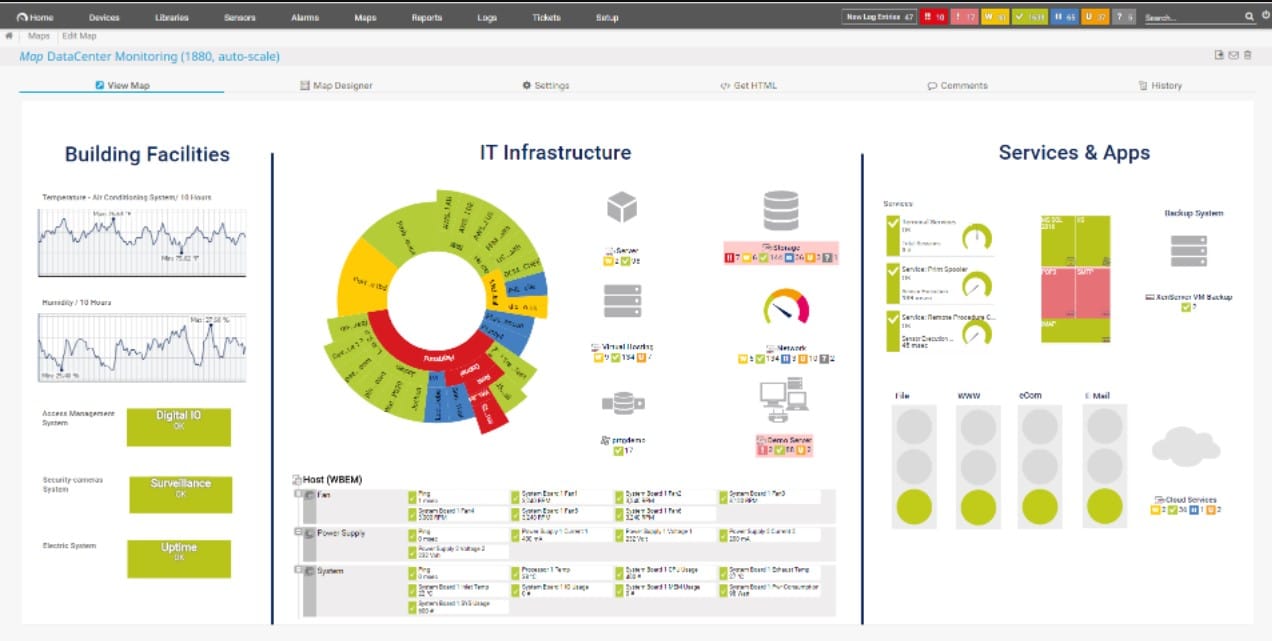
With the knowledge that bandwidth monitoring plays an integral role in the successful management of networks, PRTG Network Monitor makes monitoring easy and straight forward. While many bandwidth monitoring tools and software are limited to monitoring internet traffic on one device, the PRTG Network Monitor instead reads bandwidth data straight from the router.
The PRTG Network Monitor generates detailed statistics about the programs and services using bandwidth in the network, further identifying the potential location of bottlenecks. The collected information is then displayed in three graphs as well as top lists, allowing administrators to quickly identify usage and data transference. This covers all ingoing and outgoing traffic across the whole network, earmarking applications and servers with the highest bandwidth usage. Multiple parameters, i.e. port numbers, IP addresses, protocols and more, are utilized in the monitoring of bandwidth through the use of Packet Sniffing or xFlow sensors.
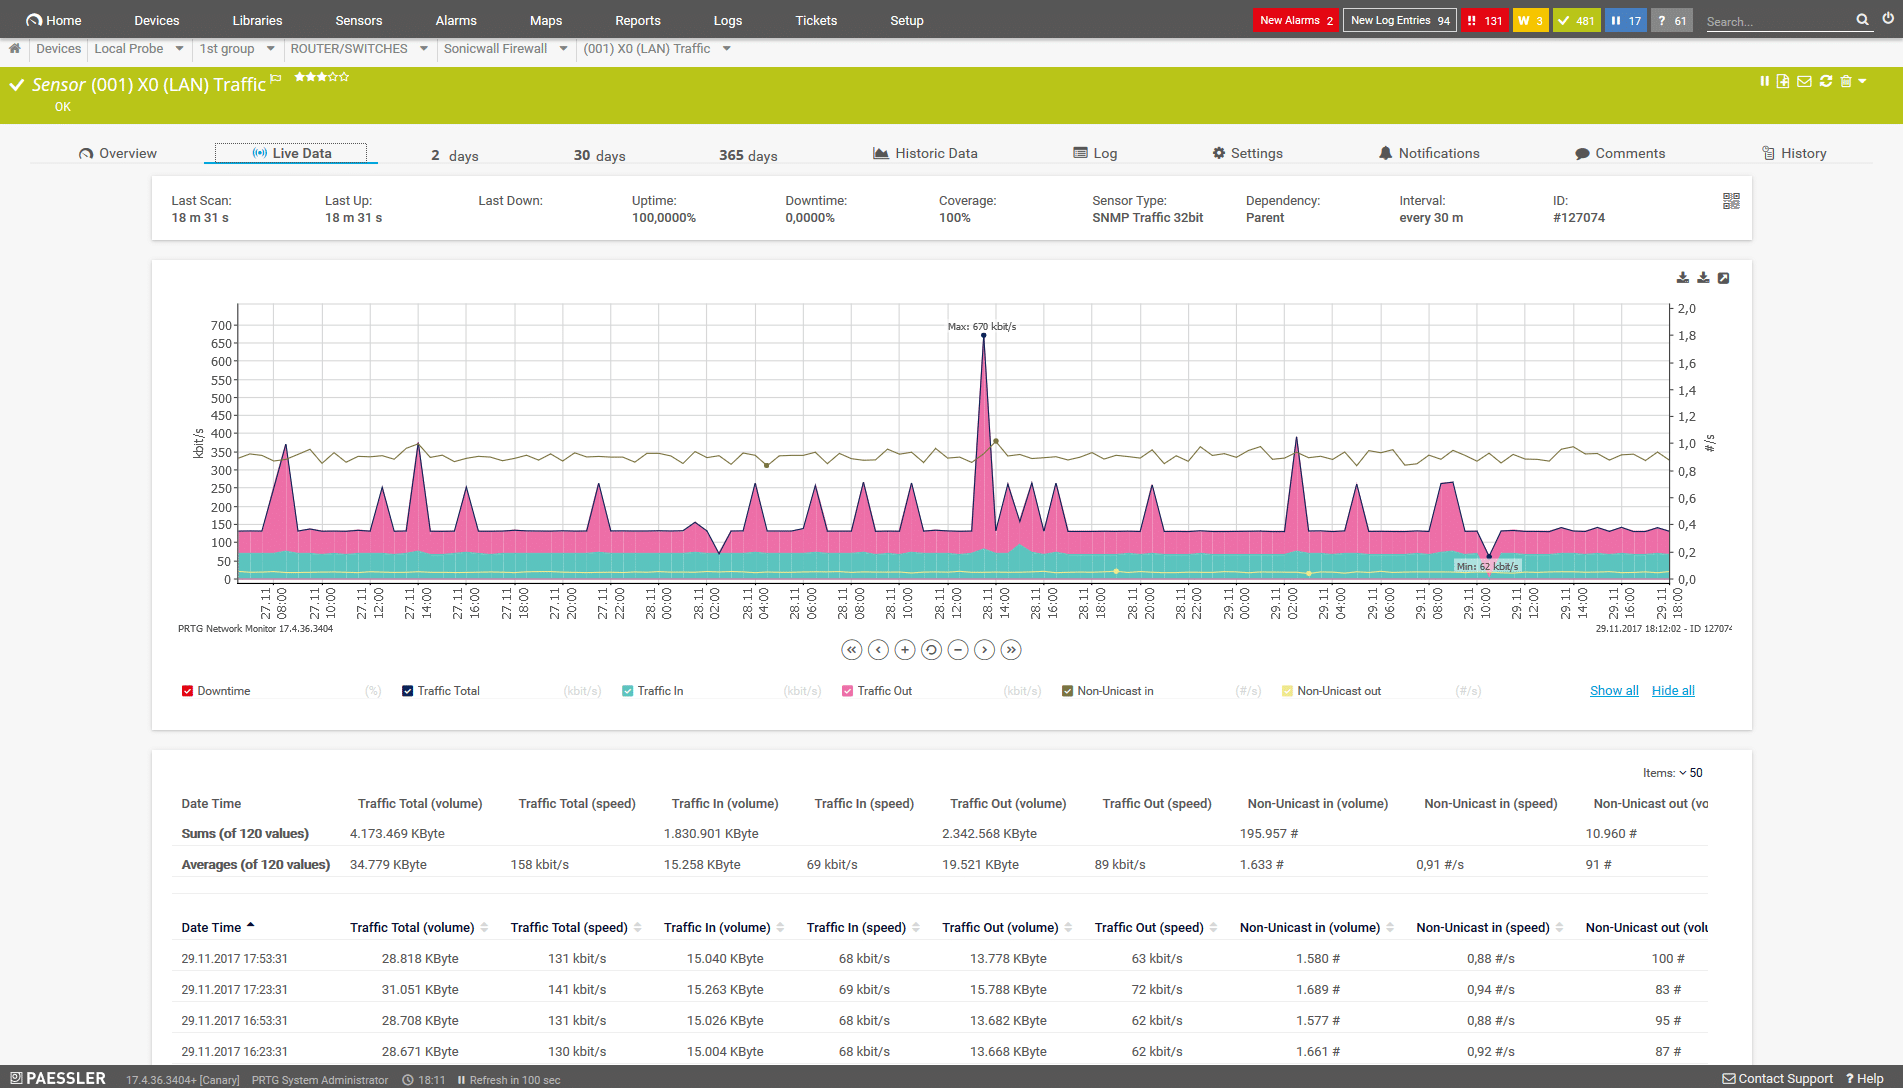
With the choices of SMS, email or push notifications, customized alerts allow administrators to deal with all bandwidth problems immediately and effectively. This assists in the proactive tackling of potential bottlenecking and other bandwidth issues, with solutions identified and implemented before the network is affected negatively. As a further step, once the root of the problem has been identified and dealt with, administrators can then put new bandwidth management policies in place to better manage bandwidth in the future.
You can download a trial of the unlimited version of the PRTG Network Monitor. The 30-day free trial then reverts to a free version of the software, however, it remains limited to 100 sensors.
Pricing: If you opt to upgrade to a licensed version, licenses for the software start at $1750.00, with the different options.
Download: https://www.paessler.com/download/prtg-download
5. SoftPerfect NetWorx
SoftPerfect NetWorx is a highly customizable monitoring tool designed with the bandwidth monitoring requirements of single users or small offices in mind. While minimalistic, its concise graphic and/or numeric display is simple, easy to use, and offers straightforward functionality. The software can be installed on a router, allowing the monitoring of bandwidth on a few PCs or single Mac or Linux machine.
Its clean interface allows for the objective evaluation of bandwidth consumption on a network through its collection of bandwidth usage data. Internet speeds can be measures and monitored with this software as well as any other network connections. Bandwidth limits can be enforced to ensure they are not exceeded and SoftPerfect NetWorx further assists in the identification of potential bandwidth issues. The detection and instant alert of suspicious network activity allows for the fast identification of potential issues, ensuring efficient reaction times while also limiting network congestion.
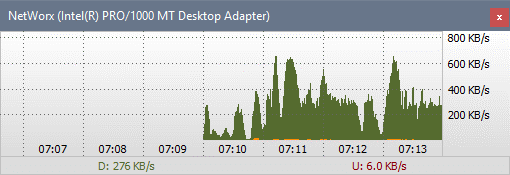
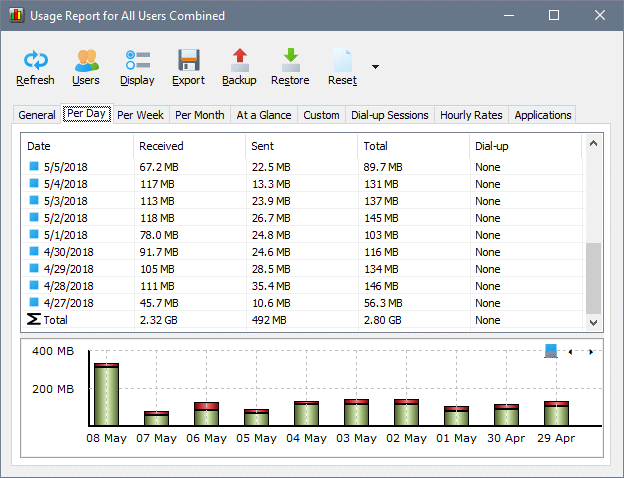
These alerts are also versatile with customizable sound as well as visual warnings to suit your needs and supports the automatic disconnect of all dial-up connections or shutting the entire system down. The reports offered by Softperfect NetWorx are exportable to a variety of formats for further analysis, with all incoming and outgoing traffic represented either on a line chart or logged into a file. This allows the viewing of bandwidth usage and dial-up duration statistics over daily, weekly and monthly periods for an overall overview of the network.
Softperfect NetWorx performs regular connection status checks and offers ping and trace route tests, proving alerts for excessive internet usage detected and supports cable modems, ADSL, WiFi cards and more.
You can download SoftPerfect NetWorx here, which will automatically install as a trial version, with the paid licenses listed here.
Pricing: The home edition for SoftPerfect NetWorx starts at $25.00 for up to five devices, while the business edition starts at $49.00 for up to five devices.
6. WhatsUp Gold
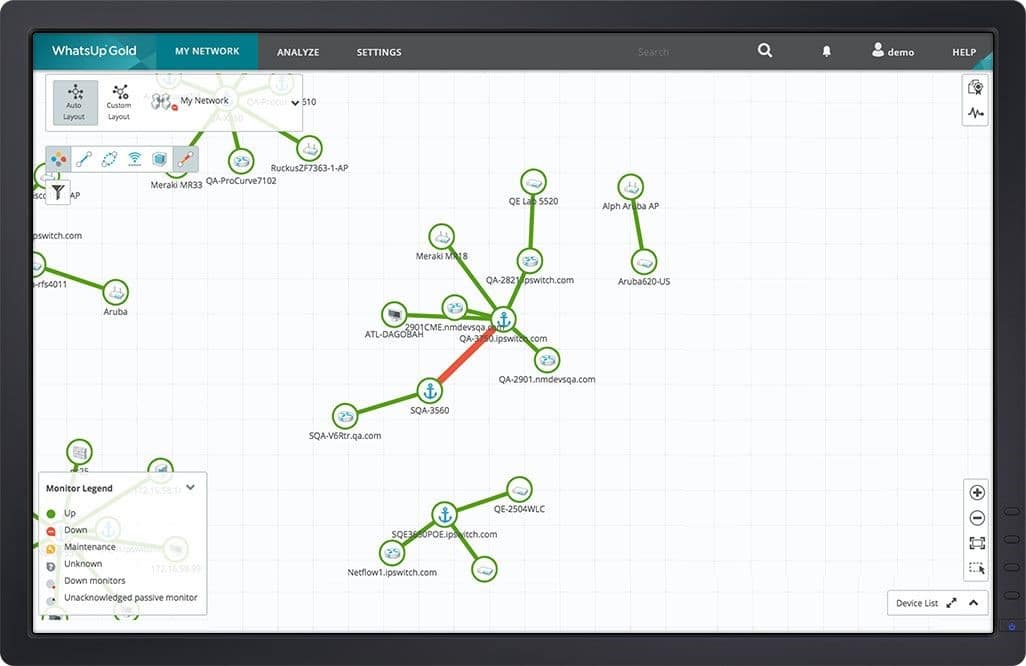
WhatsUp Gold, a comprehensive network monitoring tool, offers extensive monitoring capabilities when it comes to the management of bandwidth within a network. The software offers detailed insight into every part of a network, with its interactive network map and customizable dashboards displaying the information gathered in clear, easily understood formats.
The set-up of WhatsUp Gold is made straightforward and simple through its use of auto-discovery, with everything connected to the network visible and monitored, including network traffic devices, applications, and servers. This list is further extended to virtual machines, cloud, and wireless environments, allowing administrators to diagnose bandwidth issues arising with pinpoint accuracy.
Reports on out-of-the-ordinary consumption of bandwidth, users, applications, and hosts utilizing critical resources, as well as unauthorized applications are available and customizable to the information required. The interactive topology map further ensures troubleshooting issues identified is done smarter and faster, aiding in the fixing of anomalies before they are reported by users.
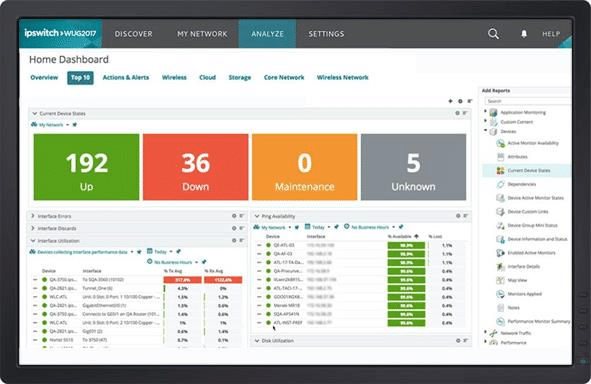
WhatsUp Gold offers a complete overview of the network and bandwidth usage through a single, unified dashboard, allowing administrators to quickly identify interconnections, locate and predict potential problems. Devices and bandwidth usage can be tracked with ease, with the wide overview assisting with the improvement of network, server and application performance. This becomes critical when applications crucial to the business suffer from bandwidth hogging, decreasing the efficiency of the business and affecting end-user performance.
Through the leveraging of various technologies across multiple vendors, such as Cisco NetFlow, NetFlow Lite and NSEl, among others, WhatsUp Gold can convert raw data from these protocols into readable, usable data. This, along with flow-enabled devices that monitor bandwidth usage, allow administrators to plan for potential spikes in bandwidth utilization as well as identify and deal with bandwidth hogging applications and users.
Network congestion problems arising are further resolved faster through WhatsUp Gold’s real-time automatic classification of traffic. Verification through 95th percentile reporting, a calculation of regular, continuous bandwidth usage, can be applied where required and administrators can further validate business-critical applications receive the bandwidth allotted to them. This is done through monitoring Cisco NBAR and CBqoS, and ensures adequate bandwidth is provided at all times, allowing for a smooth, effectively run network.
In addition to the efficiency gained by WhatsUp Gold’s automated device discovery, with its effective Layer 2/ 3 discovery scan, the software uses SNMP to obtain detailed inventory information on each device. The information gained is then reported based on device type, vendor, serial number and more, assisting with faster identification of root causes of issues when troubleshooting potential bandwidth problems.
WhatsUp Gold further boasts an alert center with customizable notifications for alerts issued. Performance issues, such as the exceeding of thresholds, the potential compromise of network performance as well as active monitoring of the changes of device states trigger these alerts. This allows for instant response and the quick prioritization of response strategies, enabling the right alerts to reach the right people timeously.
Multiple methods are utilized in the notification process to ensure alerts are received immediately. This is aided by the option of creating triggered actions to automatically respond to alerts, further aid in increasing the response time to issues arising. Automated configuration backups, as well as restores, further assist in reducing potential network or bandwidth errors while also supporting compliance requirements.
Monitor Applications: You can view the interactive demo of WhatsUp Gold here and download a free trial here.
Pricing: Should you decided this is the software best suited to your needs, you can get a quote for either the Premium Edition or the Total Plus Edition here.
Conclusion
There are multiple solutions available for the monitoring of bandwidth in networks. Each are customizable to your specific needs and budget, whether requiring assistance as an individual or as a large organization. These solutions offer either comprehensive or basic bandwidth monitoring capabilities, with the overall aim of providing better management and troubleshooting of bandwidth-related issues.
With the goal of preventing network strain as the daily consumption of bandwidth increases across workplaces, we hope the information supplied here helps with choosing the most ideal bandwidth monitoring software and tools to suit your requirements.