
Apache Cassandra is a NoSQL distributed database. It provides many advantages over traditional SQL systems such as linear power scaling through nodes, fault tolerance through partitions, and more.
What Is a NoSQL Database?
NoSQL is used to refer to a non-relational database. What that means is that, unlike traditional SQL where databases are stored in relational tables, NoSQL doesn’t. NoSQL databases are unstructured, giving far more freedom and flexibility to engineers than a rigidly structured system. Since it would be troublesome to structure very vast amounts of data reliably, NoSQL systems have been devised to streamline and optimize the process.
What Makes Cassandra Special?
Since Cassandra operates using a NoSQL database, it is inherently lightweight, largely distributed, and open-source. Its strength lies in horizontal scaling, fault tolerance, and consistency. In recent years, the amount of data in transit has been growing larger and larger. There have been growing issues with tackling that high volume of data while keeping the system stable. Luckily with Cassandra, this problem is easily solved using its distribution system.
Scaling Power by Distributing Nodes
Cassandra isn’t just one point on the network. However it might be prudent to run it on a single network only to familiarize with it, the real core strength of Cassandra is in its distribution across multiple nodes. A node in this context is another instance of Cassandra operating on a different machine. Multiple nodes are what allow it to scale its power so well, since they all communicate with each other, it is very simple to scale your database up. The information load is evenly distributed and simple to handle, even under extreme stress. If a single data center fails or go offline for any reason, the other nodes are present to prevent any data loss. All of the nodes have the same functionality as another node, making Cassandra more robust and reliable. Unlike regular SQL systems where you scale power horizontally, Cassandra can do so horizontally meaning that if you want a higher output, simply add more nodes. This provides lots of flexibility with no downtime since you can scale the system up and down however you please at your leisure.
Benefits of Partitions
The information in Cassandra is automatically distributed using partitions. Cassandra takes into consideration numerous variables to determine which node is going to be responsible for handling certain data. This process is achieved using nodes as data coordinators. Any node can be a data coordinator so the system doesn’t become fragile, it’s simply the node that got the request at that moment.
Data Replication Using Nodes
One way that Cassandra guarantees reliability is by replicating data to multiple nodes. Instead of just having one node where your data is stored, you can choose to have several points along the network to store the same information, this is called the replication factor (RF). This way, if a single node goes down, you don’t lose any of your data, instead, once the node is back up it communicates with the rest to see what it “missed out on” and catch up. When data is distributed this way, it is far more reliable and safe, the system is essentially self-healing. At any point when a node is for some reason unable to work, another node can just pitch in and do the work instead. The information is automatically replicated along with Cassandra.
The Best Apache Cassandra Monitoring Tools
The tools that we’re about to talk about are used to monitor Apache Cassandra in real-time, allowing you to see the direct flow of information and how to manage it. Because the best way to use Cassandra is by distributing it over multiple nodes, it is essential to monitor and manage them properly. Every tool has its pros and cons, and luckily, you will be able to find the one that works for you.
1. Site24x7 – FREE TRIAL
Site24x7 provides Apache Cassandra monitoring with live visibility into database performance, health, and resource consumption. It follows measurements such as read and write latency, pending tasks, and compaction activity, helping teams detect and resolve problems before they grow into wider service issues. Alerts and reporting also help administrators tune clusters for availability and efficient resource use.
The package does more than watch Cassandra in isolation. Site24x7 also follows the other IT assets around the database and can identify service dependencies and resource requirements across the wider environment. That gives teams a better view of whether supporting systems can sustain the workloads they are expected to run together.
Key Features
- Provides live visibility into core Cassandra metrics
- Lets teams set thresholds for immediate alerts on critical values
- Produces reports on performance trends, resource use, and bottlenecks
- Uses anomaly detection to flag unusual database behavior
- Keeps historical data for long-term analysis and growth planning
You can try Site24x7 through a 30-day free trial.
EDITOR'S CHOICE
Site24x7 is our top pick for a Cassandra monitoring tool because it offers a comprehensive, user-friendly solution that enables organizations to monitor their Cassandra database clusters efficiently. With Site24x7, network administrators can track critical metrics such as read/write latency, throughput, and disk usage in real-time. The platform provides in-depth visibility into the health and performance of Cassandra nodes, identifying bottlenecks and resource constraints before they become major issues. What sets Site24x7 apart is its ability to integrate with existing infrastructure, including cloud environments, enabling centralized monitoring across multiple platforms. The intuitive dashboard presents performance data in a way that’s easy to interpret, allowing for quick decision-making. Site24x7’s customizable alerting system notifies administrators of potential problems, such as hardware failures, slow queries, or replication issues, ensuring timely responses to any disruptions. Site24x7 provides rich reporting features that offer insights into trends and long-term performance. These reports assist in capacity planning, helping organizations optimize resources. The tool also supports multi-cloud environments, ensuring scalability and flexibility as your Cassandra deployment grows.
Download: Get a 30-day FREE Trial
Official Site: https://www.site24x7.com/signup.html?pack=44&l=en
OS: Cloud-based
2. ManageEngine OpManager Nexus – FREE TRIAL

ManageEngine OpManager Nexus, formerly OpManager Plus, offers enterprise database monitoring for NoSQL databases like Cassandra. Its insights into the health, query performance, and resource utilization rates can help detect issues early. It can also combine these metrics with the wider system data for comprehensive insights into your entire infrastructure.
Key Features
- Monitors sessions and connections to prevent exhaustion issues.
- Identifies the root cause of slow queries for improved optimization.
- Detects database issues before they impact your operations.
- Uses ML algorithms to accurately predict future resource consumption.
- Generates extensive reports and displays data on intuitive dashboards for easy understanding.
OpManager nexus is priced at $1,233 for the Professional edition and $19,995 for the Enterprise edition.
Start a 30-day free trial.
3. AxonOps
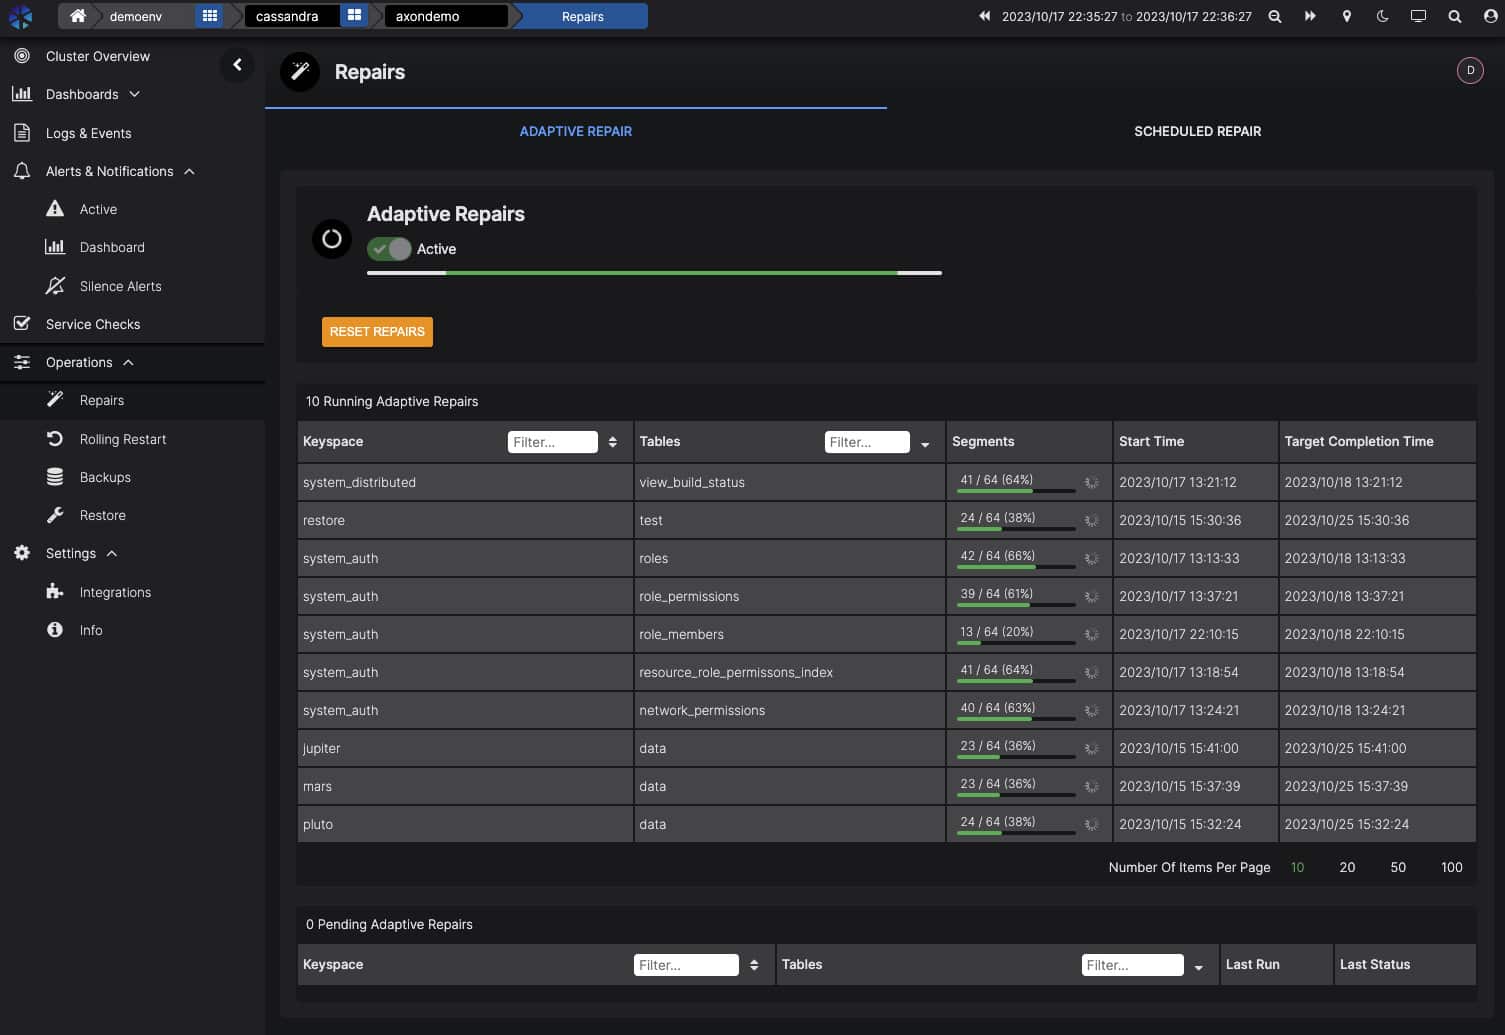
AxonOps is a monitoring tool designed by Cassandra experts specifically for it. It comes with a pre-built user interface that is fully customizable. This ensures that you can get your system up and running easily, while also developing it to cater to your specific needs over time. All of the metrics necessary to check and monitor your network are intuitive and dynamic. With systems such as proactive system checks and customizable alert checks, there will be nothing you can miss. Backups are highly configurable, flexibly scheduled, and visualized so you can rest assured that your data is always safe.
Key Features
- Proactive service checks allow you to never miss an issue
- A fully customizable interface that is easy to start with
- Comprehensive alerting with enterprise-wide integration
- Flexible backup scheduling
- Visualize your backups and restore them confidently
4. Datadog
Datadog is a network monitoring tool that monitors key database metrics, cloud services, containers, and serverless functions all in one place. Unlike AxonOps, it supports multiple applications, not just Cassandra. It optimizes the alerts you receive by effectively separating the wheat from the chaff. You can set up alerts to only receive the ones that matter, eliminating false positives. This way you can eliminate the time you would waste by responding to meaningless alerts. You will be able to track tens of thousands of infrastructure metrics effortlessly, out of the box.
Key Features
- Fully functional out of the box
- Gain essential information about your database and applications with real-time service maps
- Visualize granular data and custom metrics in real-time
- Seamless navigation through logs
- Create composite alerts using boolean logic to minimize wasted time
- Automatically detect unanticipated anomalies and outliers
- Deploy and start monitoring without the need for training or professional services
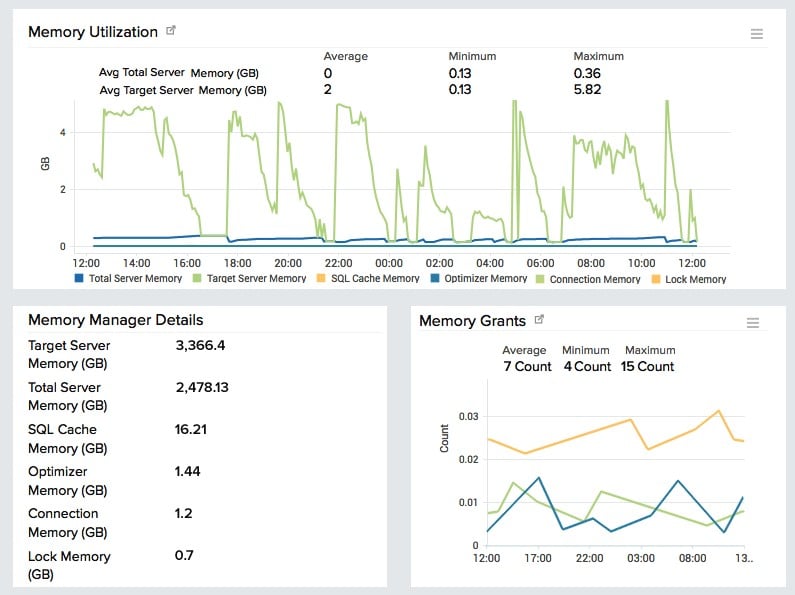
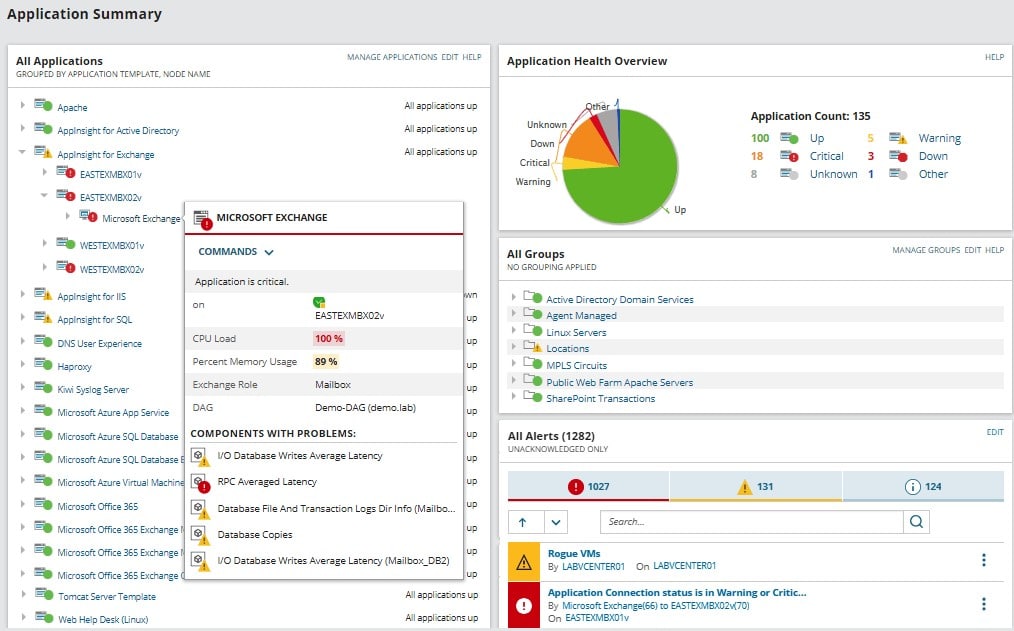
5. ManageEngine Applications Manager
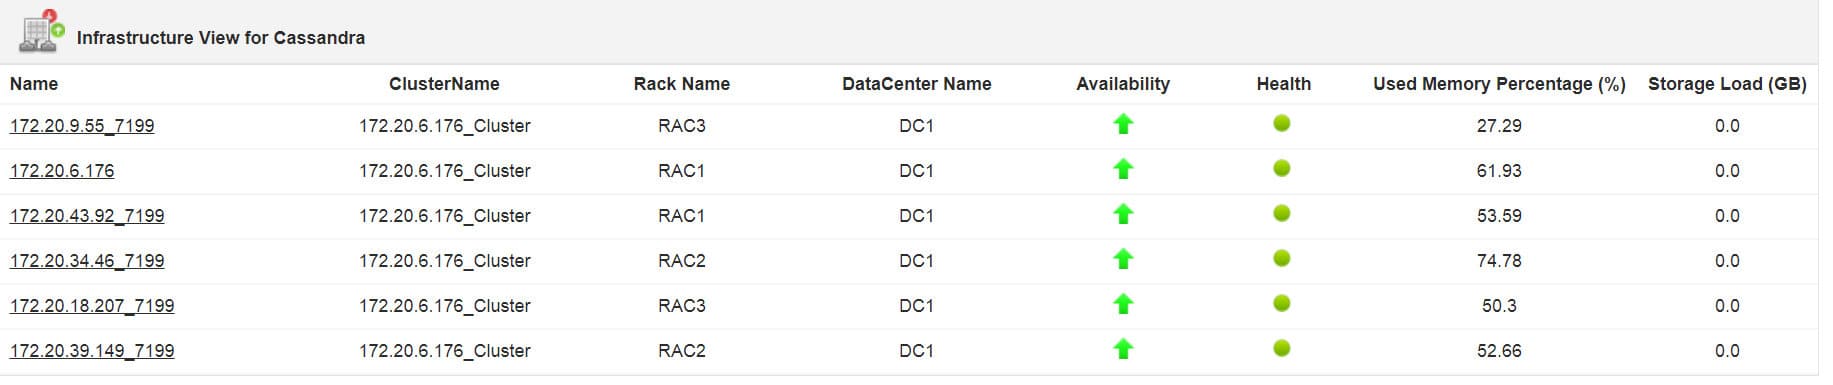
ManageEngine allows you to monitor all of Cassandra’s clusters, tracking their performance, health, and availability. Cassandra consumes a lot of memory while operating, making it imperative to monitor and manage it properly. ManageEngine displays used free and total memory in megabytes. It also monitors and notifies you about CPU usage and provides extensive storage statistics. The management tools that ManageEngine provides help to track down and identify hardware-related problems with performance and more.
Key Features
- Efficient cluster management through a detailed dashboard
- Memory consumption monitoring
- Notifications for high CPU usage in clusters
- Detailed storage statistics
- Operation stats and latency tracking
- Thread pool statistics tracking
- Keyspace Details
6. SolarWinds Server & Application Monitor
Since Cassandra by nature is based on multiple nodes, finding and identifying issues can be problematic. Luckily, SolarWinds Server & Application Monitor (SAM) allows you to strike at the heart of these issues. SAM keeps track of important Cassandra metrics while displaying them visually in an intuitive way. In this way, it is designed to visualize and monitor the key performance metrics of Cassandra. On top of that, if any critical issues arise, you can set up your customizable monitoring and alerting systems, making it much easier to not miss important information that could affect the end users or degrade system health.
Key Features
- Proactive monitoring to minimize bottlenecks and slowdowns
- Pinpoint diagnostic accuracy
- Essential tracking of vital metrics in a clear and visual way
- Intelligent and customizable alert system
- Unifying your Cassandra monitoring dashboards
SolarWinds Server & Application Monitor is offered on a 30-day free trial.
7. New Relic
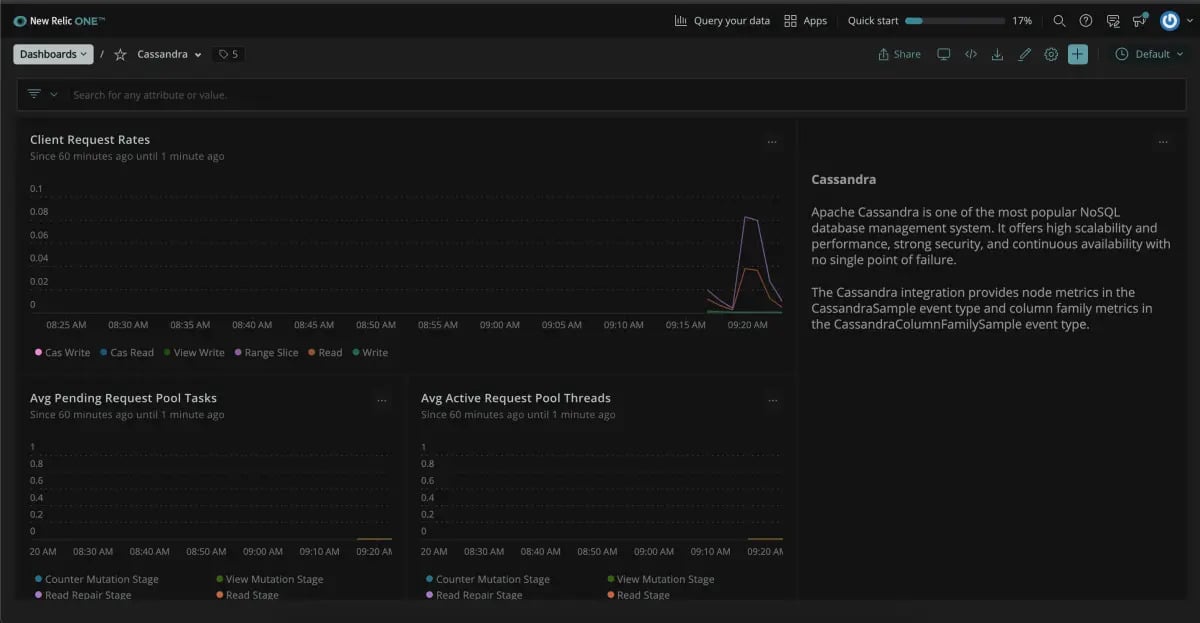
New Relic might be more user-friendly considering the quickstart option they have with pre-build dashboards visualizing many important metrics to monitor. You will however need to have Java Runtime Environment 7 or higher to run it. With New Relic, you can create alert policies, query data for troubleshooting purposes and create charts. You can also monitor multiple Cassandra servers using the multi-instance monitoring configuration.
Key Features
- Quick and easy to set up
- Fairly customizable
- Multi-instance monitoring
8. Dynatrace
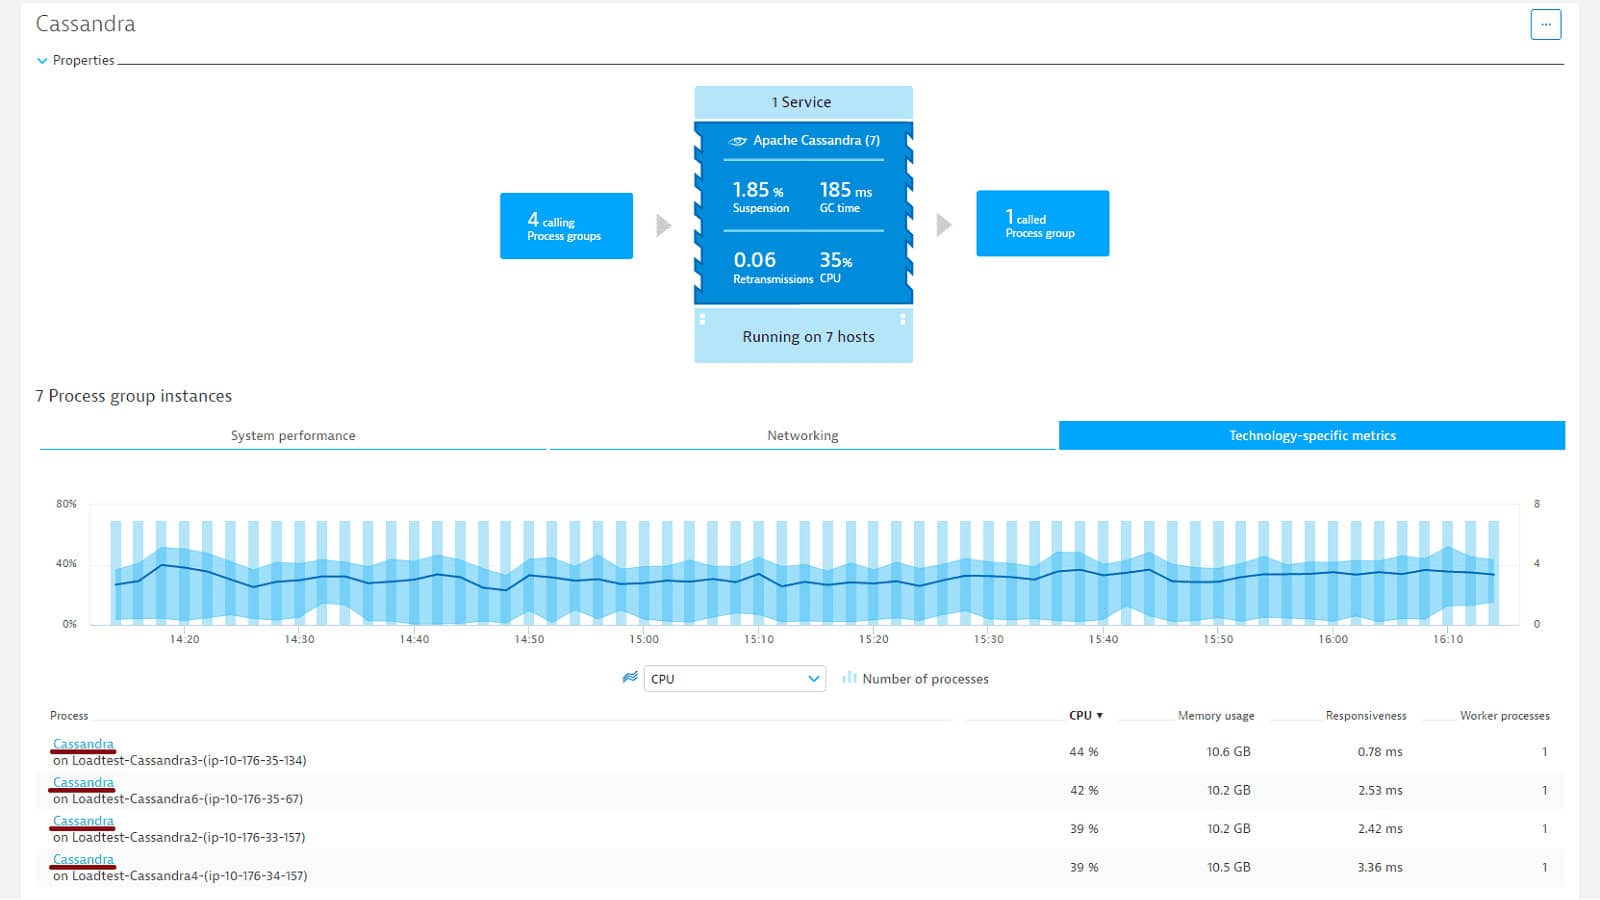
Dynatrace is a monitoring tool that supports Cassandra. Its strongest feature is the ability to auto-detect your databases and display your metrics. It detects which nodes are underperforming and need attention, allowing you perfect precision over your network. Using these features, you can easily prevent slowdowns and bottlenecking. There is no manual configuration required, you can set it up and start monitoring in as short as five minutes while also monitoring with reliable precision and control.
Key Features
- Extremely easy and quick to set up
- No manual configuration is necessary
- Database auto-detection
- Pinpoint precision in troubleshooting and diagnostics
Summary
We have covered what Cassandra is, how it works, and several options to consider to monitor its performance. All of these options have their strengths and weaknesses in comparison to one another, and only one will be ideal for you and your business. Hopefully, in this article, you have found the tool you need to help your enterprise to flourish.