JBoss is a Java EE-developed, open-source, and cross-platform application server. JBoss is used in businesses worldwide to help build, deploy, and host a variety of different Java applications. Although JBoss hinges on Enterprise JavaBeans specification to function, it provides its users with efficient, continuous performance, and an amazing platform for online-first businesses.
Here is our list of the best JBoss monitoring tools out there:
- Site24x7 Application Performance Monitor – FREE TRIAL An all-rounder tool with extremely flexible pricing. Start a 30-day free trial.
- ManageEngine Applications Manager – FREE TRIAL A tool designed for simplicity that still manages to pack quite a few higher-level features. Start a 30-day free trial.
- ManageEngine OpManager Nexus – FREE TRIAL An ITOps tool that also monitors databases like JBoss that power business-critical applications. Download a 30-day free trial.
- SolarWinds Server & Application Monitor Whether you need automated monitoring with root-cause analysis or a powerful, customizable solution, SolarWinds SAM delivers.
- GroundWork Monitor A complete IT infrastructure monitoring tool with incredible depth and customizability.
- Nagios XI and Nagios Core Nagios Core is an extremely customizable free, open-source solution with a massive community. Nagios XI is a paid version of the software offering additional functionalities.
Since JBoss helps provide a degree of security, resource control, load balancing, and clustering to applications, its uptime can be crucial to the app’s performance and uptime.
Because of this, many firms rely on JBoss monitoring tools to help ensure that the JBoss application server is always up and that they’re getting as much performance out of it as they can.
Τhe Βest JBoss Μonitoring Τools
1. Site24x7 Application Performance Monitor – FREE TRIAL
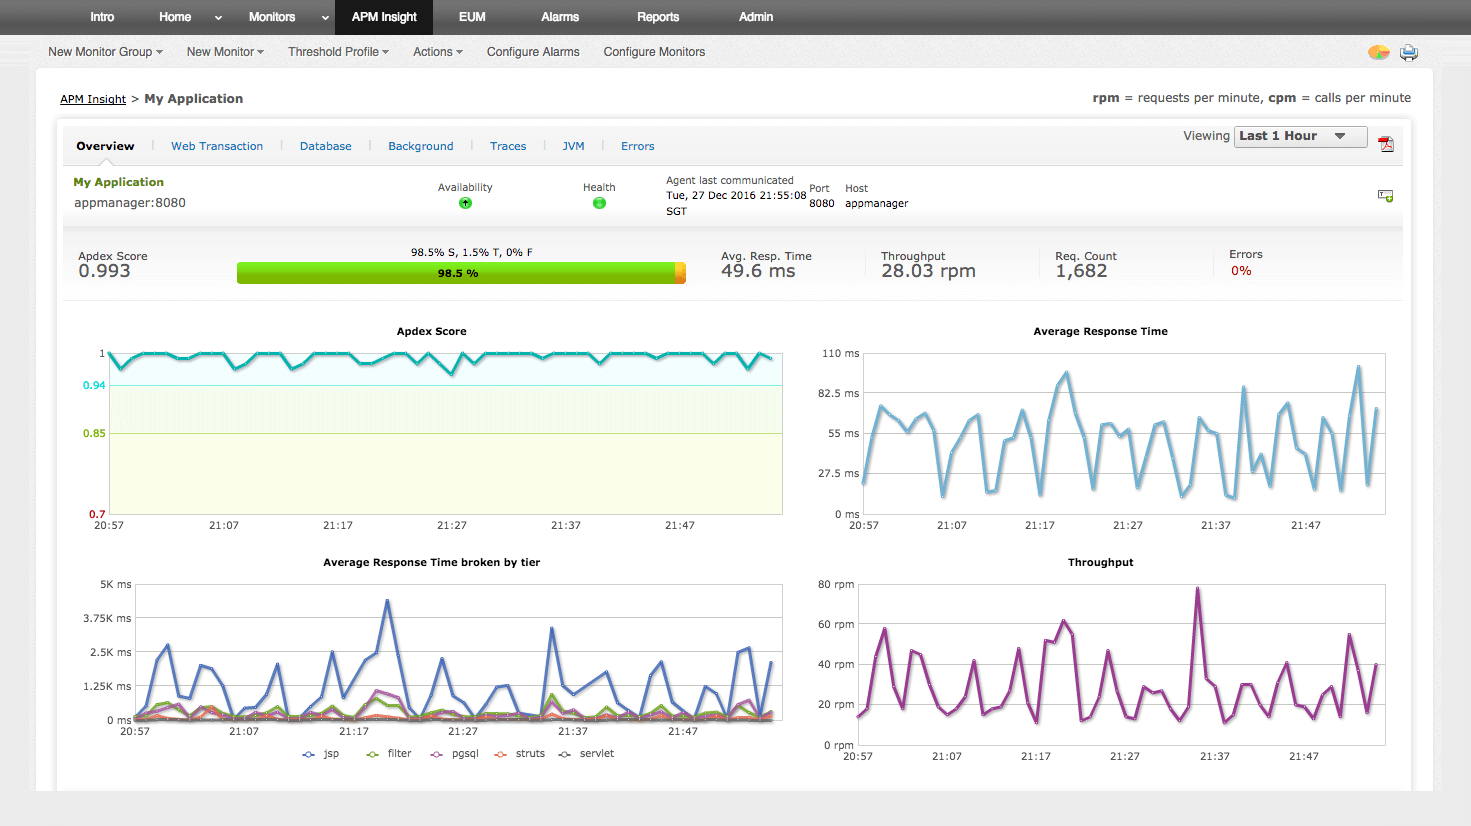
Site24x7 is a cloud-based tool providing a variety of system monitoring features. The Application Performance Monitor or APM has the capability of looking at Java code and linking it together with how your apps operate. This means that the tool itself can find which Java apps are running over which JBoss service, as well as what processes and services it relies on.
Main Features:
- A cloud-based system with agents installed on each device
- Excellent tracing function
- Modular pricing
- Root-cause analysis features
- Tracks application behavior and its impact on your users in real-time
Why do we recommend it?
Throughout our testing, the Site24x7 Application Performance Monitor demonstrated a cloud-based solution with exceptional flexibility. Its ability to analyze Java code and link it to application operations allowed for a comprehensive understanding of our JBoss applications. The modular pricing and cloud-based monitoring console provided us with a versatile tool that adapts to the processing needs of our applications.
The Site24x7 APM is great for businesses whose processes take a lot of power to monitor, as the tool’s pricing includes all of the processing power for your applications. The monitoring console is also cloud-based and you can easily access it through the web. It’s fairly customizable, and it’s quite simple to do so just by dragging and dropping widgets.
In the age of Azure, AWS, and work-from-home environments, a cloud-based tool can be an invaluable asset for any business.
The APM can also help your app’s performance by using its tracing function. It has both synthetic transaction and real-user monitoring capabilities. This takes the ability of your IT team to analyze performance to the next level.
The APM is a modular system. This means you can pay for the base subscription, and then pick and choose which features you want to prioritize.
Who is it recommended for?
Site24x7 APM is recommended for businesses with diverse processing requirements, offering a cloud-based solution suitable for both in-house and MSP use. Its flexible pricing model makes it accessible for businesses of varying sizes, and its real-time monitoring capabilities cater to IT teams focused on optimizing application performance. It comes with a 30-day free trial.
2. ManageEngine Applications Manager – FREE TRIAL
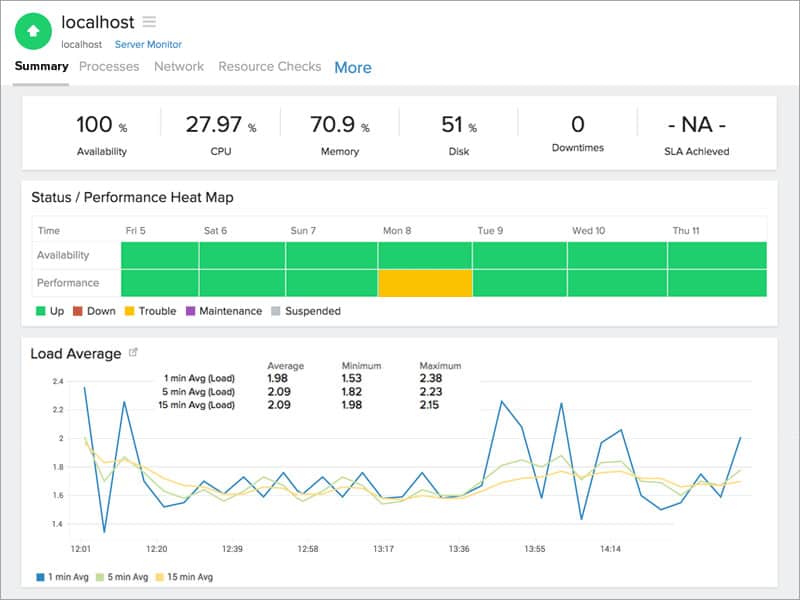
The ManageEngine Applications Manager is a tool designed to provide excellent metrics, reporting, and troubleshooting assistance in a simple package. The tool gives you a real-time, detailed look into how your JBoss server is performing. It’ll display the metrics of your applications server, the tool’s response time, as well as the metrics of all applications relying on the server.
Main Features:
- Excellent user interface
- Simplicity-first design approach
- Capacity planning capabilities
- Mobile web client and iOS application available
- Multiple automation features to streamline your monitoring experience
Why do we recommend it?
The ManageEngine Applications Manager impressed us with its simplicity-first design approach, providing a user-friendly solution for JBoss server monitoring. The tool’s real-time insights into JBoss server performance, along with its automation features, streamlined monitoring tasks. The mobile web client and iOS application ensured accessibility, allowing us to monitor and troubleshoot JBoss applications on the go.
The tool aims to streamline standard monitoring efforts by minimizing the number of repetitive tasks your technicians need to perform. It lets you quickly automate some tasks like restarting the JBoss server when its memory usage exceeds a customizable threshold. You can also set up custom scripts to run when metrics exceed a threshold. It also lets you use the JMX bean to help you get more database connections.
The tool helps you troubleshoot by looking at both heap and non-heap memory and generates a heap dump automatically to help you analyze potential problems in greater detail. Since it takes automatic thread dumps, this can help you find which parts of your code correspond with what issue.
You can also optimize Java performance through the tool by analyzing JVM parameters and taking advantage of the tool’s plethora of customization features.
If you’re looking for a tool that makes user-friendliness and simplicity its focus, then the ManageEngine Applications Manager might be just the tool for you. It also integrates with the rest of the ManageEngine suite without a hitch.
The tool looks at transaction flow and method-level metrics, letting you easily gauge the performance of your databases, in addition, to quickly identifying possible bottlenecks in your infrastructure.
Its Java transaction performance metrics are extremely detailed. It takes only a couple of clicks from the URL to get to the specific SQL query that’s causing performance troubles.
ManageEngine also offers some capacity planning features. It’ll let you find where your resources could be more efficiently utilized, and it has some forecasting features to let you anticipate capacity issues.
Reporting features are often underrated when it comes to monitoring tools, however, they enable smoother inter-team and intra-team communications, and streamline troubleshooting processes. The ManageEngine has an in-built report generation function following multiple templates, however, you can also make your own.
The tool offers a mobile web client, as well as an app available on iOS. This lets you keep track of JBoss performance even when you’re outside the office, you can even resolve many issues without being physically present in the office.
Who is it recommended for?
ManageEngine Applications Manager is recommended for businesses seeking a straightforward and user-friendly solution for JBoss server monitoring. Its capacity planning capabilities and mobile accessibility make it suitable for IT teams looking to efficiently manage and troubleshoot JBoss applications. The ManageEngine Applications Manager comes with a 30-day free trial.
3. ManageEngine OpManager Nexus – FREE TRIAL

ManageEngine OpManager Nexus, formerly OpManager Plus, provides seamless database monitoring to help you stay on top of your business-critical applications. It offers deep visibility into the health and performance of your JBoss and other databases, and even pinpoints issues and their root causes. With such information, you can ensure high uptime for the applications that run on these servers.
Main Features:
- Unified console for viewing different performance metrics.
- Detects anomalies and sends notifications through multiple channels.
- Analyzes the root cause of slow queries.
- Uses adaptive baselines and dynamic thresholds to make alerts highly relevant.
- Offers alert-driven workflows to automatically trigger configured actions.
Why do we recommend it?
OpManager Nexus helps scale applications and ensure their optimal performance at all times. Its ability to collect data from multiple sources and analyze it for insights is highly useful for detecting issues early. You can also use this data to optimize the performance of your database and the applications using it.
A notable aspect of this tool is its focus on improving the speed of query processing. It finds the queries that slow down your application by correlating different metrics. Specifically, it tracks the database response time per transaction and correlates it with application performance trends. It even monitors the queries taking up the most resources. Alongside these metrics, it also analyzes cache efficiency and locks to identify potential bottlenecks. When all these values are combined, it provides a detailed view of performance issues in your JBoss databases.
The dashboards and reports are also well-designed and make it easy for anyone to understand the potential problems.
Who is it recommended for?
It is recommended for organizations running JBoss applications. It is useful for database designers and administrators who are responsible for continuously improving the performance of the JBoss servers.
OpManager Nexus starts at $1,233 for 50 devices if you choose the Professional edition. There’s also an Enterprise edition priced at $19,995 for 1000 devices.
Start a 30-day free trial.
3. SolarWinds Server & Application Monitor
SolarWinds Server & Application Monitor or SAM is made by the reputable SolarWinds company responsible for a variety of cybersecurity solutions used by everyone from small businesses to massive, Fortune 100 enterprises.
Main Features:
- Proactive monitoring approach
- Seamlessly integrates with the rest of the SolarWinds suite
- Helps with multi-threading issues
- Excellent user interface
- AI-based forecasting and alerts system
- Monitors metrics of hardware components
- Generous free trial
Why do we recommend it?
During our evaluation, the SolarWinds Server & Application Monitor proved invaluable in ensuring the seamless operation of our JBoss application server and its dependent apps. The proactive monitoring approach, coupled with its AI-based forecasting and alerts system, allowed us to remotely handle operations such as halting, restarting, and starting servers. This capability significantly expedited troubleshooting efforts and ensured optimal server performance, reducing downtime.
SAM has a JBoss monitoring tool included in its package that ensures your JBoss application server and reliant apps are running without a hitch. This helps you ensure minimum downtime and server lag, which makes sure your customers are satisfied.
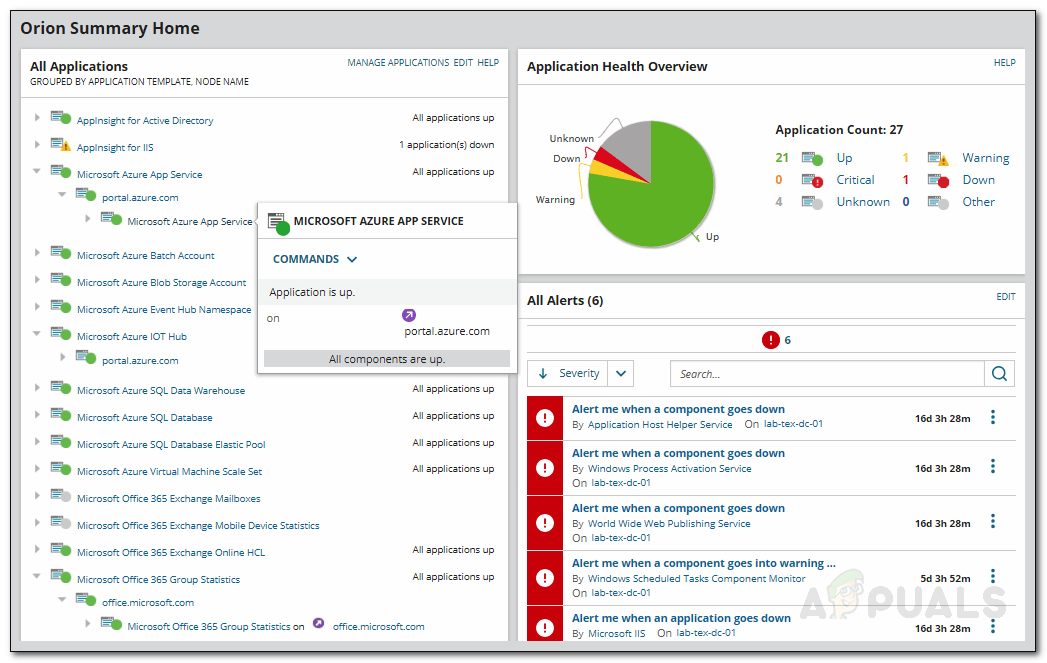
The SolarWinds SAM has autodiscovery features and server monitoring capabilities, which in conjunction with its slick UI makes it easy to tell the status of key health metrics from a single glance.
Using the tool’s built-in AppStack dashboard, you can look at detailed health metrics in an intuitively visualized manner. This lets your administrators look at the status and performance of vital server components without being bogged down by cumbersome interfaces.
Something that the SAM does especially well is presenting app dependencies intuitively and visually. You can look at underlying virtual and physical dependencies with a couple of clicks. This makes root-cause analysis and troubleshooting much easier than having to go through each component manually.
SolarWinds SAM takes advantage of the JMX Messaging Protocol (JMXMP) to get performance metrics like server response times, latency, or packet loss data. From this data, it can also provide AI-based baseline alerts.
The alerts system is quite simple but extremely effective. There are default baselines for the metrics of each component (or you can set custom ones yourself) and when one of them is crossed, or the tool anticipates it will be soon based on its predictive AI, it sends you an alert. The AI predictions will help your business react to issues before they ever occur, and if they do occur, the alerts will help you troubleshoot much more effectively.
Furthermore, you can look at JBoss application server processes and services as well as halt, restart, and start them remotely directly from the SAM interface. This helps you troubleshoot faster and ensure all of your bases are covered even if some servers are remote.
Java is notorious for memory leak issues, because of this, the SAM runs memory statistics through a template to try to solve any memory issues you might be facing in your JRE. It can look at pending and pool memory, as well as a heap, non-heap, and total memory, in addition to performing garbage collection tasks.
Since capacity planning is a crucial component of any development effort, the SAM helps with this by using its AI to anticipate future usage, in addition to displaying real-time statistics about current thread metrics, available processes, and more.
Multi-threading issues are notoriously hard to track down and fix, hence the SAM has been optimized to help find these and help your admins repair issues surrounding them.
One of the best things about SAM is that it isn’t limited to monitoring JBoss application servers. It seamlessly integrates into your IT infrastructure and monitors large swaths of it while remaining relatively easy to use given its complexity. It’ll even keep track of hardware metrics like the temperature of your CPUs, fans, etc.
Who is it recommended for?
SolarWinds Server & Application Monitor is ideal for businesses of various sizes, offering scalability and flexibility.
Its features cater to IT professionals and administrators responsible for monitoring JBoss application servers, making it suitable for both small businesses and large enterprises seeking a robust solution for comprehensive server and application monitoring.
The SolarWinds Server & Application Monitor is available on a 30-day free trial.
4. GroundWork Monitor
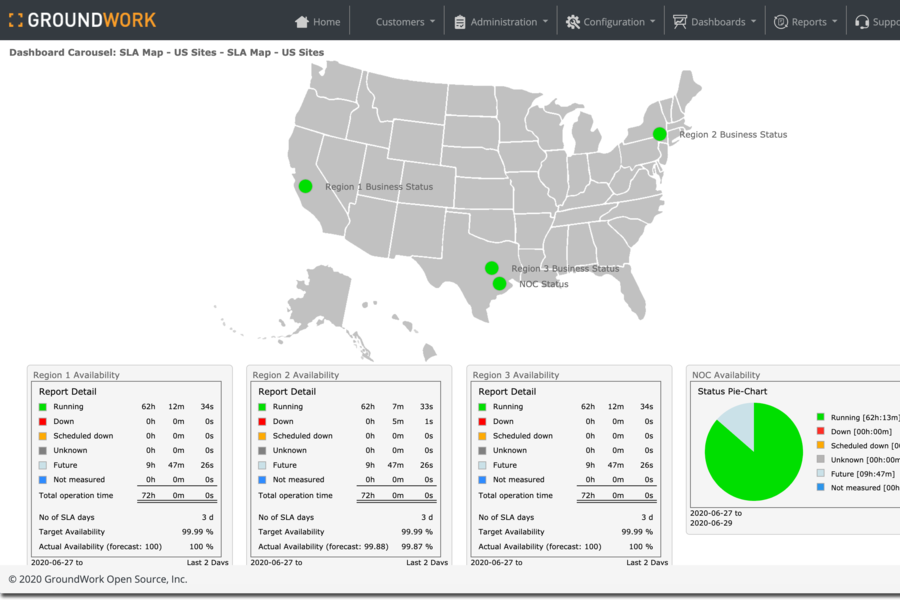
GroundWork Monitor is possibly the most complex and extensive solution on this list. It’s a holistic IT infrastructure monitoring software utilizing both open-source and proprietary technologies all under a single web portal.
Main Features:
- A variety of 3rd party add-ons are available
- Extremely scalable
- Free in its base version, with an extremely generous free trial
- Full-fledged IT infrastructure monitoring solution
- Amazing alerts system
- Heavily customizable
The tool looks to provide a high-quality system, cloud, network, and application monitoring from a single application. It is extremely customizable with its versatile architecture and gives you access to a variety of ways to customize your reports and configurations.
The tool uses JBoss Portal Platform 6 as its web interface. This is an open-source and standards-based environment, which lets its vast community create hundreds of plugins to enhance the GroundWork Monitor experience.
Its customization doesn’t end there, you can extensively customize the dashboard so your administrators are never looking at irrelevant metrics. Alternatively, its standard dashboards are quite intuitive and provide a great starting point.
On its dashboards, you can look at real-time metrics, as well as drill down deep into sub-applications to help with root-cause analysis and other troubleshooting efforts. It uses its NagVis presentation tool to visualize all of the data it collects from your devices.
This is an extremely scalable software, as long as you’ve got the technical know-how to use it, it’ll serve you well whether you’re an SMB or a large enterprise. It also supports web performance management, which is great for troubleshooting and resolving issues remotely.
It’ll immediately discover all devices on your subnet when you install it with its auto-discovery capabilities. When it’s done discovering devices, it’ll immediately check all of the devices to ensure they’re performing within reasonable thresholds.
The tool will also help you manage host and service groups. It’ll help you manage host downtimes and coordinate network resources with its foundation configuration database. You can also close events, and execute cleanups from its web interface.
Its GroundWorks BIRT Report Designer lets admins modify, generate, and distribute highly detailed reports as needed. You can also create specialized reports very easily, helping teams communicate about singular issues or metrics.
The tool has one of the best alert systems on the market. It’s extremely customizable, reaches a variety of platforms, and since the tool is outfitted with auditing features, you can go through system configs and runtime changes within an audit trail.
GroundWork also provides administrator resources, and product documentation access, and has a very useful support portal just in case something is unclear. It also helps you monitor new releases for how they’re affecting the performance of your systems.
GroundWork is held back a bit by lacking the user-friendly nature of some of its competitors. The GroundWork Monitor Core is entirely free for up to 50 nodes, while the GroundWork Monitor Enterprise edition comes with a 60-day free trial for up to 250 nodes. If you need more nodes than that, you can request a demo from the company.
5. Nagios XI and Nagios Core
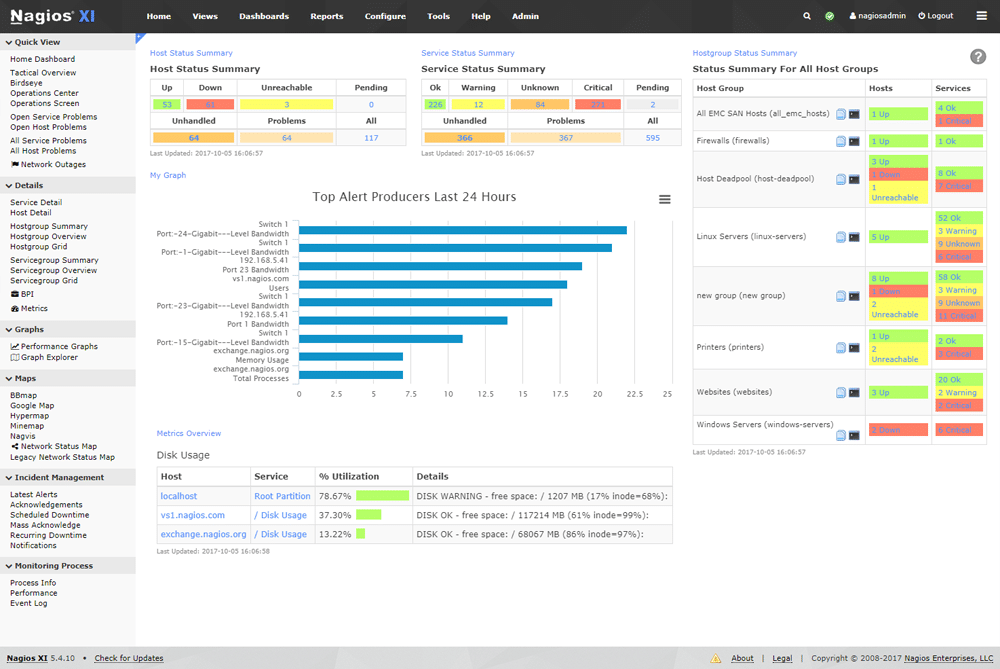
Nagios Core is a free, cloud-based monitoring solution capable of extensive JBoss application server monitoring. Nagios XI is Nagios Core’s paid cousin and offers additional features and a higher degree of user-friendliness. We’ll be mainly considering Nagios Core here, but XI provides a considerable boost to the tool’s usability.
Main Features:
- The massive community constantly developing plugins
- Extremely customizable
- Nagios Core is completely free
- Very generous free trial
- Cloud-based
One of the main advantages of Nagios compared to its competitors is the abundance of 3rd party plugins available for the tool. Buzz, for example, is one such popular plugin that helps a lot in JBoss monitoring. It gives you a framework that provides baseline support for the JBoss ESB.
If you’re looking to conduct comprehensive checks and monitor in-depth details, then you can take advantage of more specialized plugins like Perl Nagios. With it, you can pick and choose which JMX attributes you want to check.
You can also get quite a lot out of Nagios in terms of its reporting and alerts system. It integrates with many common applications like Slack to get alerts to you easier, and there are dozens of report templates available for you to choose from.
Another excellent aspect of Nagios is its documentation. With more complex tools like this one, it’s important to have answers to simple questions like “How do I do this?” well-documented. Thankfully, when it comes to Nagios, there’s no shortage of helpful documentation helping you do pretty much anything with the platform.
This, alongside its massive plugin library, is what makes Nagios one of the most flexible monitoring solutions out there.
Nagios XI simply takes Nagios core and elevates it. It keeps the plugin functionalities while providing it with more raw power and making it easier to use.
If you’re looking for an easy-to-use out-of-the-box solution, Nagios might be a bit more than you bargained for. You can get Nagios XI at a 60-day free trial on the company site.
Closing Words
With JBoss applications becoming more and more popular, successfully monitoring the JBoss application server has become a crucial part of ensuring customer satisfaction. Since doing so would be a herculean task to do by hand, most firms opt to use a specialized tool for the job.
The ideal solution for you, as always, will depend on your needs. We’ve tried to ensure that our first three picks are ones you can’t go wrong with, but you should have your needs set in stone before committing to a tool.
What is a feature you wish more monitoring tools had?
What is your favorite JBoss monitoring tool?
Let us know in the comments below!