Python is the third most widely used programming language in the world. With over 12% of all applications built involving it, it’s no surprise to find that the language is incredibly flexible. It’s also easy to use together with other languages, making for swift, efficient implementation.
With that being said, its library-heavy nature combined with the fact Python is an object-oriented programming language can make the execution of its code quite difficult to track accurately.
Our list for the best Python monitoring tools is as follows:
- Site24x7 APM – FREE TRIAL A modular tool that lets you check what each Python framework is bringing to the table. Access the 30-day free trial.
- ManageEngine Applications Manager – FREE TRIAL An all-rounder tool that needs to be installed on-premises. Get a 30-day free trial.
- ManageEngine OpManager Nexus – FREE TRIAL This is an application performance monitoring platform that offers out-of-the-box monitoring of Python, Perl, VBScript, and PowerShell scripts. Download a 30-day free trial.
- SolarWinds Observability SaaS A versatile Python monitoring tool with a great GUI that’s easy to use. It also offers deep tracking and reporting.
- Datadog APM An excellent DevOps specialized tool, its code-level tracing facility can save valuable time and provide unique insights.
- Dynatrace A tool ideal for testing teams with a variety of features to track your product from its inception to well within its launch.
- AppDynamics A service-based tool that lets you purchase exactly what you need and has AI-induced predictive capabilities.
Two kinds of businesses require the ability to monitor Python performance:
- Those that create software using Python
- Those that use Python-made software
In other words, pretty much any software-related business in the modern world will reap benefits from Python monitoring.
The Python programming language is very flexible. The system can be used in conjunction with other programming languages and its libraries of useful functions make it quick to implement. However, those libraries and the object-oriented nature of Python can make its code execution hard to track.
There are two types of businesses that need to be able to monitor Python performance – those that develop software and those that use them. Clearly, those groups encompass just about every business in the developed world.
Why is Python so common?
Python is a relatively easy to learn, high-level, object-oriented programming language especially useful for coding UIs. The lower-level tasks that you might use a different language for are usually handled with libraries of functions. An example of this would be simple drag-and-drop functions as well as many visual effects.
Due to being so suitable for creating User Interfaces, Python is extremely common. The Kivy framework makes it suitable even for the creation of mobile applications. In cloud development, it’s also quite common. In conclusion- Python is everywhere.
Problems with Python monitoring
Much like any other programming language, issues crop up with how the system manages resource access. With an object-oriented language like Python, issues with resource management end up happening even more. This is because Object-oriented modules can experience multiple calls throughout the running of a program. Sometimes, the same exact code can be running multiple times at once.
When you’ve got multiple copies of the same process running in parallel, you’ll have to deal with resource locks. Sometimes, you’ll find multiple different apps running on the same system that were made by different developers, but use the same widely available library or API. In these cases, both of these programs will be rushing to gain access to the same resources at once, causing them to lock each other out of them.
One of the biggest issues with object-oriented languages that favor apps hidden behind dozens of APIs is that once developers integrate those APIs, they won’t know much about their internal functions most of the time. This means that they won’t know whether they’re good at cleaning up, shutting down properly, releasing memory, or a myriad of other considerations.
Although before you could manually keep track of all of these issues, in the modern, API-ridden software landscape, this is nigh-impossible. Because of that, most businesses take advantage of application monitoring tools.
If you aren’t, and you’re facing issues due to the nature of the APIs you’re using, remember that the whole point of using APIs is to save time. If you are spending more time getting your APIs to work properly than you should, isn’t it better to get a tool to do that for you?
The best Python Monitoring tools
Regardless of what kind of business you’re involved in, it’s a necessity to track the performance of your Python code. As we’ve already discussed, having a tool do that for you saves valuable time and effort you would otherwise be spending trying to manually fix your issues.
There’s a variety of tools out there catering to both developers and users alike, while others will work great for both. Finding the right tool for you, however, is easier said than done. It can take a while to go through all of the potential tools you could be using and narrow it down to a couple of candidates. That’s why we’ve assembled this guide- so you don’t have to spend time looking.
1. Site24x7 APM – FREE TRIAL
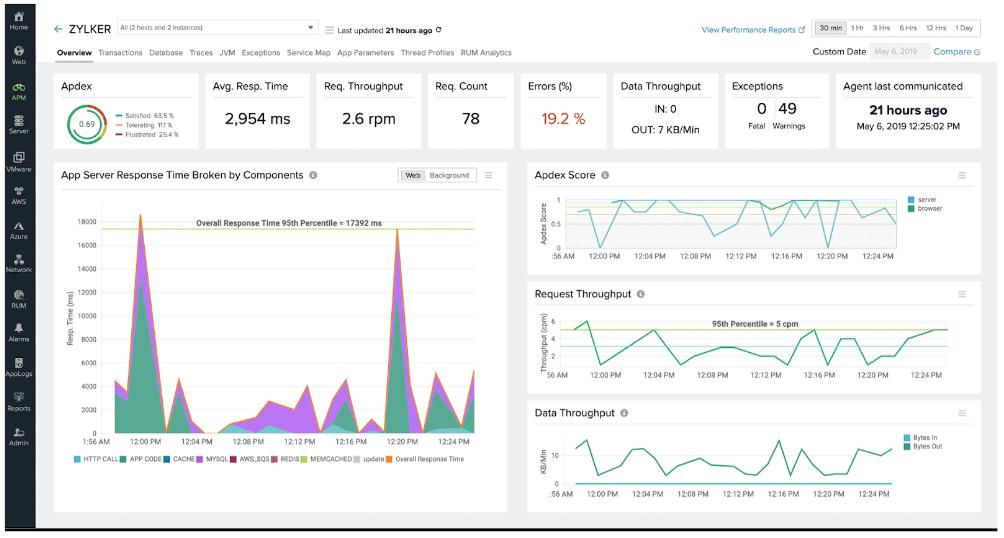
Site24x7 is an excellent multitool, featuring the APM insight utility. This utility helps you find all of the apps running on your system, as well as identify their interactions. It builds a live map of all the occurring interactions. Then it takes a dive into each application individually to find all of the modules operating on them.
Main Features:
- Live map creation capabilities
- Checks the contributions each Python framework has on the management of your modules
- Aids you in validating the Python frameworks you want to use in making your software
- Excellent beta testing support
Why do we recommend it?
Site24x7 APM, a modular tool offering insight into Python frameworks, impressed us with its live map creation capabilities. During our 30-day free trial, the utility allowed us to understand the interactions between Python frameworks and individual modules. The component analysis provided a deeper understanding of code execution, aiding in validating the effectiveness of chosen Python frameworks.
APM’s component analysis has the ability to identify all of the languages at play in your code, in addition to monitoring how each module is using your resources. The fun part is that the Site24x7 APM doesn’t just watch your code when it runs, but it also looks at the contributions that a variety of Python frameworks have made to how those modules are managed.
This tool is excellent when used as a part of a development environment. It’ll help you with clearing your system of components that are bogging down its speed. Furthermore, the APM Insight service comes together with the APM package. This is a platform of monitoring systems based on the cloud. This means that APM will give you not only software tracking, but also server and network monitoring.
Having all of this helps you monitor an entire stack of systems all at once.
Who is it recommended for?
Site24x7 APM is recommended for developers and businesses involved in Python-based development. Its live map creation and component analysis features cater to users seeking a comprehensive understanding of their system’s interactions. The tool’s ability to validate Python frameworks and support beta testing makes it suitable for those actively involved in the development environment. Start a 30-day free trial.
2. ManageEngine Applications Manager – FREE TRIAL
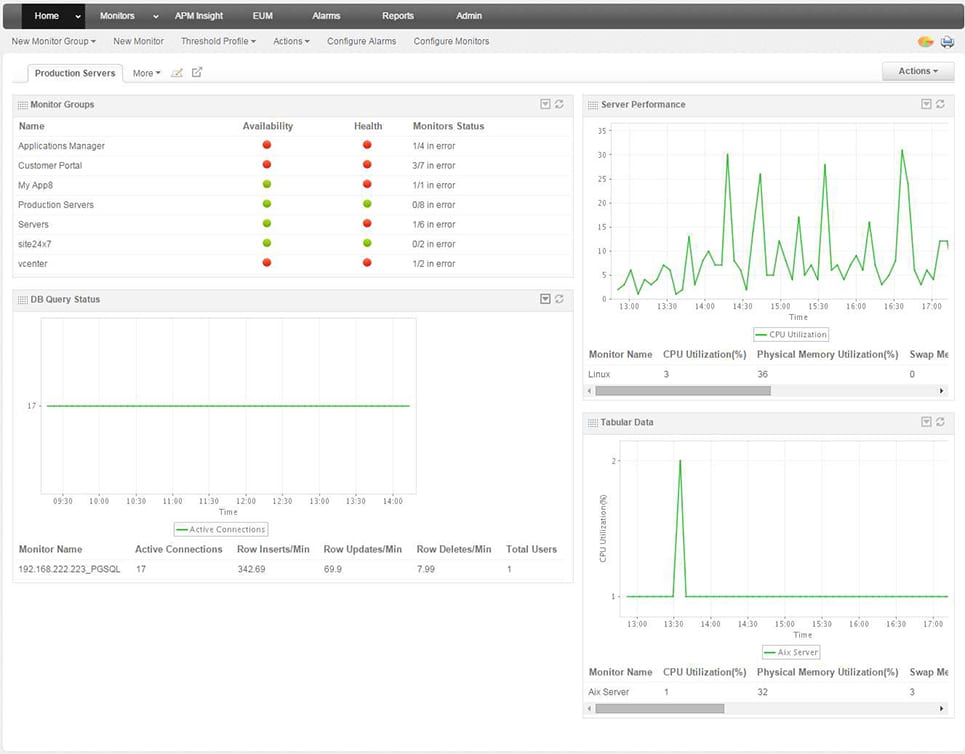
ManageEngine Applications Manager looks at how well your applications and servers are operating. Much like the rest of this list, it can give you an app dependency map to help you identify the connections found between different apps.
Main Features:
- On-premise installation available to Windows Server and Linux
- Long free trial(30 days)
- Synthetic transaction monitoring capabilities
Why do we recommend it?
ManageEngine Applications Manager emerged as an all-rounder tool during our testing phase. With on-premise installation options for Windows Server and Linux, the tool demonstrated its capability to monitor applications and servers effectively. The 30-day free trial allowed us to explore its synthetic transaction monitoring capabilities and gain insights into application dependencies.
This tool can examine the code of individual modules and will distribute its tracing capabilities so that it keeps watch on code within APIs and frameworks. With that being said, it suffers a bit in that it’s unable to find where cloud services are running, and if there are any elements called by them.
Regardless of this, the tool can keep watch of Python code execution regardless of the hosting location. It can also see how Python modules interact with each other and with those written in different languages. The tool can also look over virtualizations, file servers, web servers, databases, and containers. This gives it some much-needed versatility.
Who is it recommended for?
ManageEngine Applications Manager is recommended for users looking for a comprehensive tool to monitor both applications and servers. Its synthetic transaction monitoring capabilities and on-premise installation option make it suitable for businesses with diverse infrastructure needs. The tool’s ability to analyze individual modules and trace code within APIs and frameworks adds value to developers and system administrators. Start a 30-day free trial.
3. ManageEngine OpManager Nexus – FREE TRIAL

ManageEngine OpManager Nexus, formerly OpManager Plus, can monitor all aspects of your infrastructure, including Python scripts and code. It offers code-level insights, so you can quickly identify and fix issues in your Python programs. Also, it can execute Python scripts out of the box after they are imported into the tool.
Main Features:
- Provides insights into the performance of your Python applications.
- Uses distributed transaction tracing to monitor all transactions.
- Measures user experience.
- Leverages apdex graphs to help stay on top of business-critical network services.
- Generates detailed insights into AJAX calls, web transactions, user sessions, and more.
- AI-based insights and recommendations for improving performance.
Why do we recommend it?
OpManager Nexus offers end-to-end visibility into the health and performance of your Python-based applications. In particular, it uses AI to provide insights on potential bottlenecks and their root causes. Using this information, you can address issues before they disrupt end-user experience.
A standout feature for us is its distributed tracing, as it covers every service, request, and database in your infrastructure. It also correlates all the data to provide information about slow executions. Moreover, it tracks the code that is causing these slow executions, so the issue is backed by actionable intelligence. All this information can improve the speed and efficiency of troubleshooting.
Who is it recommended for?
It is recommended for large organizations and enterprises that run a high number of Python applications. It is also a good choice for Python developers who need insights into the code causing issues.
OpManager Nexus starts at $1,233 for 50 devices if you go for the Professional edition. The Enterprise edition, on the other hand, starts at $19,995 for 1000 devices. Start a 30-day free trial.
4. SolarWinds Observability SaaS
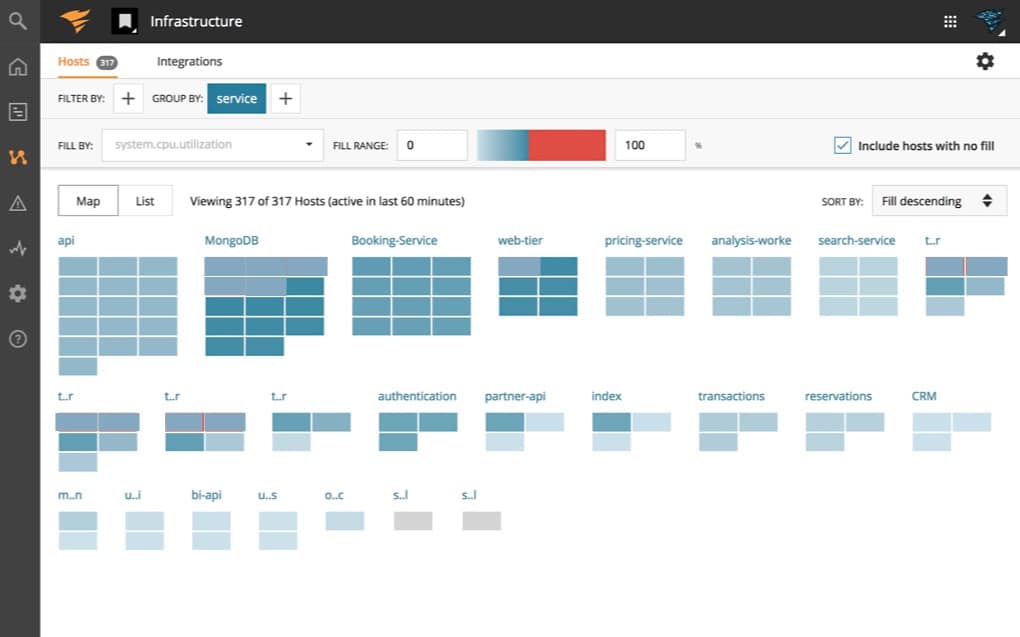
SolarWinds Observability SaaS (formerly AppOptics) has made a name for itself in the monitoring world by making high-quality solutions of all sorts. This is is a SaaS system, meaning you won’t need to have its software on your site in order to take advantage of it. Being a remote service, you don’t need to worry yourself about the constraints of a lone network. This is a great edge in a world continually tending towards microservices and distributed processes.
Main Features:
- Excellent tracking capable of tracking code executions no matter where and how they happen
- Will show you the tracked code alongside what language it is written in.
- Helps you with debugging, solving resource locks, and spotting inefficiencies
- Extremely intuitive GUI that lets you access its advanced features while still remaining reasonably friendly towards new users.
- Two different subscription levels letting you pay for what you need out of the tool
- Made by a firm with an excellent reputation in the industry, which is essentially a guarantee of quality.
- Detailed resource usage breakdowns
- Very versatile, making it an excellent pick regardless of the situation
Why do we recommend it?
SolarWinds Observability SaaS, a versatile Python monitoring tool, proved invaluable in our testing endeavors. The tool excelled in providing in-depth tracking and reporting functionalities, ensuring we were never left in the dark about our system’s performance. During our 30-day free trial, this tool demonstrated excellence in code execution tracking, aiding in debugging, identifying resource locks, and pinpointing inefficiencies.
Any app, especially web services and pages could be calling processes that are executed on faraway servers without you knowing about it. SolarWinds Observability SaaS boasts great tracing functionalities that keep watch over any application execution and tracks its calls very carefully. It’ll track down the underlying processes occurring, identify the programming language used, and show its code on your screen.
The in-built dashboard code analyzer will go through the code step by step, showing you a detailed breakdown of how it uses your resources. This can help you spot bugs, inefficiencies, orphaned processes, or resource locks. This sheer versatility is what makes the tool great, regardless if you’re making software or benefiting from it.
Who is it recommended for?
SolarWinds Observability SaaS (formerly AppOptics) is recommended for businesses and individuals seeking a robust Python monitoring tool. Its versatility makes it an excellent choice for both developers and end-users seeking comprehensive Python monitoring.
Whether you are developing software or utilizing Python-made applications, this tool offers a comprehensive solution. Its detailed resource usage breakdowns and intuitive GUI make it suitable for users of varying technical expertise. The subscription model, with two different plans based on the number of servers, provides flexibility for different business sizes.
Pricing
SolarWinds Observability SaaS is paid for in a subscription model, with its rate being based on the number of servers you need to be covered. There are two subscription plans, the first being “Infrastructure Monitoring,” this one will track all of your system’s supporting services. However, in order to get Python monitoring from this tool, you’ll need to have the “Infrastructure and Applications Monitoring” plan. These services also sport a 30-day free trial so you can check if they’re for you before you purchase.
5. Datadog APM
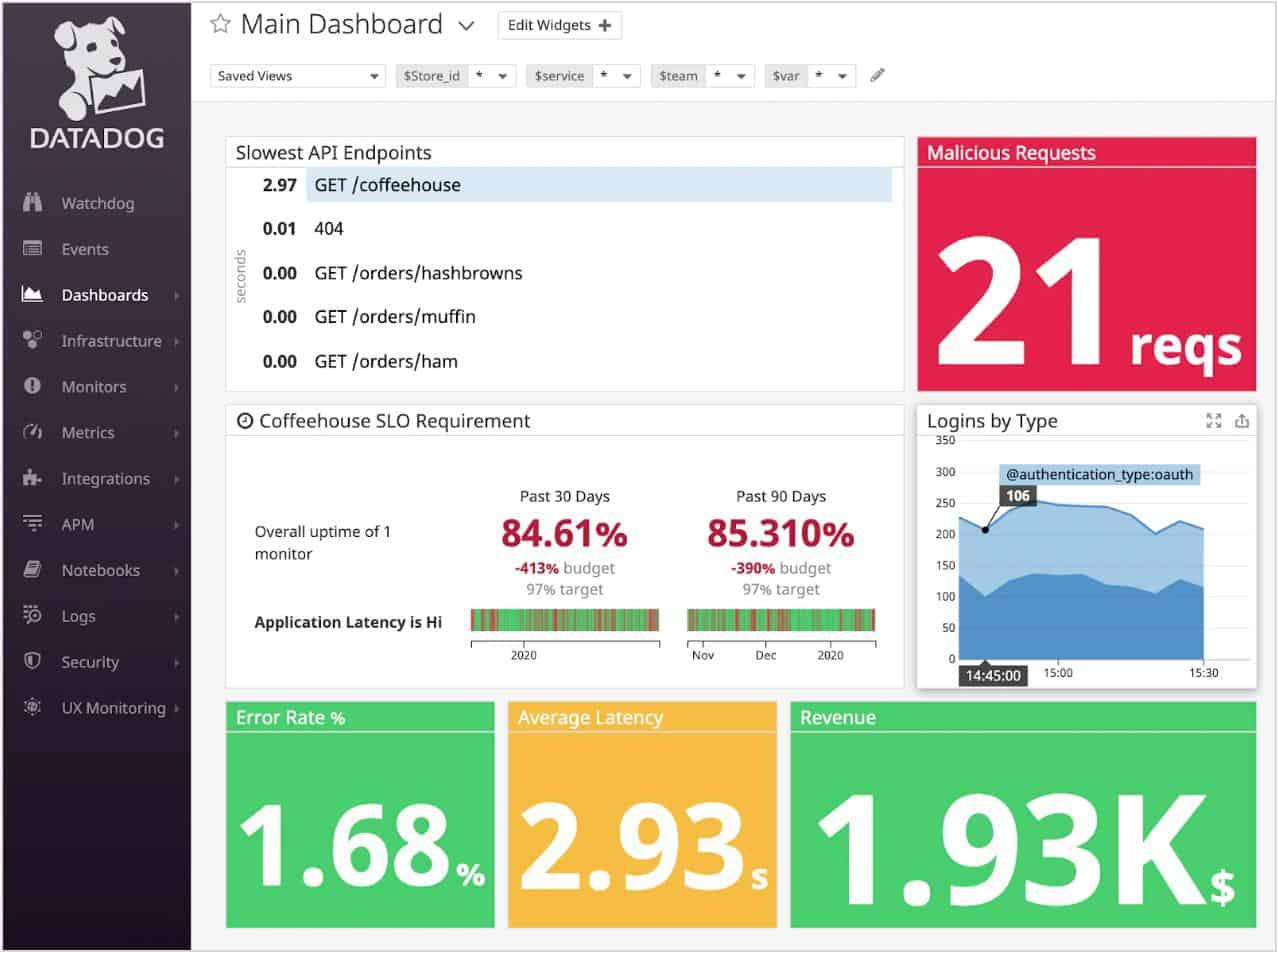
Datadog APM gives you a variety of different monitoring features to help you track Python performance. This is yet another cloud-based tool, capable of monitoring the code on your site and anywhere else it operates. This tool is ideal for DevOps environments because you can look at the code that you develop and track the actions of every individual API integrated within your software. Datadog APM is also capable of tracking a variety of other languages, rather than being limited to Python.
Main Features:
- DevOps specialization
- Synthetic monitoring and other tracing tools in-app
- It will track the impact of all of your APIs separately
- Cloud-based
- Code-level tracing facility(only in the APM & Continuous Profiler plan)
Why do we recommend it?
Datadog APM, with its DevOps specialization, stood out as an excellent choice for tracking Python performance. The tool’s cloud-based nature allowed us to monitor code both on-site and elsewhere it operates. The ability to track the impact of individual APIs separately and support for multiple languages made Datadog APM a versatile solution.
Being geared towards DevOps, it has testing tools like synthetic monitoring and tracing. Although the synthetic monitoring feature is locked behind an additional module you’d need to add to your Datadog account.
Who is it recommended for?
Datadog APM is recommended for DevOps teams and businesses with a focus on comprehensive monitoring across different languages. Its cloud-based dashboard, synthetic monitoring, and tracing tools make it suitable for users involved in the operations phase.
The tool’s capability to monitor interactions of Python objects with other modules adds value to businesses with diverse software setups. While some features like code-level tracing may require additional modules, the tool offers a comprehensive set of monitoring features for DevOps environments.
Datadog offers a 2-week-long free trial of the tool.
6. Dynatrace
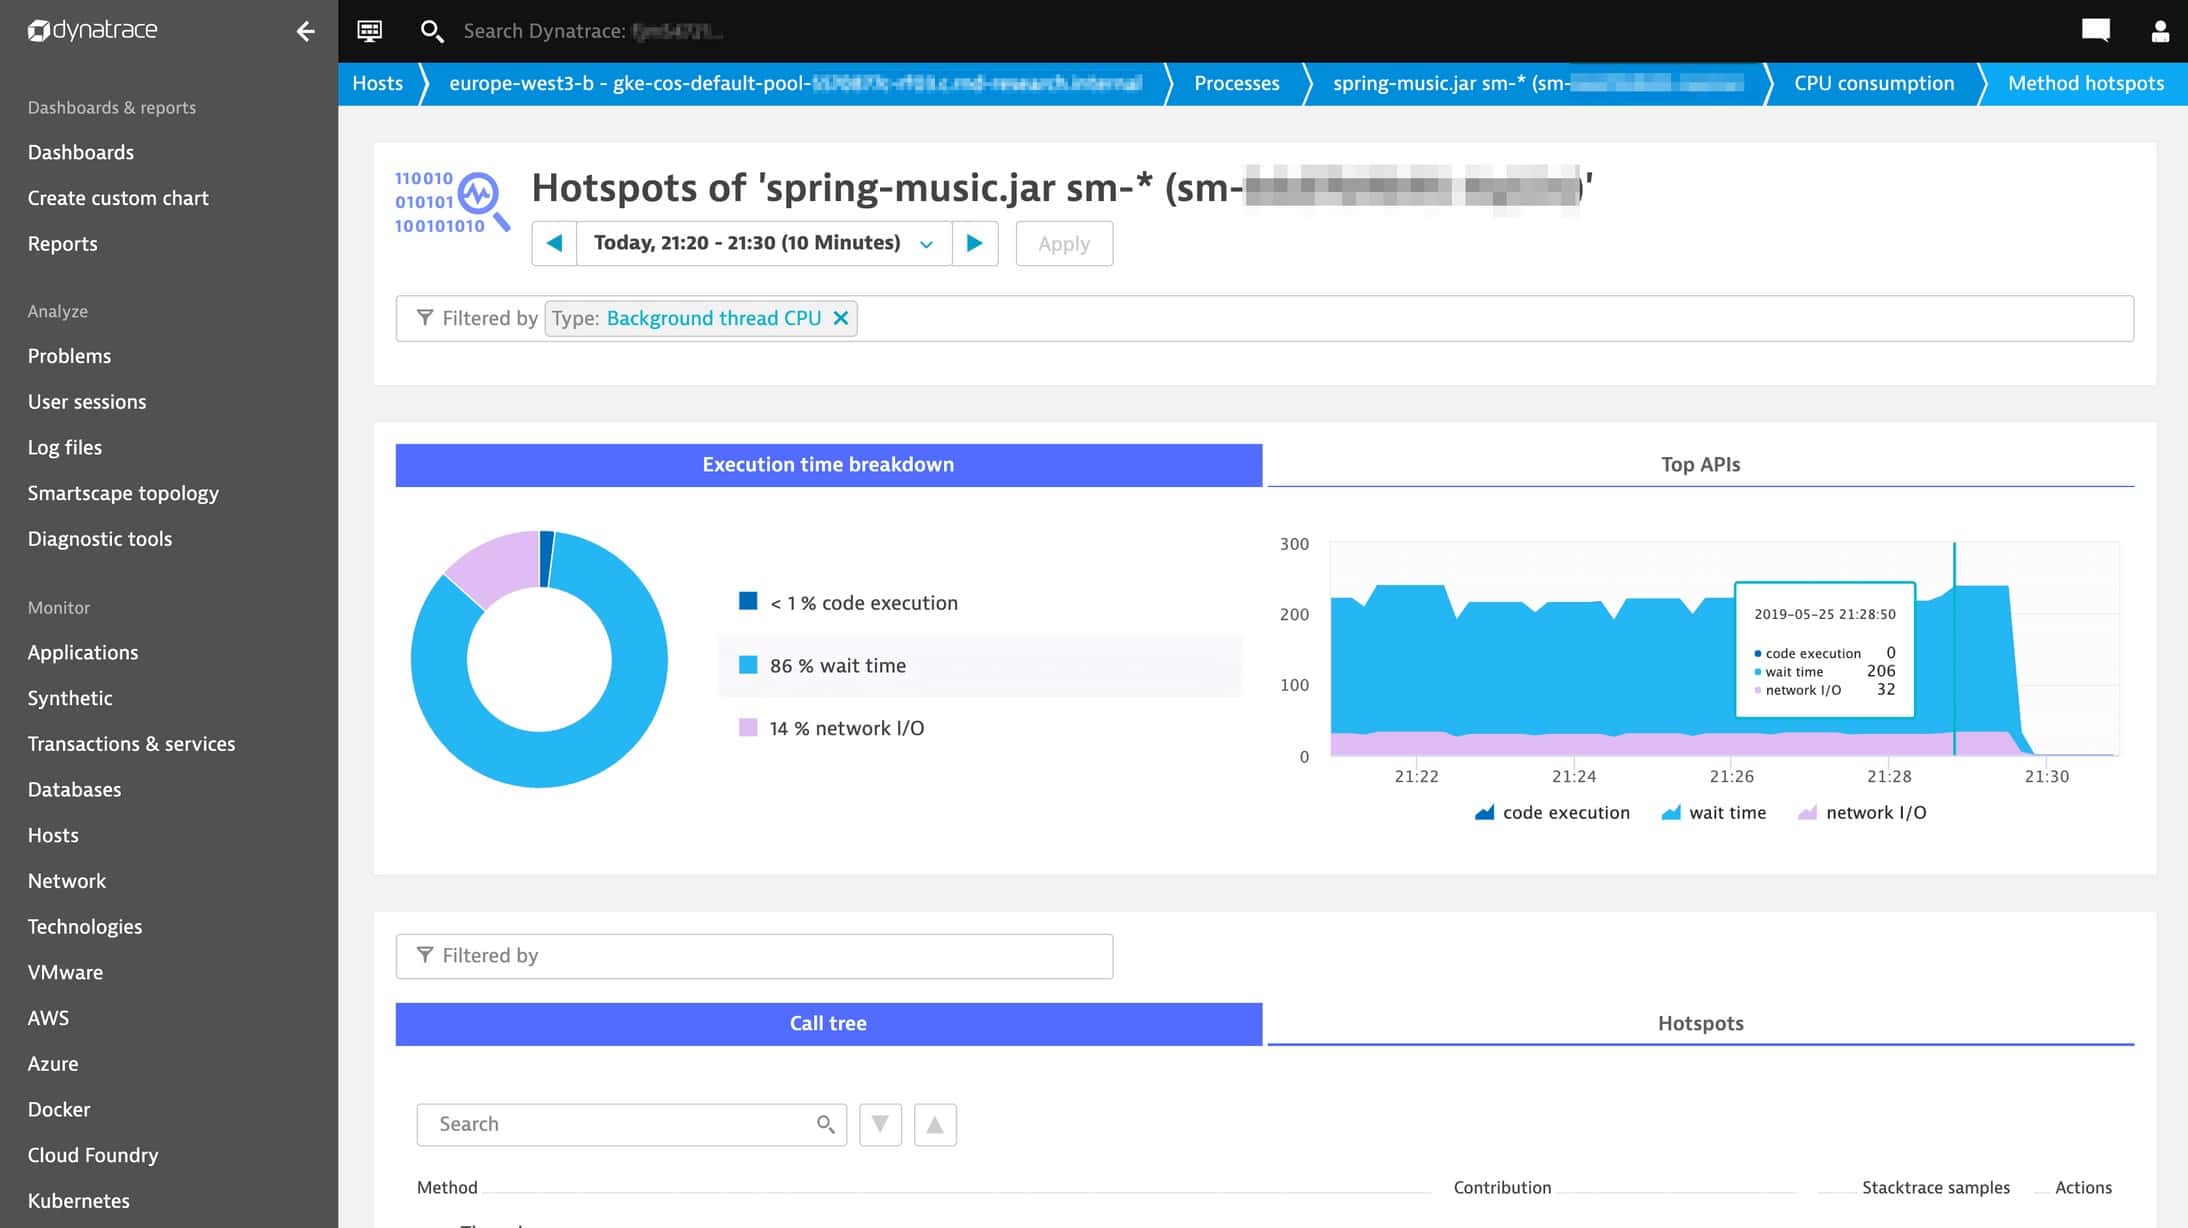
Dynatrace takes advantage of artificial intelligence-powered techniques in order to enhance its monitoring capabilities. It’s capable of tracing all of the processes that contribute to the functioning of your software. Dynatrace does constant sweeps, finding apps, services, and their interaction. When it finds a piece of software, it digs deep into it, trying to find all of the modules that contribute to it.
Main Features:
- Optimized for Dev teams and system administrators working on complex systems.
- Cloud-based dashboard you can access from the browser of your choice
- Dynatrace takes a deep look at each one of your modules
- The tool is constantly sweeping, on alert
- Great visualizations help you get a feel for your system by showing you a detailed map.
Why do we recommend it?
While we were using Dynatrace, it impressed us with its use of artificial intelligence-powered techniques for enhanced monitoring. The tool’s constant sweeps and deep examination of modules provided a detailed understanding of the software’s functioning. Dynatrace’s ability to trace processes, identify programming languages, and observe module performance make it a sophisticated monitoring tool.
Once Dynatrace has examined a module, it’ll detect what programming language was used to write it. Then, it will observe the performance of each individual module and inspect how they interact with your resources. Dynatrace is even capable of tracking down what server the code’s being run on- an extremely hard job for an API-fronted module.
Who is it recommended for?
Dynatrace is recommended for testing engineers and DevOps teams working on complex systems. Its AI-powered features, cloud-based dashboard, and constant sweeps make it suitable for users seeking a deep understanding of their software’s performance. The tool’s predictive capabilities and ability to analyze interactions of Python modules across different languages contribute to its effectiveness.
Although Dynatrace has a variety of different packages, you’ll need the Full-stack Monitoring one if you want to get Python monitoring. With that being said, there is a 15-day free trial so you can see if you’re getting your money’s worth.
7. AppDynamics
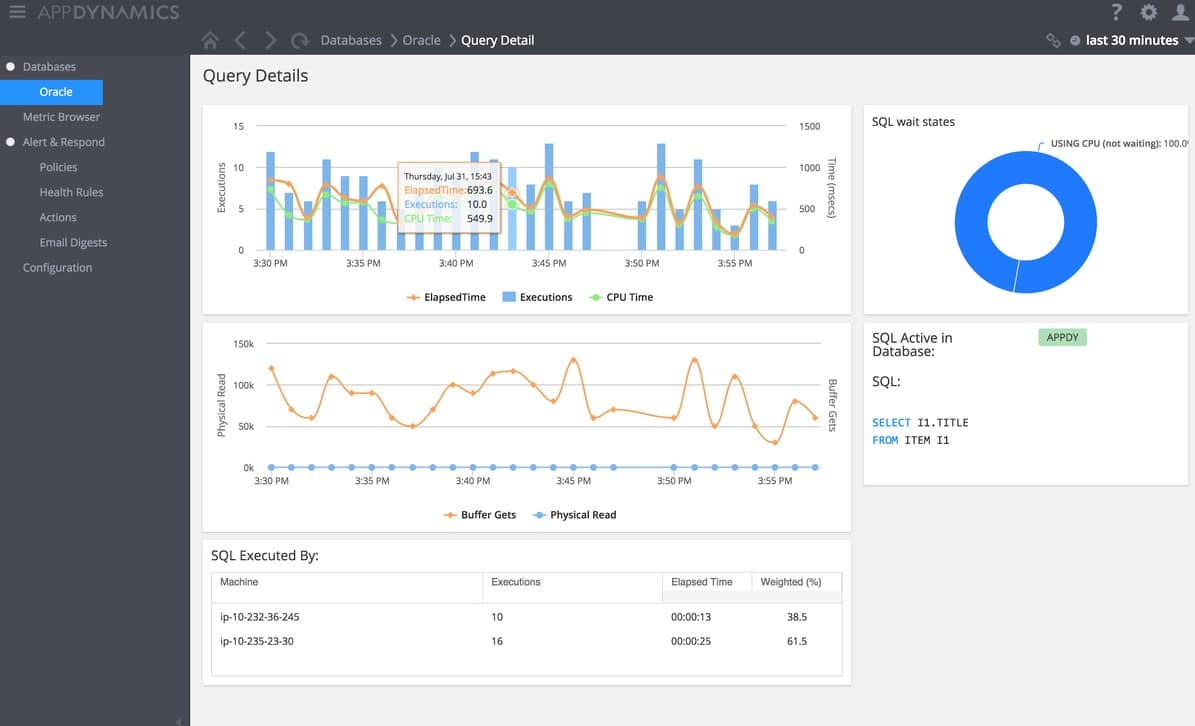
AppDynamics is yet another cloud-based tool taking advantage of AI in order to process and analyze functions and their interactions with your systems. AppDynamics stands apart from the crowd with its organization, being split up into several different services. Python tracing & monitoring is found in the “Infrastructure and Application Performance Monitoring” service. The good thing is you can either get this by itself, or you can purchase the whole premium plan packed with various kinds of monitoring(application, database, and infrastructure monitoring.) The Enterprise plan has all of this with the addition of Business Performance Monitoring. This can be very useful when determining how your current software setup is favoring your business as a whole.
Why do we recommend it?
In our recent testing, we took AppDynamics for a spin. With its cloud-based approach and AI integration, it offers a comprehensive solution for monitoring Python performance. The tool’s app dependency mapping, organizational split into different services, and Business Performance Monitoring feature make it stand out. Its AI-driven Cognition Engine enhances resource prediction and availability alerts.
Main Features:
- Service-based purchases make it easy to get exactly what you need
- Business Performance Monitoring is an excellent feature that’s quite underrepresented in the industry
- Its Cognition Engine can predict resource needs in advance
- AppDynamics takes advantage of AI to make it as robust as possible
The main pillar of AppDynamics’ approach is its app dependency mapping. This feature will identify all of the applications that contribute to a certain system and then look at the connections between them.
After this, the service looks at every individual app and figures out where its modules are running. You can pick an individual node and then analyze its components in detail.
Its Python monitoring capacities expose the interactions of individual Python objects with other contributing modules and your resources regardless of where these programs are running.
The AI integration of AppDynamics, Cognition Engine, is used to assess the performance requirements of each of your modules. Then, it predicts how many resources it is going to need to match up with its target response time. It will also alert you in case you aren’t projected to have that much resource availability.
Who is it recommended for?
AppDynamics is recommended for businesses and individuals seeking a cloud-based tool with AI integration for in-depth monitoring. Its service-based purchases offer flexibility, allowing users to choose the specific monitoring they need.
The tool’s Python monitoring capacities, app dependency mapping, and Business Performance Monitoring make it suitable for DevOps teams and businesses focusing on holistic software performance analysis.
Whether users opt for the Infrastructure and Application Performance Monitoring or the complete Enterprise plan, AppDynamics provides Python monitoring capabilities across the development lifecycle.
Every version of AppDynamics has a subscription paid monthly, with a 15-day trial available.
Which Python monitoring tool is right for you?
The most important thing to know when picking a Python monitoring tool is your business’s exact needs. Our first pick won’t necessarily be your first pick(although we made sure that it’s versatile enough that you can’t really go wrong with it.) So figure out what your business needs most and then look through the list for a tool that best matches that.
Did we miss your favorite Python monitoring tool?
What do you think about the trend of increasing reliance on APIs?
Let us know in the comments below!