MongoDB monitoring can be quite rough despite the in-built monitoring tools. Although they’re quite satisfactory for most routine cases, on occasion, the gaps they leave will start to show, for example, they lack any kind of large-scope analytics or metrics.
Today, we’ll be looking at the best tools you can use in order to make your MongoDB monitoring a lot easier.
Our list of the best MongoDB monitoring tools is as follows:
- Site24x7 – FREE TRIAL A tool supported by over 450 vendors, incorporating a whole suite of different services beyond monitoring your MongoDB databases. Get a 30-day free trial.
- ManageEngine Applications Manager – FREE TRIAL This application monitoring package provides system discovery and dependency mapping and it has a special integration for monitoring MongoDB. Runs on Windows Server, Linux, AWS, or Azure. Start a 30-day free trial.
- ManageEngine OpManager Nexus – FREE TRIAL An integrated monitoring tool that can provide information about your MongoDB’s health, resource usage, query performance, and security. Download a 30-day free trial.
- Paessler PRTG – FREE TRIAL The PRTG is a sensor-based tool that lets you pick and choose what kinds of monitoring you need. Get a 30-day free trial.
- SolarWinds Database Performance Monitor Delivers a deep yet intuitive monitoring experience that’s easy to set up, with cloud, on-premises, and hybrid installation options.
- Datadog An entirely cloud-based tool that does an excellent job of simplifying an otherwise complex area. Its alert customization system is also a cut above the rest.
- HumongouS.io A free tool that offers you some of the more basic insights you might need. Although not made exclusively for monitoring, it can be a great addition to your toolkit.
- Nagios A tool that tries to simplify and automate as much of the monitoring process as possible.
- Mongostat & Mongotop Tools that come with MongoDB and can be quite helpful in a pinch.
The Best MongoDB Monitoring Tools
1. Site24x7 – FREE TRIAL
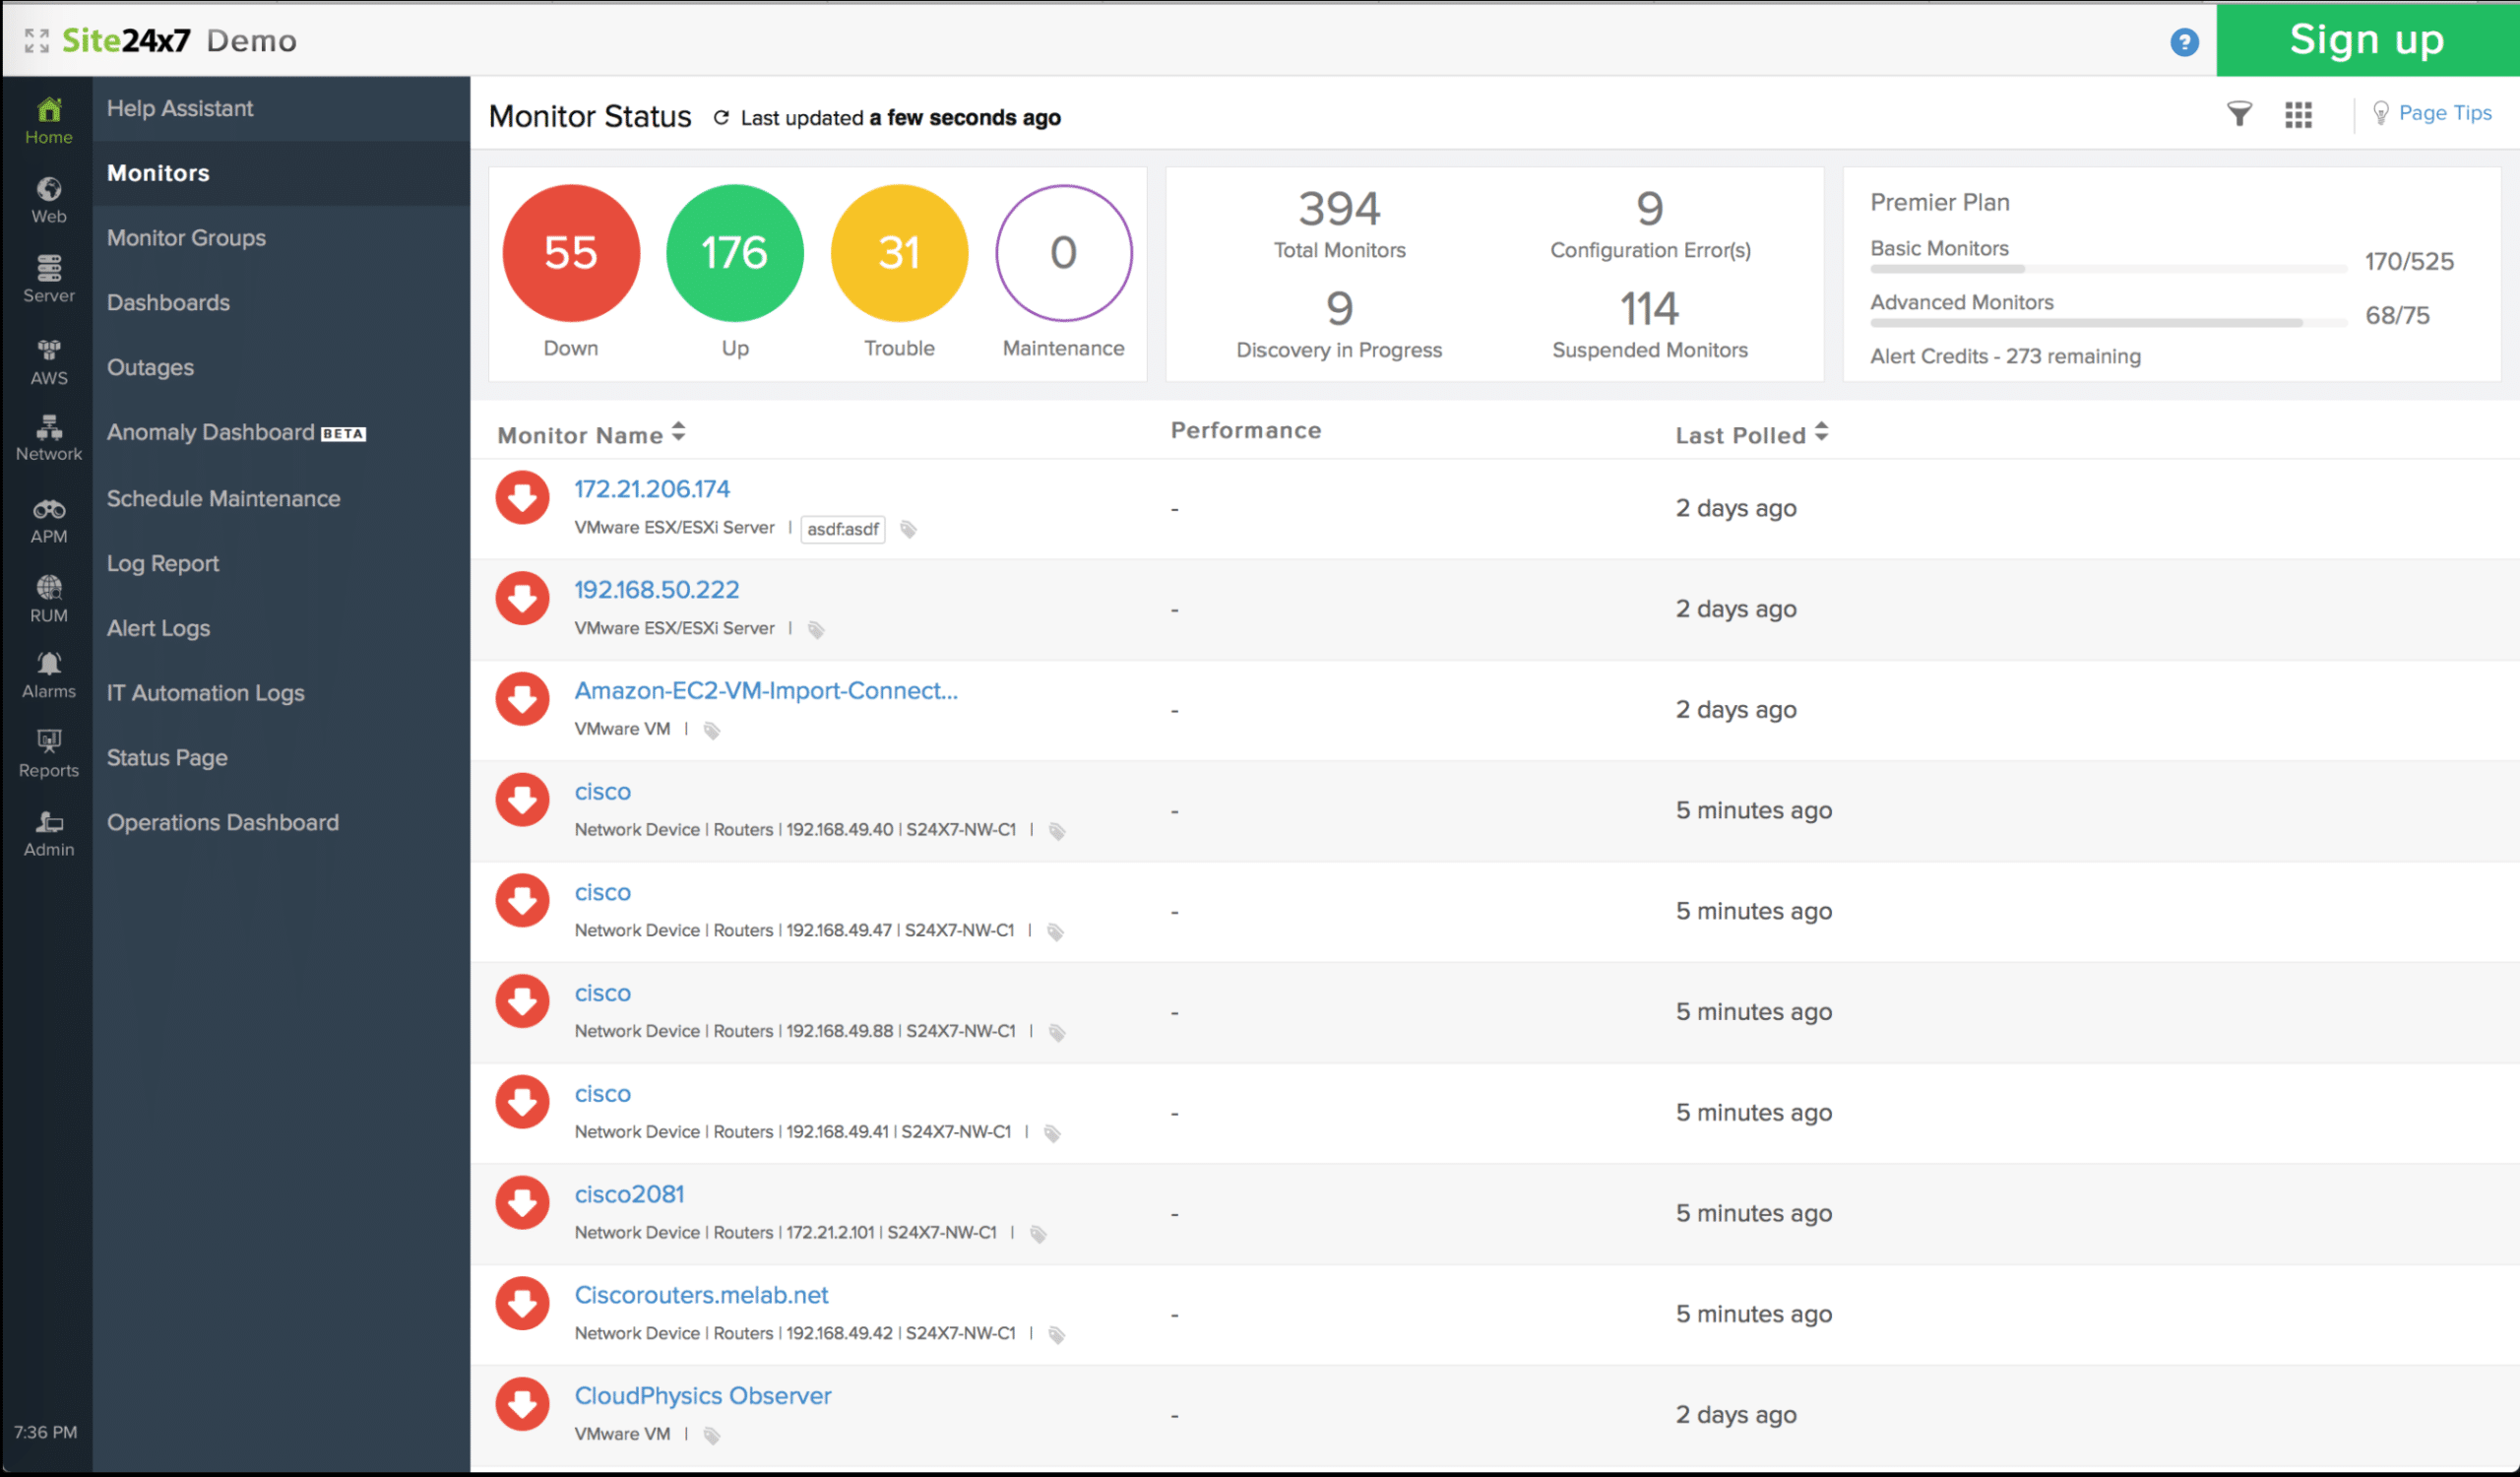
Site24x7 provides you with an entire suite of app and server monitoring tools. This cloud-based tool gives you multi-environment monitoring access. Due to its simple, plugin-based installation, it’s extremely easy to begin monitoring your MongoDB databases together with any other services you’d like to look at.
Main Features:
- Robust and customizable alarm system makes reacting to problems a lot more efficient
- The tool comes with the ability to act as your centralized log management and storage repository
- It’s supported by over 450 different vendors
- You can easily look at historical data
- Full APM suite access
- Add-on compatibility gives you limitless customization
Why do we recommend it?
During our evaluation, Site24x7 emerged as a top-tier MongoDB monitoring tool, offering a cloud-based suite with over 450 vendor integrations. Its plugin-based installation simplified the monitoring process, providing visibility into metrics such as total open cursors and heap usage.
Site24x7’s multi-environment monitoring and extensive vendor support allowed us to monitor MongoDB alongside other services seamlessly. The customizable alarm system efficiently alerted us to performance issues, ensuring timely responses.
This tool provides full visibility of a variety of metrics, such as your total open cursors, heap usage, etc. All of this data is then collected with a simple Linux server monitoring agent.
One of the biggest selling points of this tool is its support of over 450 different vendor integrations. It’ll also give you a whole suite of different services apart from monitoring your MongoDB databases, making it an excellent tool for companies using multiple infrastructures.
The Alarms page lets you pay close attention to all of your alerts, and you can set custom thresholds to monitor a variety of conditions. You can also assign these alarms to specific teams, so you don’t send out notifications to whole departments whenever there’s an issue.
Who is it recommended for?
Site24x7 is recommended for businesses using multiple infrastructures, seeking a comprehensive monitoring tool. Its flexibility, historical data access, and APM suite make it suitable for diverse industries.
Site24x7 starts you off at $35 each month and gives you a variety of different features depending on your subscription model. It also has a very generous 30-day free trial!
2. ManageEngine Applications Manager – FREE TRIAL
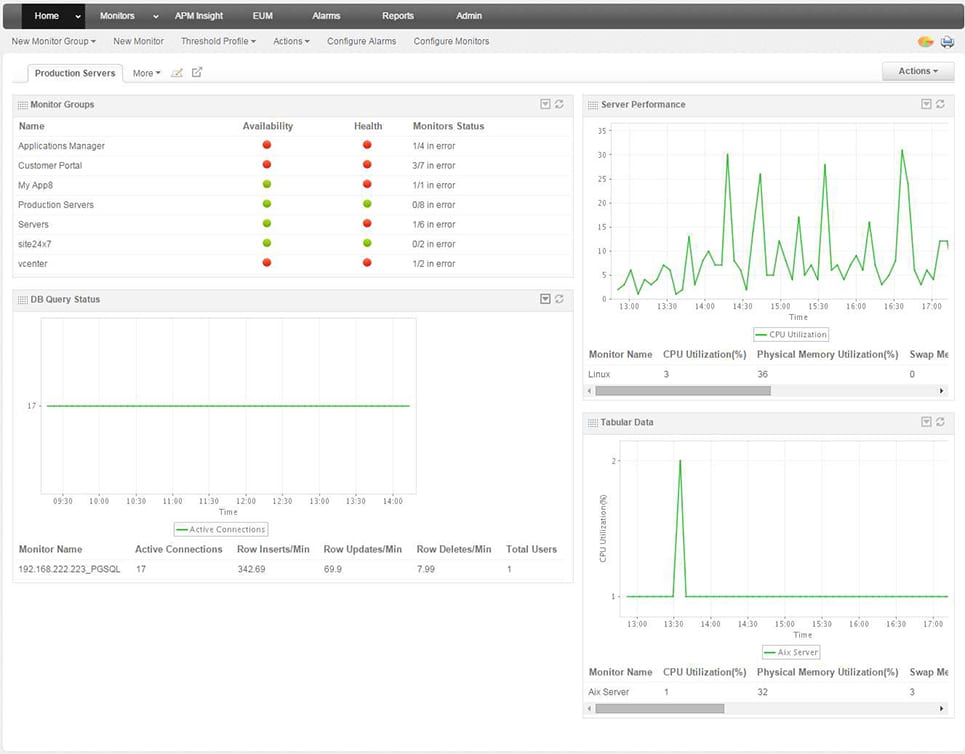
ManageEngine Applications Manager provides monitoring for applications and infrastructure, including database systems such as MongoDB. This software package can be extended by activating integrations, and there is one of those extensions available for MongoDB. As well as activating specialized sensors within the software, this integration creates a new screen in the Applications Manager dashboard for MongoDB operating statistics.
Key Features:
- Activity statistics
- Alerts for performance problems
- Displays of resource capacity and current utilization
Why do we recommend it?
ManageEngine Applications Manager proved to be a valuable MongoDB monitoring solution during our testing. This application monitoring package, with a dedicated MongoDB integration, provided system discovery, dependency mapping, and insightful operating statistics. Its activity statistics, alerts for performance problems, and resource capacity displays efficiently addressed our MongoDB monitoring requirements.
The MongoDB monitoring service records regular activity metrics and also keeps an eye on resource availability. The system includes performance thresholds, which you can tune to levels that would indicate a drop in response times. The service can also track the success or failure of administrative activities, such as replication.
Applications Manager is able to monitor multiple technologies simultaneously. It discovers all of your applications and then draws up an application dependency map. With this record of relationships, the tool can identify which applications interact with your MongoDB instances. If a problem occurs in a user-facing system, the dependency map provides root cause analysis, so system managers can quickly identify the real issue.
You can set up the Applications Manager to forward alerts to your team members via SMS or email. The tool can also be organized so that it generates a ticket for your Help Desk system, thus automatically getting a support technician allocated to the problem.
Who is it recommended for?
ManageEngine Applications Manager is recommended for businesses seeking comprehensive application and infrastructure monitoring, with specific support for MongoDB. Its scalability makes it suitable for both single-site businesses and large enterprises.
There is a Free edition of Applications Manager and that will monitor MongoDB. However, it is limited to monitoring only five applications. The Professional edition is suitable for a single-site business and the Enterprise edition is designed for large multi-site enterprises.
You can examine Applications Manager with a 30-day free trial.
3. ManageEngine OpManager Nexus – FREE TRIAL

ManageEngine OpManager Nexus, formerly OpManager Plus, is an ITOps platform that provides deep visibility into MongoDB-relevant metrics and KPIs, so you can better understand the current state and the potential issues. Using these insights, you can identify the root cause of problems and fix them before end-users experience any disruptions.
Key Features:
- Tracks the usage of critical resources, like CPU, memory, and I/O.
- Displays the KPIs on dashboards for easy understanding.
- Identifies the slow queries and their potential causes.
- Makes it easy to set static and dynamic thresholds.
- Offers alert-driven workflows to trigger actions.
Why do we recommend it?
We recommend this tool because it provides detailed insights into your database operations. You can get a wide range of information related to its resource usage rates, security, and more. Armed with this data, you can make informed decisions related to your MongoDB databases.
Additionally, OpManager Nexus provides historical analysis of your trends, so you have a long-term view of the changes. When this information is combined with ML-based forecasts, you can accurately plan your future capacity.
Its reports are also an advantage, as you can schedule them ahead of time or generate on-demand reports as needed.
Who is it recommended for?
OpManager Nexus works best for organizations running multiple database vendors because of its wide support and coverage. It can also be handy for database administrators and developers responsible for maintaining a database.
OpManager Nexus is priced at $1,233 for the Professional edition and $19,995 for the Enterprise edition, respectively. Start a 30-day free trial.
4. Paessler PRTG – FREE TRIAL
Paessler PRTG is another full-service monitoring solution that offers custom sensors to monitor specific metrics across multiple databases, servers, and applications. Its flexibility and robust monitoring capabilities make PRTG a good choice if your organization is looking to monitor other aspects of the network along with your MongoDB.
Key Features:
- Freeware version
- Multiple sensors for different environments
- Flexible notification integrations
Why do we recommend it?
In our testing, Paessler PRTG stood out as a flexible and robust monitoring solution, offering custom sensors for specific MongoDB metrics. PRTG’s sensors allowed us to monitor specific MongoDB metrics, such as query operations and missed connections, enabling us to address performance issues promptly.
Sensors can monitor a range of health metrics in MongoDB, such as query operations, used connections, missed connections, and other specific command operations per second across the database. These metrics get pulled down into the main PRTG dashboard where the information is displayed both through visualizations and a live flowing log.
Alerts can be set up to send notifications when a sensor breaches a specific threshold, changes status, or has a change in values. Creating alerts is a relatively straightforward process, allowing you to get as granular as needed for certain conditions.
Alerts can be sent across a number of channels, including SMS, email, SNMP, Slack, Microsoft Teams, or push notifications via the mobile app. Currently, pricing for PRTG is related to how many sensors you wish to deploy across an environment. Each sensor is able to monitor a single metric, so many times a database will need multiple sensors to report on different metrics.
Who is it recommended for?
Paessler PRTG is recommended for organizations seeking a customizable monitoring solution across databases, servers, and applications. Its freeware version and flexible pricing based on sensor deployment make it suitable for businesses of varying sizes.
There are five pricing packages available with the first being PRTG 500, which offers perpetual licensing for 500 sensors across a single server for $1750 (£1269). You can test out PRTG through a free 30-day trial. Once the trial is over, your account will automatically revert to the freeware version, which limits you to 100 sensors.
5. SolarWinds Database Performance Monitor
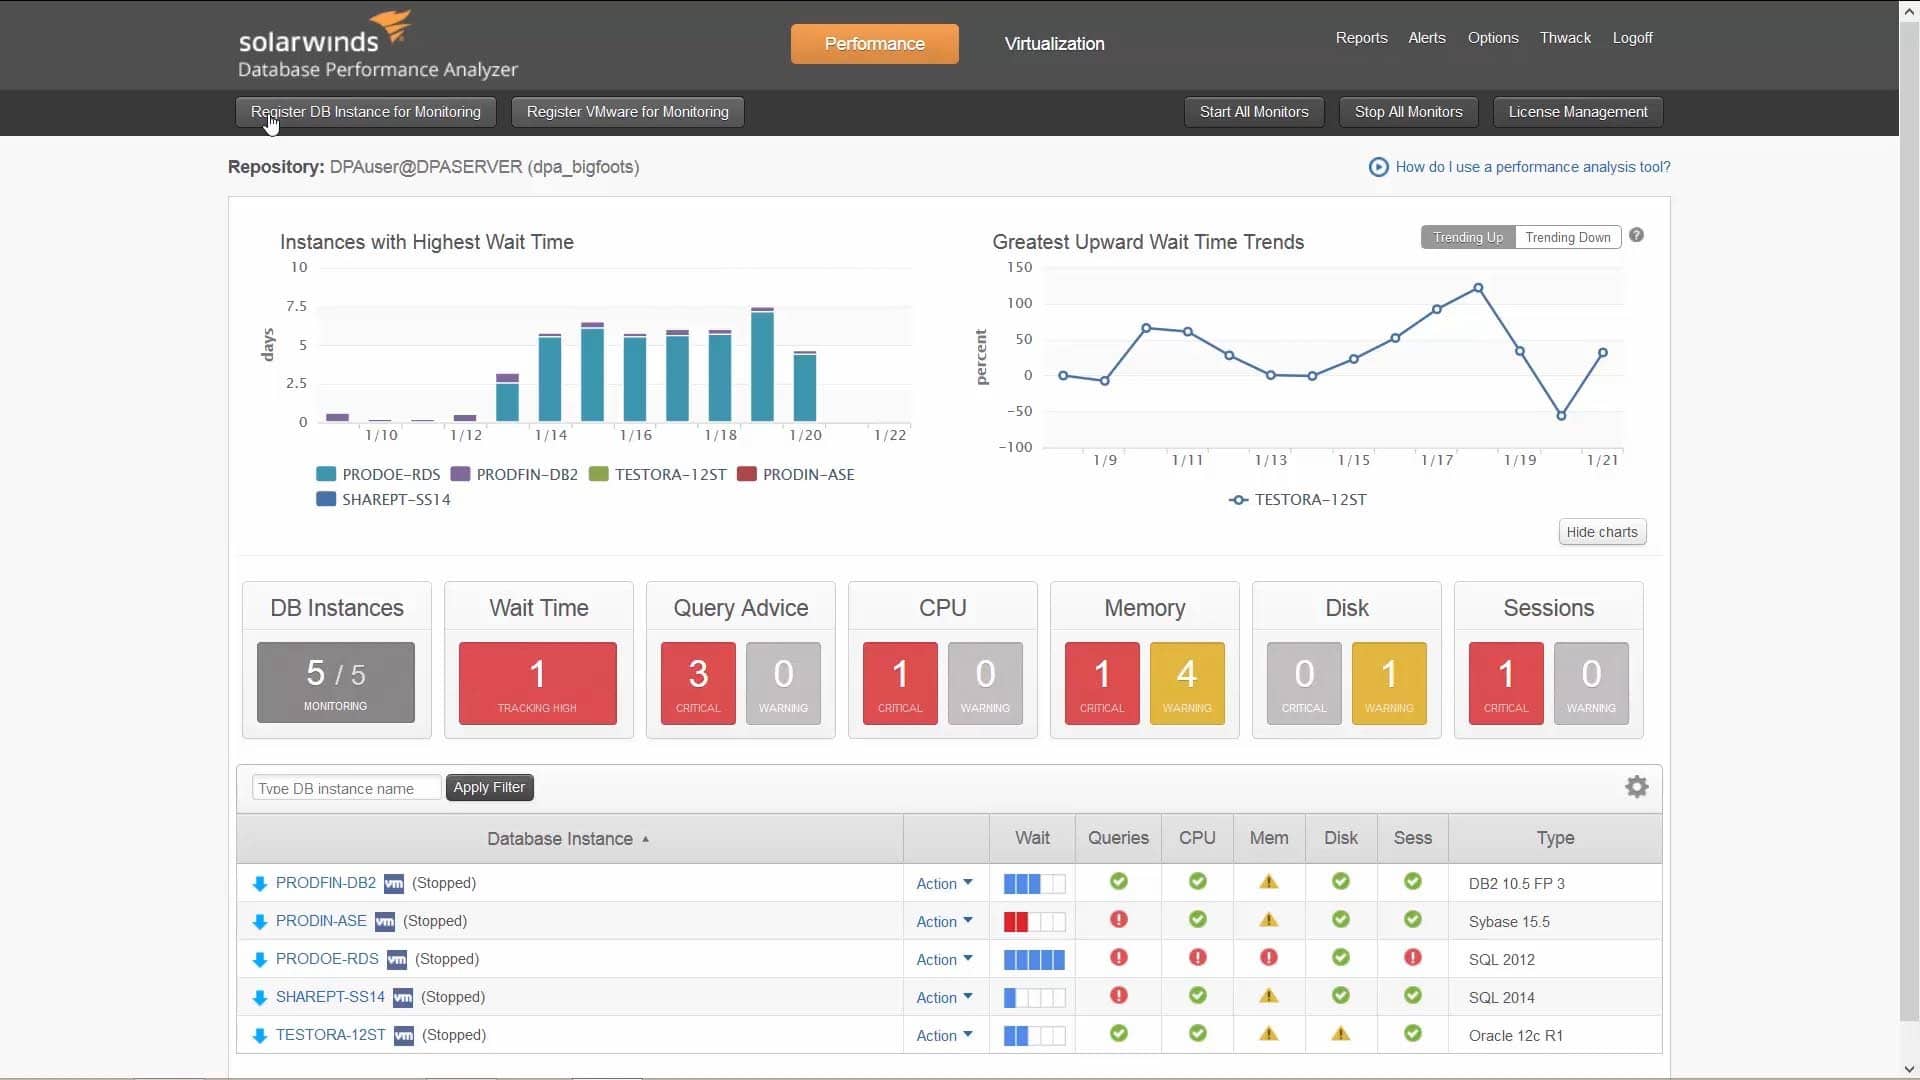
Made by the reputable SolarWinds company, the Database Performance Monitor is a tool based on SaaS that gives you access to both historical and real-time metrics for your database environments.
Main Features:
- User-friendly and fully customizable dashboard
- Automatic profiling analysis
- The tool has presets geared towards MongoDB
- Continuous scanning of security settings and configs on all of your deployments
- Efficient detection of issues
- The best practices scan utility automatically scans a variety of parameters to give you a heads up
- Cloud, on-premise, and hybrid solutions are available
Why do we recommend it?
In our comprehensive testing, the SolarWinds Database Performance Monitor stood out as the definitive choice for MongoDB monitoring. With a custom-made template for MongoDB, it simplified the monitoring of various metrics, including latency and top queries.
The DPM’s continuous scanning of security settings identified potential vulnerabilities, allowing us to proactively address and enhance our database security. This, coupled with efficient issue detection, ensured a robust and secure MongoDB environment.
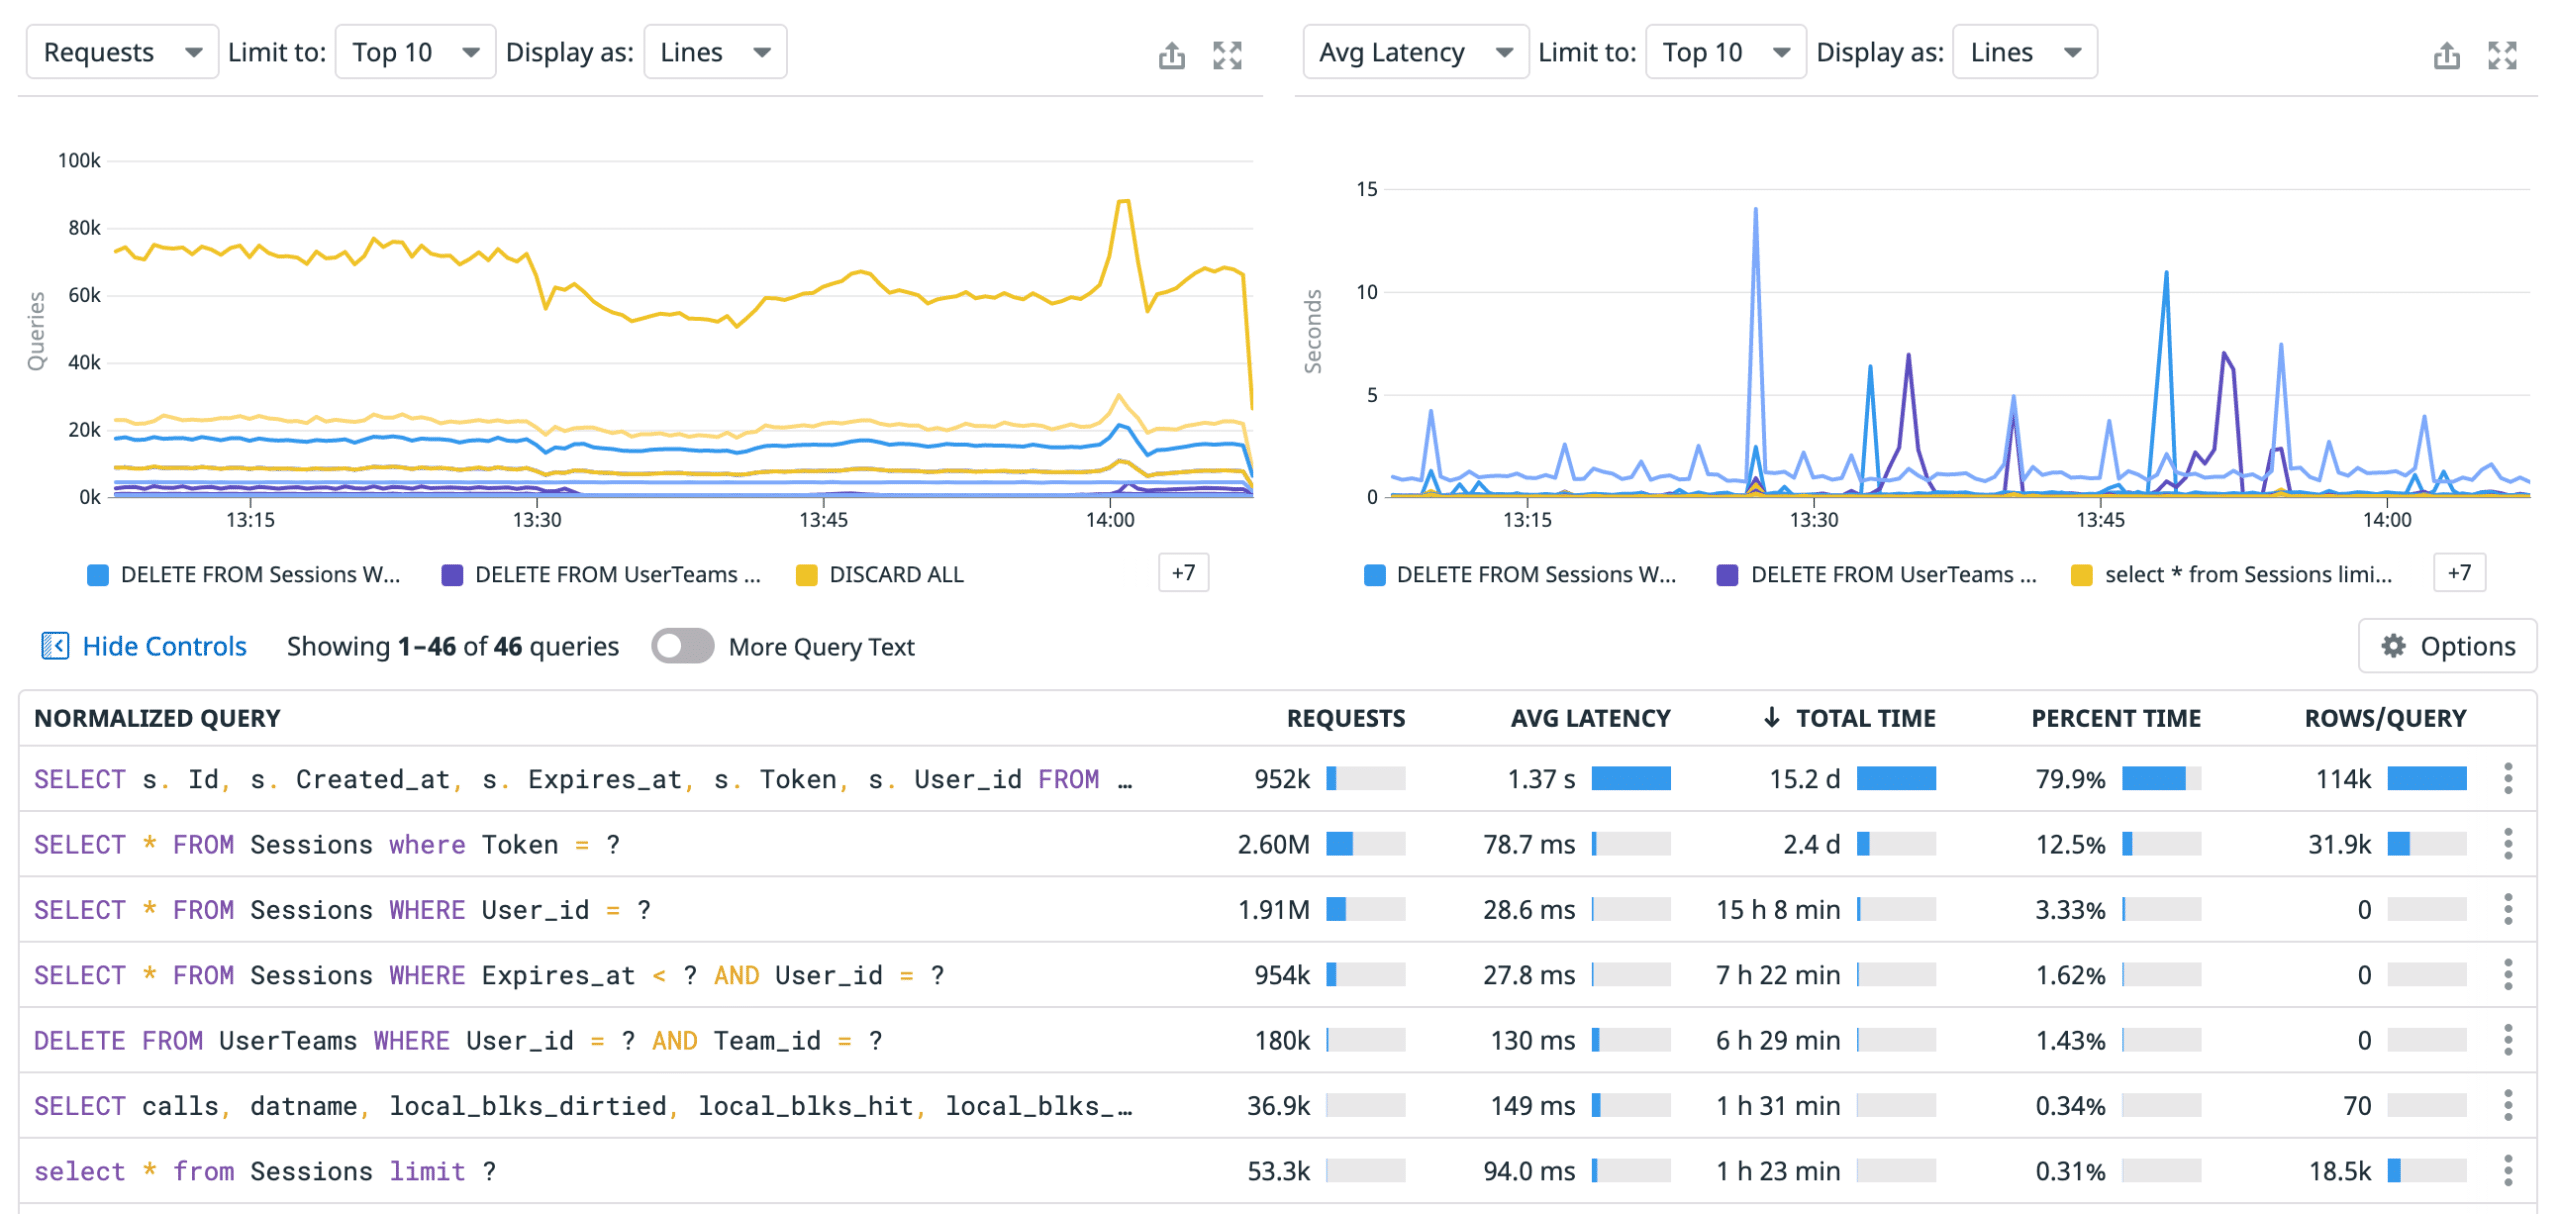
This platform has a template custom-made for MongoDB, this lets your DevOps and admins have an easier time monitoring a variety of different metrics like latency, top queries, and others, all at once.
When your metrics have been gathered, the tool will represent them on an intuitive dashboard. You can pick and choose what metrics you want to see, as well as what way of representing them suits your needs the most. The default layout will show you the core metrics that you’re most likely to need, but you can customize it as you see fit.
The DPM is our top MongoDB monitoring tool due in part to its versatility. However, its biggest selling point is how easy it makes using all of its complex functionalities.
Who is it recommended for?
SolarWinds Database Performance Monitor is recommended for DevOps and admins requiring a sophisticated yet user-friendly MongoDB monitoring solution. Its versatility, with options for cloud, on-premises, and hybrid installations, caters to diverse IT environments.
If you aren’t convinced of its quality quite yet, you can embark on a 14-day free trial!
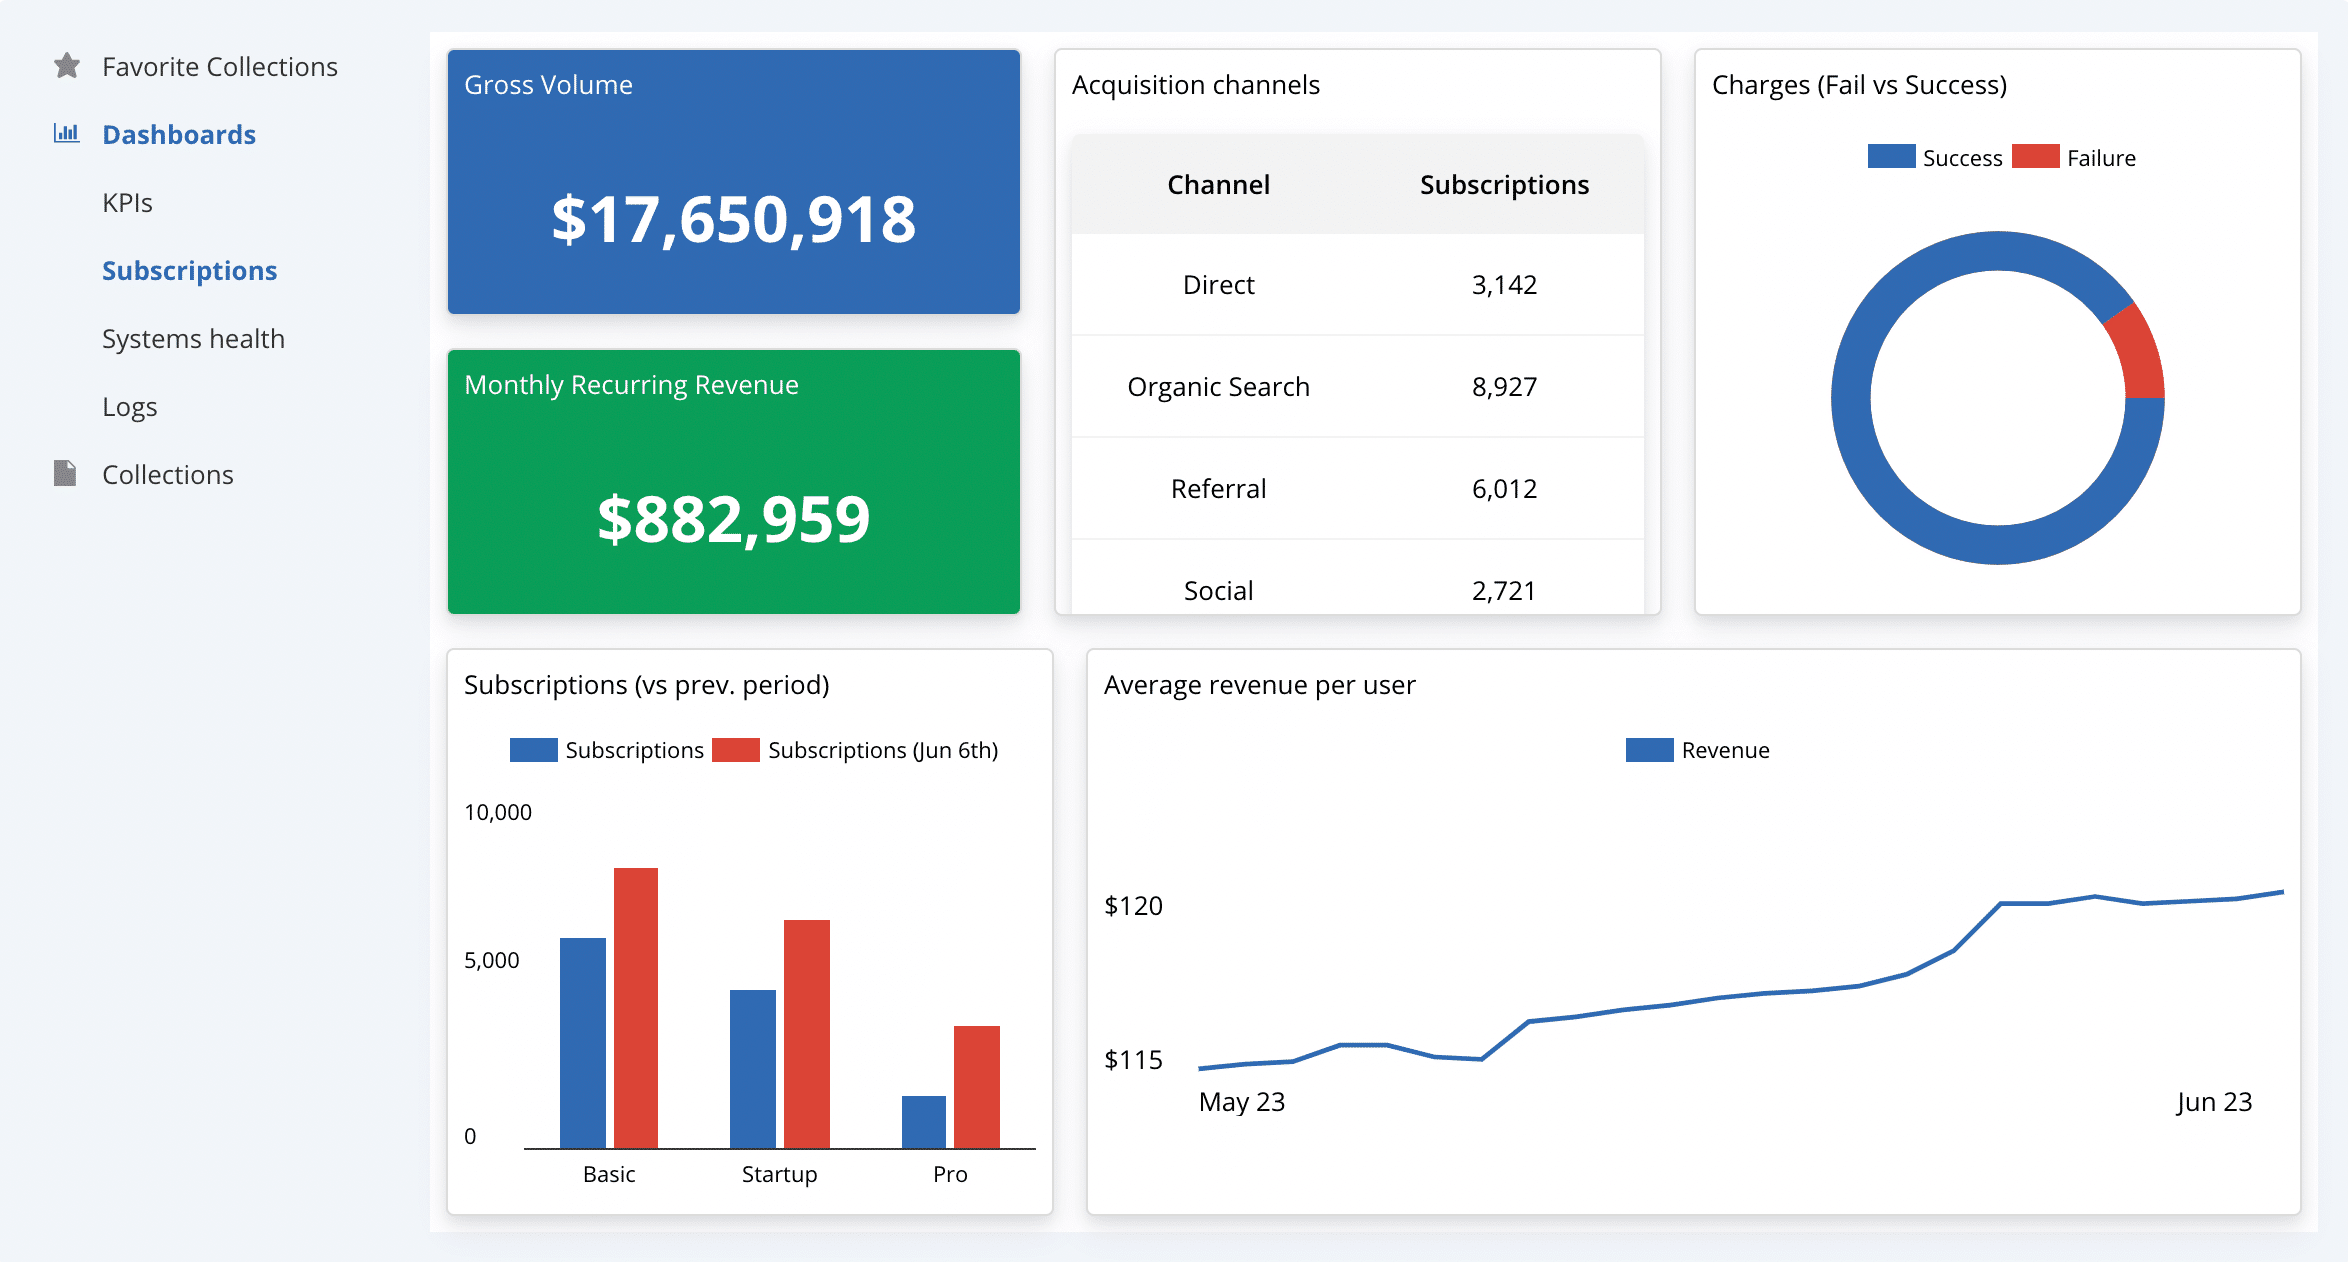
6. Datadog
Datadog is our top MongoDB monitoring tool existing solely on the cloud. It prides itself on the simplicity of deployment, as you won’t need to get any add-ons when you’re setting up Datadog to monitor your MongoDB database.
The Datadog platform tries to simplify database admin by automating as much of it as possible. It also focuses its efforts when it comes to visualization on the metrics that have been shown to create a large impact. The MongoDB integration provided by Datadog is capable of collecting a variety of metrics and then reporting their status to you in case a threshold is met.
Main Features:
- Based entirely on the cloud
- Datadog simplifies many of MongoDB monitoring’s more complex tasks
- Excellent pre-configured settings
- Flexible alerts system
Why do we recommend it?
Datadog, existing solely in the cloud, simplified MongoDB monitoring with its automation and focus on impactful metrics. Datadog’s automated scanning highlighted performance issues and potential bottlenecks in our MongoDB database, streamlining the monitoring process. Its cloud-based nature and pre-configured settings made deployment straightforward, while the flexible alerts system efficiently notified us of MongoDB status changes.
Once you’ve installed Datadog, it’ll automatically scan your network, shining a light on performance issues, queued task overloads, and many other common issues that plague the businesses of today. This makes monitoring MongoDB alongside all of the infrastructures it supports a breeze.
Making your own alerts is similarly simple. The Datadog alert system makes it so that you just need to follow 4 specific steps to set up alerts on a specific set of metrics. You can also make alerts for when a combination of different metrics goes over a certain threshold.
This is an excellent tool for larger, more organized companies. You can easily integrate Datadog with Slack, Telegram, or a similar messaging platform to have your whole team alerted whenever a threshold is met. You can even have a ticketing system like ServiceNow automatically create tickets when thresholds are met.
Who is it recommended for?
Datadog is recommended for larger, organized companies seeking a cloud-based MongoDB monitoring tool. Its integration capabilities with messaging platforms and ticketing systems make it suitable for collaborative environments.
7. HumongouS.io
Even though it might be a bit underground, HumongouS.io is quite the powerful MongoDB GUI for online use. Its main niche is that it excels in providing an excellent user experience for less technical users. So if you’re a startup or a firm that’s just starting to monitor their MongoDB databases, this might be the tool for you!
Main Features:
- It’s completely free
- Quick search and filter creation
- Although not created with monitoring in mind, a tool like this can be great for filling a very specific niche
- Mobile support, in addition to desktop
- You can pick the way you want to see your database
Why do we recommend it?
HumongouS.io, while not exclusively designed for monitoring, proved to be a valuable MongoDB GUI for users with less technical expertise. Its customizable widgets system allowed us to tailor the display of MongoDB collections, while its quick search and filter creation capabilities make it a great addition to the toolkit for startups or firms new to MongoDB monitoring.
Its robust widgets systems allow you to customize the way your collection is displayed. You can also directly invite anyone that needs to access the database from the HumngouS interface rather than sharing credentials around.
You can analyze its charts and dashboards in a very customizable manner. The tool is entirely online, and is ideal if you want a very hands-on approach to monitoring and want to use a lightweight tool to get it.
Who is it recommended for?
HumongouS.io is recommended for startups or firms looking for a lightweight and user-friendly MongoDB monitoring solution. Its online nature and mobile support enhance accessibility for users with varying technical backgrounds.
8. Nagios
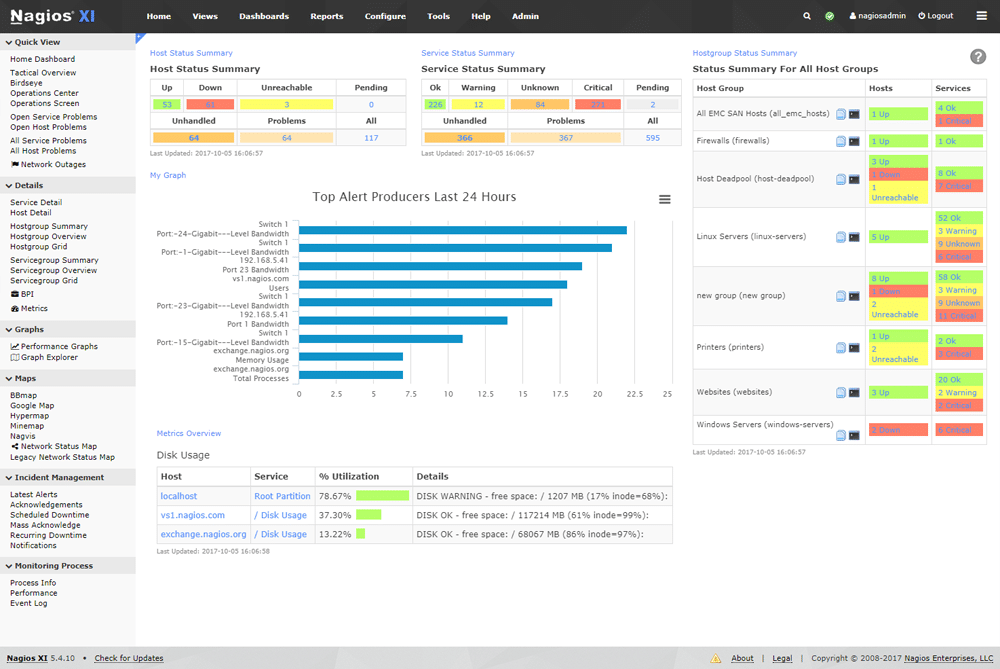
Nagios is a tool that offers database and app monitoring across the board, however, there are specific integrations geared towards including MongoDB in this platform. Nagios’s front-end is made to be easy to parse and simplify monitoring efforts in order to clean up more standard monitoring implementations.
By using its integration wizard, Nagios will start to pull data from MongoDB and show it to you on one of its pre-set dashboards, providing swift insight. Nagios excels at giving you high-level metrics coupled with historical statistics for you to compare them with. All of this can be looked at from anywhere from its online interface.
Main Features:
- Simplifies the standard monitoring setup by relying heavily on its automation capabilities
- Capacity planning utilities
- Excellent pre-configurations
- Extremely compact- Nagios can run off of the MongoDB server and only needs 2GB of your memory alongside 20GB of space
- You can strip down the simplicity to customize it when you like
- SLA reporting capabilities
Why do we recommend it?
Nagios, with specific integrations for MongoDB, offers a simplified monitoring setup through automation. Nagios’s auto-discovery feature kept track of changes in our MongoDB environment, aiding in capacity planning, system upgrades, and migrations.
Its capacity planning utilities and pre-configurations provide high-level metrics and historical statistics, making MongoDB monitoring straightforward.
Nagios actually does more than just monitoring. It also has capacity planning capabilities helping you grasp your average data usage as well as plan out migrations and system upgrades.
Due to its auto-discovery feature, Nagios can constantly keep track of your environment, tracking all changes that occur within, whether it’s the addition of a new item or the removal of an outdated device.
Much like the rest of Nagios, its pricing is very simple. There are two editions- Standard and Enterprise. The Standard edition gives you the simple configuration wizards, custom dashboards, and Nagios’s essential features for $1995 a year. The Enterprise edition costs $3495 a year but makes up for it with audit logging capabilities, SLA reports, and a variety of other features.
Who is it recommended for?
Nagios is recommended for users seeking a monitoring tool that simplifies the standard setup, with capacity planning capabilities. Its editions cater to different needs, from essential features to advanced capabilities, making it suitable for varying budgets.
9. Mongostat & Mongotop
Mongostat
This is MongoDB’s own monitoring tool. You can use Mongostat in order to get a real-time look at the status of your database. It’ll show you your database operations sorted by type, which lets you monitor closely what occurs to each section at all times.
Main Features:
- Takes snapshots of your operations and gives you all of your MongoDB operations sorted by type
- Is in-built into the MongoDB system, so there’s no need for any extra charges
- Helps with capacity planning
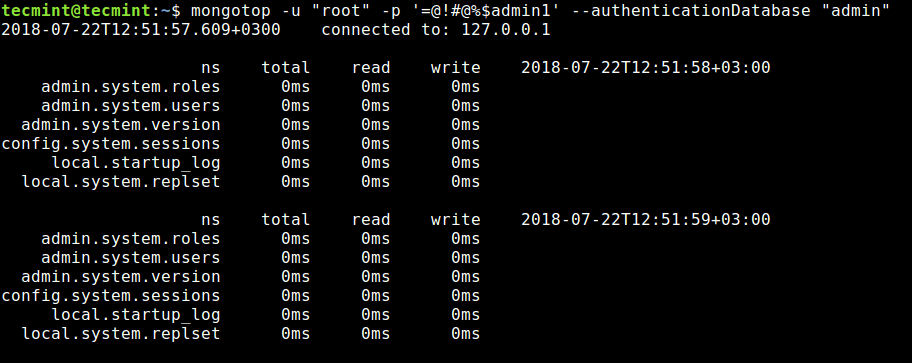
Mongotop
Mongotop is another critical tool in the MongoDB package used to extract real-time stats of your running MongoDB instances. It provides users with key information related to the time taken to read and write data. With this information, IT professionals can create an index strategy and decide how to scale MongoDB to enhance its efficiency.
Main Features:
- Mongotop’s server Status command shows you your database’s state and it gathers its statistics
- The dbStats command will take storage statistics for your MongoDB installation and display them
- CollStats will let you know the size and number of files within any dataset.
Why do we recommend it?
Mongostat and Mongotop, as MongoDB’s own monitoring tools, provide real-time insights into database operations and statistics. While comparatively low-power, they offer essential information for basic monitoring needs and are built in the MongoDB system. Mongostat’s real-time look at the status of our database operations allowed us to monitor and address issues promptly, providing a snapshot of MongoDB performance.
Mongotop excels the most when used to check if your database activities are matching up to set requirements.
Who is it recommended for?
Mongostat and Mongotop are recommended for users with basic MongoDB monitoring needs. While limited in versatility or customization options, they serve as built-in tools for quick insights into database operations and statistics. If you’re willing to invest into your database monitoring efforts, you can most likely do better than Mongostat and Mongotop.
Conclusion
There are a lot of very useful MongoDB monitoring tools, some of which are packaged together with MongoDB itself. With that being said, it’s usually a good idea to opt for a tool that was made for database monitoring in its entirety.
Site24x7 won out for us due to its power and versatility. With that being said, the most important thing to consider when getting a MongoDB monitoring tool is exactly that- your needs. Our top pick might not be yours. If all you need are the essentials of monitoring, then HumongouS.io or Mongostat & Mongotop might just be enough for you. Or if you want to cover a specific set of fields, the Paessler PRTG will let you do that extremely efficiently.
Did we miss your favorite MongoDB monitoring tool?
What do you value most for MongoDB monitoring?
Let us know in the comments below.